OmniDiagram: Advancing Unified Diagram Code Generation via Visual Interrogation Reward
Pith reviewed 2026-05-10 18:54 UTC · model grok-4.3
The pith
OmniDiagram trains code generators for many diagram languages by using self-generated visual questions to score rendered outputs in reinforcement learning.
A machine-rendered reading of the paper's core claim, the machinery that carries it, and where it could break.
Core claim
OmniDiagram is a unified framework incorporating diverse diagram code languages and task definitions. To align code logic with visual fidelity in reinforcement learning, it employs Visual Interrogation Verifies All (Viva), a generative strategy that actively produces targeted visual inquiries to scrutinize diagram visual fidelity and supplies fine-grained feedback for optimization. This enables a self-evolving training process that does not require manually annotated ground-truth code. Paired with supervised fine-tuning on the newly constructed M3²Diagram dataset of over 196k high-quality instances, the combination reaches new state-of-the-art performance across diagram code generation tasks
What carries the argument
Visual Interrogation Verifies All (Viva), the mechanism that generates targeted visual inquiries about rendered diagrams to produce fine-grained rewards for reinforcement learning without ground-truth annotations.
If this is right
- A single model can now handle a broader set of diagram languages and task formulations than earlier specialized systems.
- Training proceeds without paired ground-truth code annotations for every example.
- The self-evolving loop allows performance to improve iteratively from visual structure feedback alone.
- The released M3²Diagram dataset supplies scale for future training of diagram-related models.
- SOTA numbers are established on existing diagram code benchmarks when SFT is followed by Viva-based RL.
Where Pith is reading between the lines
- The same interrogation style of feedback could be adapted to other generation tasks where output is judged by rendered appearance, such as plot or UI code.
- If Viva-style questions prove reliable across diagram types, the method might reduce dependence on large labeled datasets in related multimodal code tasks.
- The unified framework opens the possibility of extending support to additional languages or tasks not covered in current benchmarks.
- Measuring how well Viva inquiries align with human judgments on diagram correctness would provide an independent check on the reward quality.
Load-bearing premise
The visual inquiries that Viva generates give accurate and unbiased feedback on diagram visual fidelity that reliably guides code improvements.
What would settle it
Training the same base model with Viva rewards replaced by syntax-only or random rewards and measuring whether performance on the benchmark suite stays at or above the reported SOTA level would directly test whether the visual interrogation step is necessary for the gains.
Figures


read the original abstract
The paradigm of programmable diagram generation is evolving rapidly, playing a crucial role in structured visualization. However, most existing studies are confined to a narrow range of task formulations and language support, constraining their applicability to diverse diagram types. In this work, we propose OmniDiagram, a unified framework that incorporates diverse diagram code languages and task definitions. To address the challenge of aligning code logic with visual fidelity in Reinforcement Learning (RL), we introduce a novel visual feedback strategy named Visual Interrogation Verifies All (\textsc{Viva}). Unlike brittle syntax-based rules or pixel-level matching, \textsc{Viva} rewards the visual structure of rendered diagrams through a generative approach. Specifically, \textsc{Viva} actively generates targeted visual inquiries to scrutinize diagram visual fidelity and provides fine-grained feedback for optimization. This mechanism facilitates a self-evolving training process, effectively obviating the need for manually annotated ground truth code. Furthermore, we construct M3$^2$Diagram, the first large-scale diagram code generation dataset, containing over 196k high-quality instances. Experimental results confirm that the combination of SFT and our \textsc{Viva}-based RL allows OmniDiagram to establish a new state-of-the-art (SOTA) across diagram code generation benchmarks.
Editorial analysis
A structured set of objections, weighed in public.
Referee Report
Summary. The paper introduces OmniDiagram, a unified framework supporting diverse diagram code languages and task formulations. It proposes Viva (Visual Interrogation Verifies All), a generative visual feedback strategy for RL that generates targeted inquiries to assess rendered diagram fidelity and supply rewards, enabling training without ground-truth annotations. The authors construct the M3²Diagram dataset containing over 196k instances and claim that SFT combined with Viva-based RL achieves new state-of-the-art results on diagram code generation benchmarks.
Significance. If the Viva feedback mechanism can be empirically validated as reliable and unbiased, the work could meaningfully advance annotation-efficient RL for structured visualization tasks by addressing the code-to-visual alignment problem in a scalable way. The release of the large-scale M3²Diagram dataset is a clear positive contribution that may serve as a foundation for future benchmark studies in programmable diagram generation.
major comments (2)
- Abstract: The central claim that SFT plus Viva-based RL establishes new SOTA performance is asserted without any reported metrics, baseline comparisons, ablation studies, or implementation details, leaving the experimental support for the primary result unverifiable from the manuscript text.
- Viva description (Abstract and method sections): The approach depends on the unvalidated assumption that generative visual inquiries produce accurate, unbiased, and fine-grained signals of diagram visual fidelity. No checks—such as inter-rater agreement with humans, correlation with pixel-level metrics, or ablation on interrogator quality—are provided, which is load-bearing because unreliable rewards could reinforce artifacts rather than genuine improvements in the RL stage.
Simulated Author's Rebuttal
We thank the referee for the constructive and detailed feedback. We address each major comment below and indicate the revisions we will make to strengthen the manuscript.
read point-by-point responses
-
Referee: Abstract: The central claim that SFT plus Viva-based RL establishes new SOTA performance is asserted without any reported metrics, baseline comparisons, ablation studies, or implementation details, leaving the experimental support for the primary result unverifiable from the manuscript text.
Authors: We agree that the abstract's brevity makes the SOTA claim difficult to verify at a glance. The full manuscript reports these details in Section 4 (Experiments), including quantitative tables comparing against baselines, ablation studies on the RL component, and implementation specifics. To address the concern directly, we will revise the abstract to include key performance metrics (e.g., relative improvements on the primary benchmarks) and a brief mention of the evaluation setup. revision: yes
-
Referee: Viva description (Abstract and method sections): The approach depends on the unvalidated assumption that generative visual inquiries produce accurate, unbiased, and fine-grained signals of diagram visual fidelity. No checks—such as inter-rater agreement with humans, correlation with pixel-level metrics, or ablation on interrogator quality—are provided, which is load-bearing because unreliable rewards could reinforce artifacts rather than genuine improvements in the RL stage.
Authors: We acknowledge that direct validation of the Viva reward signals is important for establishing reliability. The current manuscript supports Viva's utility through end-to-end performance gains over SFT-only training and qualitative examples of the generated inquiries. However, we agree that additional checks would strengthen the claims. We will add a dedicated validation subsection that reports correlation between Viva rewards and both human ratings and pixel-level structural metrics, plus an ablation varying the interrogator model. revision: yes
Circularity Check
No circularity; derivation relies on novel Viva mechanism, new dataset, and external benchmarks
full rationale
The paper introduces OmniDiagram as a unified framework, proposes Viva as a generative visual interrogation reward for RL without ground-truth annotations, and constructs the M3^2Diagram dataset. The SOTA claim is supported by experimental results on benchmarks rather than any self-definitional reduction, fitted parameter renamed as prediction, or load-bearing self-citation chain. The derivation chain remains self-contained with independent components and external evaluation.
Axiom & Free-Parameter Ledger
axioms (1)
- domain assumption Generative visual inquiries can reliably assess and improve the structural fidelity of rendered diagrams in an RL loop
invented entities (1)
-
Viva (Visual Interrogation Verifies All)
no independent evidence
Reference graph
Works this paper leans on
-
[1]
Starflow: Generating structured work- flow outputs from sketch images.arXiv preprint arXiv:2503.21889. Linzheng Chai, Jian Yang, Shukai Liu, Wei Zhang, Li- ran Wang, Ke Jin, Tao Sun, Congnan Liu, Chenchen Zhang, Hualei Zhu, and 1 others. 2025. Multilingual multimodal software developer for code generation. arXiv preprint arXiv:2507.08719. Lei Chen, Xuanle...
-
[2]
nvbench 2.0: Resolving ambiguity in text- to-visualization through stepwise reasoning.arXiv preprint arXiv:2503.12880. Yuansheng Ni, Songcheng Cai, Xiangchao Chen, Jiarong Liang, Zhiheng Lyu, Jiaqi Deng, Kai Zou, Ping Nie, Fei Yuan, Xiang Yue, and 1 others. 2025. Viscoder2: Building multi-language visualization coding agents.arXiv preprint arXiv:2510.2364...
-
[3]
Start: User initiates VPN connection\
Is the top-most node labeled \"Start: User initiates VPN connection\" colored green with a thick green outline?
-
[4]
Authentication server validates credentials\
Is there a diamond-shaped node with the text \"Authentication server validates credentials\"?
-
[5]
Is there an arrow labeled \"Yes\" originating from the diamond-shaped node and pointing to a blue node?
-
[6]
Is there an arrow labeled \"No\" originating from the diamond-shaped node and pointing to a red node?
-
[7]
Device sends authentication request\
Do all process nodes, such as \"Device sends authentication request\" and \"Authentication successful\", have a blue fill and a thick blue outline?
-
[8]
Are the connecting lines black arrows that have a stealth arrowhead style?
-
[9]
Encrypted VPN tunnel established\
Is the node labeled \"Encrypted VPN tunnel established\" colored red with a thick red outline?
-
[10]
Is the overall layout of the main VPN connection flow primarily vertical, moving from top to bottom?
-
[11]
Is the diagram free of any overlapping text or lines, ensuring all elements are clearly readable?
-
[12]
Diagram-to-Code Input: Output(Rendered): Questions:
Do all visible nodes (start, process, decision, end) feature rounded corners and a drop shadow effect? Figure 7: Qualitative example of visual verification questions for the Text-to-Code task. Diagram-to-Code Input: Output(Rendered): Questions:
-
[13]
Does the diagram contain a top-level node labeled 'Load Balancer'?
-
[14]
Are there two nodes labeled 'Web Server 1' and 'Web Server 2' positioned below the Load Balancer?
-
[15]
Is the text 'HTTP Requests' visible on the connections originating from the Load Balancer?
-
[16]
Does the diagram feature a central node labeled 'Application Server’?
-
[17]
Do the arrows connecting the Web Servers to the Application Server contain the label 'API Calls’?
-
[18]
Is there a node labeled 'Cache' positioned at the bottom-left of the structure?
-
[19]
Is the text 'Cache Responses' present on the link connecting to the Cache node?
-
[20]
Does the diagram contain a node labeled 'Database' at the bottom- right?
-
[21]
Is the text 'Query Results' visible on the connection leading to the Database node?
-
[22]
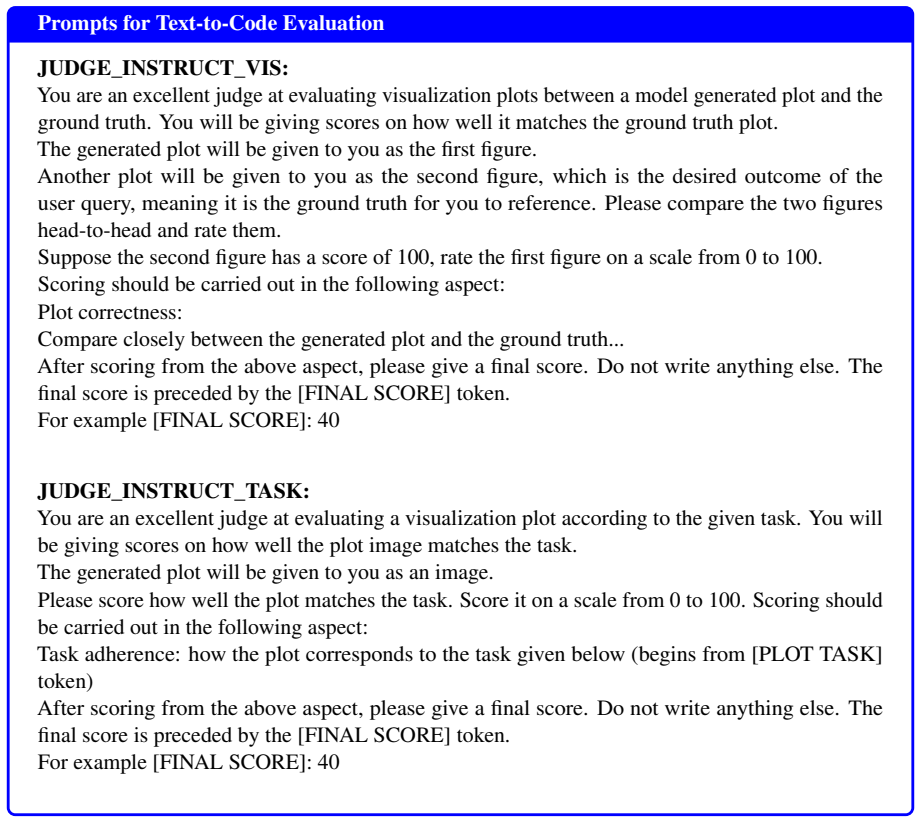
Are all nodes depicted as rounded rectangles with a light orange background and darker orange border? Figure 8: Qualitative example of visual verification questions for the Diagram-to-Code task. E Evaluation E.1 Prompt Used in Evaluation To ensure reproducibility, we provide the exact sys- tem prompts used for our GPT-4.1-based evalua- tion. Figure 14 ill...
work page 2022
-
[23]
Do all the rectangular nodes display rounded corners instead of sharp 90-degree angles?
-
[24]
Is the interior fill color of the nodes a soft, light blue?
-
[25]
Is a darker blue border clearly visible outlining each node?
-
[26]
Does the border line width appear consistent and distinct across all nodes?
-
[27]
Is the diagram completely free of any sharp-cornered, white-filled nodes?
-
[28]
Does the 'Customer Relationship Management' node match the rounded blue style of the other nodes? 7.Are the text labels inside the nodes clearly legible against the light blue background?
-
[29]
Do the connecting arrows remain correctly attached to the boundaries of the modified nodes?
-
[30]
Is the diagram free of any broken or floating connections resulting from the style change?
-
[31]
Does the overall diagram maintain a consistent visual theme across all block elements? Figure 9: Qualitative example of visual verification questions for the Diagram Editing task. cess rate of specific modifications requested by the user (e.g., color changes or node deletions), focus- ing strictly on the execution of the edit instruction. Content Preserva...
work page 2025
-
[32]
You MUST return a single, valid JSON object
-
[33]
The JSON object MUST contain exactly one key: "topics"
-
[34]
The value of "topics" MUST be a JSON array of strings
-
[35]
Each string in the array should be a 2-3 sentence topic description corresponding to one set of keywords from the user input
-
[36]
User Prompt: Please generate topic descriptions for the following 3 characters
The number of strings in the array MUST EXACTLY match the number of keyword sets provided. User Prompt: Please generate topic descriptions for the following 3 characters. Return the result as a JSON object according to the system instructions
-
[37]
Keywords: Name=Alex, Age=32, Profession=Software Engineer, Trait=innovative problem solving, Goal=to streamline a complex workflow
-
[38]
Keywords: Name=Jordan, Age=45, Profession=Product Manager, Trait=user-centric design, Goal=to map out a new user experience
-
[39]
Keywords: Name=Taylor, Age=28, Profession=Data Analyst, Trait=data-driven, Goal=to present data insights to stakeholders Figure 10: The prompt template used for generating different topics to set scene limitations. size, pointing to a persistent bottleneck in handling strict domain specific languages. These failures typically occur in diagrams featuring m...
-
[40]
a Sequence Diagram illustrating a user login process with two-factor authentication
Each topic is a high-level summary of the contents in the diagram with some design details, e.g., “a Sequence Diagram illustrating a user login process with two-factor authentication”
-
[41]
Each topic should be unique and not overlap with others
The topics should be diverse to help me generate varied diagrams. Each topic should be unique and not overlap with others
-
[42]
The topics are strictly conditioned on the Mermaid diagram type. Please ensure the topics you provided can be best visualized in “{figure_type}”
-
[43]
All topics must be in English, even if the scenario is non-English
-
[44]
List{num_topics} topics for “{scenario}” and separate them with a | character, e.g., topic1 | topic2 | ...... | topic{num_topics}. Do not include any additional text at the beginning or end of your response. Figure 11: The prompt template used for generating diverse diagram scenario based on user topics and specific diagram types. ral language reasoning c...
-
[45]
The data should be highly structured as a JSON object, with its schema tailored specifically for the “{figure_type}” syntax. For example, for a Class Diagram, the JSON should contain a list of ‘classes’ and a list of ‘relationships’
-
[46]
Do not use placeholder names like xxA, xxB, etc
The data should be realistic, and the contents should be named using real-world entities. Do not use placeholder names like xxA, xxB, etc
-
[47]
Do not provide too many elements; just the key information
The elements should be concise and directly map to a meaningful diagram. Do not provide too many elements; just the key information
-
[48]
All elements must be in English, even if the topic is non-English
-
[49]
{topic}”. I have a JSON object of structured data about “{scenario}
You can use the provided JSON templates to structure decision-based flows. If the topic is related to decision-making or conditional logic, please use or adapt the templates provided in the<templates>block. Figure 12: The prompt template used for generating structured JSON data elements tailored to specific Mermaid diagram types and topics. 19 Prompts for...
-
[50]
The code must be a valid and complete Mermaid mindmap script adhering strictly to syntax rules
-
[51]
The code must start with “mindmap”. The “mindmap” keyword is reserved
-
[52]
All child nodes MUST be indented more deeply than their parent
Indentation is the ONLY way to define the hierarchy. All child nodes MUST be indented more deeply than their parent. Consistent indentation (e.g., 2 or 4 spaces) is required
-
[53]
Do not include any additional text outside of the Mermaid code block
-
[54]
CRITICAL RULE: A mindmap can only have ONE SINGLE ROOT NODE
The code must be self-contained within the“‘mermaid...“‘block. CRITICAL RULE: A mindmap can only have ONE SINGLE ROOT NODE. • The first line of the mindmap defines the root. • All other nodes MUST BE indented under this root node. • Any line with zero indentation (nodes or styles) will be treated as a second root, causing a fatal error. IMPORTANT: Styling...
discussion (0)
Sign in with ORCID, Apple, or X to comment. Anyone can read and Pith papers without signing in.