Recognition: 1 theorem link
· Lean TheoremA Benchmark of Classical and Deep Learning Models for Agricultural Commodity Price Forecasting on A Novel Bangladeshi Market Price Dataset
Pith reviewed 2026-05-14 23:20 UTC · model grok-4.3
The pith
Naive persistence outperforms complex models on most Bangladeshi agricultural commodity prices
A machine-rendered reading of the paper's core claim, the machinery that carries it, and where it could break.
Core claim
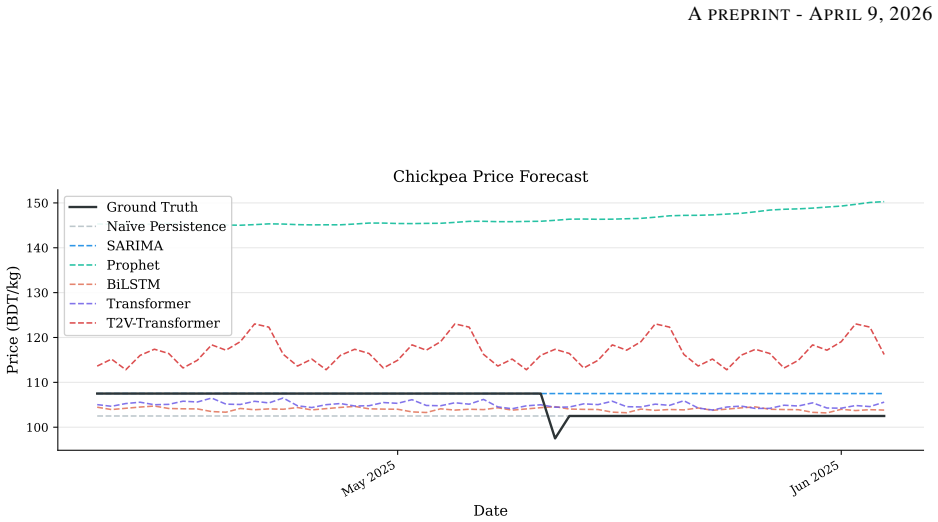
Commodity price forecastability is fundamentally heterogeneous: naïve persistence dominates on near-random-walk commodities. Time2Vec temporal encoding provides no statistically significant advantage over fixed sinusoidal encoding and causes catastrophic degradation on green chilli. Prophet fails systematically, attributable to discrete step-function price dynamics incompatible with its smooth decomposition assumptions. Informer produces erratic predictions with variance up to 50x ground-truth.
What carries the argument
The AgriPriceBD dataset of 1,779 daily mid-prices together with the multi-model benchmark and Diebold-Mariano tests that measure performance differences across the five commodities.
If this is right
- Naive persistence serves as the appropriate baseline for any near-random-walk agricultural price series.
- Fixed sinusoidal positional encoding is preferable to Time2Vec for temporal features in this setting.
- Prophet cannot be applied directly to prices that change in discrete steps rather than smooth trends.
- Sparse-attention architectures like Informer need substantially larger training sets than the available five-year series to avoid erratic outputs.
Where Pith is reading between the lines
- Model choice for small agricultural price series should be driven by commodity-specific diagnostics rather than a single architecture.
- The released dataset allows direct testing of hybrid or commodity-tailored methods for food-security applications in data-limited regions.
- Similar heterogeneity in forecastability may appear in other South Asian or developing-economy price series.
Load-bearing premise
The LLM-assisted digitisation pipeline produces accurate price values without systematic transcription errors, and the five-year daily series supplies enough clean data for stable model evaluation.
What would settle it
An independent check that finds systematic transcription errors in the extracted prices, or a re-run of the tests on held-out data in which any deep model achieves statistically lower error than naive persistence on multiple commodities.
Figures


read the original abstract
Accurate short-term forecasting of agricultural commodity prices is critical for food security planning and smallholder income stabilisation in developing economies, yet machine-learning-ready datasets for this purpose remain scarce in South Asia. This paper makes two contributions. First, we introduce AgriPriceBD, a benchmark dataset of 1,779 daily retail mid-prices for five Bangladeshi commodities - garlic, chickpea, green chilli, cucumber, and sweet pumpkin - spanning July 2020 to June 2025, extracted from government reports via an LLM-assisted digitisation pipeline. Second, we evaluate seven forecasting approaches spanning classical models - na\"{i}ve persistence, SARIMA, and Prophet - and deep learning architectures - BiLSTM, Transformer, Time2Vec-enhanced Transformer, and Informer - with Diebold-Mariano statistical significance tests. Commodity price forecastability is fundamentally heterogeneous: na\"{i}ve persistence dominates on near-random-walk commodities. Time2Vec temporal encoding provides no statistically significant advantage over fixed sinusoidal encoding and causes catastrophic degradation on green chilli (+146.1% MAE, p<0.001). Prophet fails systematically, attributable to discrete step-function price dynamics incompatible with its smooth decomposition assumptions. Informer produces erratic predictions (variance up to 50x ground-truth), confirming sparse-attention Transformers require substantially larger training sets than small agricultural datasets provide. All code, models, and data are released publicly to support replication and future forecasting research on agricultural commodity markets in Bangladesh and similar developing economies.
Editorial analysis
A structured set of objections, weighed in public.
Referee Report
Summary. The manuscript introduces AgriPriceBD, a new benchmark dataset of 1,779 daily retail mid-prices for five Bangladeshi commodities (garlic, chickpea, green chilli, cucumber, sweet pumpkin) spanning July 2020–June 2025, extracted from government reports via an LLM-assisted digitisation pipeline. It evaluates seven forecasting models—naïve persistence, SARIMA, Prophet, BiLSTM, Transformer, Time2Vec-enhanced Transformer, and Informer—using Diebold-Mariano tests on held-out data, reporting heterogeneous forecastability in which naïve persistence dominates near-random-walk series, Time2Vec causes +146.1% MAE degradation on green chilli (p<0.001), Prophet fails on step-function dynamics, and Informer yields up to 50× variance inflation.
Significance. If the extracted prices are numerically faithful, the work provides a valuable public resource for South Asian agricultural forecasting research and demonstrates that complex temporal encodings and sparse-attention Transformers can underperform simple baselines on small daily commodity series. The public release of data, code, and models is a clear strength that supports replication and extension.
major comments (2)
- [§3.2] §3.2 (Dataset Construction): No quantitative validation of the LLM digitisation pipeline (error rates, bias checks, or manual audit sample) is reported. This is load-bearing because systematic transcription errors in the government tables would directly change all reported MAE values, variance ratios, and Diebold-Mariano p-values, including the specific +146.1% degradation finding on green chilli.
- [§4.1] §4.1 (Experimental Setup): The precise train-test split dates or ratio are not stated explicitly. This detail is required to confirm the absence of look-ahead bias and to allow exact reproduction of the reported performance ordering across the five-year series.
minor comments (2)
- [Table 3] Table 3: The variance-ratio column would benefit from an explicit definition (e.g., model variance divided by ground-truth variance) and a note on how the 50× figure for Informer is computed.
- [§5.3] §5.3: The attribution of Prophet’s failure to “discrete step-function price dynamics” is plausible but would be strengthened by a short illustrative plot of one commodity’s price path alongside Prophet’s decomposition.
Simulated Author's Rebuttal
We thank the referee for their positive assessment of the manuscript and for the constructive comments. We address each major point below and will revise the manuscript accordingly to improve clarity and reproducibility.
read point-by-point responses
-
Referee: [§3.2] §3.2 (Dataset Construction): No quantitative validation of the LLM digitisation pipeline (error rates, bias checks, or manual audit sample) is reported. This is load-bearing because systematic transcription errors in the government tables would directly change all reported MAE values, variance ratios, and Diebold-Mariano p-values, including the specific +146.1% degradation finding on green chilli.
Authors: We acknowledge that the current manuscript lacks quantitative validation of the LLM-assisted digitisation pipeline. In the revised version we will add a dedicated subsection under Dataset Construction that reports the results of a manual audit performed on a stratified random sample of 200 price entries (approximately 11% of the full dataset). The audit will include per-commodity transcription error rates, a bias check against the original government PDF tables, and inter-annotator agreement statistics between two independent human reviewers. We will also release the audit log alongside the dataset to allow readers to assess the numerical fidelity of the extracted prices. revision: yes
-
Referee: [§4.1] §4.1 (Experimental Setup): The precise train-test split dates or ratio are not stated explicitly. This detail is required to confirm the absence of look-ahead bias and to allow exact reproduction of the reported performance ordering across the five-year series.
Authors: We agree that the exact chronological split must be stated explicitly. In the revised manuscript we will add the following sentence to §4.1: “The data are partitioned chronologically with the training period running from 1 July 2020 to 31 December 2023 (1,278 observations) and the test period from 1 January 2024 to 30 June 2025 (501 observations), corresponding to an 80/20 temporal split that respects the time-series nature of the problem and eliminates look-ahead bias.” This information will also be added to the public code repository for exact reproducibility. revision: yes
Circularity Check
Purely empirical benchmark with no derivations reducing to inputs
full rationale
The paper introduces AgriPriceBD via LLM digitization and evaluates seven models (naive persistence, SARIMA, Prophet, BiLSTM, Transformer, Time2Vec-Transformer, Informer) using held-out MAE, variance ratios, and Diebold-Mariano tests on five commodity series. No equations derive predictions from fitted parameters, no self-citations supply load-bearing uniqueness theorems, and no ansatzes or renamings of known results occur. All heterogeneity claims (naive dominance, Time2Vec degradation on green chilli, Prophet failure) rest on direct test-set statistics, rendering the work self-contained with no circular reduction.
Axiom & Free-Parameter Ledger
Lean theorems connected to this paper
-
IndisputableMonolith/Foundation/AbsoluteFloorClosure.leanreality_from_one_distinction unclear?
unclearRelation between the paper passage and the cited Recognition theorem.
We evaluate seven forecasting approaches spanning classical models—naïve persistence, SARIMA, and Prophet—and deep learning architectures—BiLSTM, a vanilla Transformer, a Time2Vec-enhanced Transformer, and Informer
What do these tags mean?
- matches
- The paper's claim is directly supported by a theorem in the formal canon.
- supports
- The theorem supports part of the paper's argument, but the paper may add assumptions or extra steps.
- extends
- The paper goes beyond the formal theorem; the theorem is a base layer rather than the whole result.
- uses
- The paper appears to rely on the theorem as machinery.
- contradicts
- The paper's claim conflicts with a theorem or certificate in the canon.
- unclear
- Pith found a possible connection, but the passage is too broad, indirect, or ambiguous to say the theorem truly supports the claim.
Reference graph
Works this paper leans on
-
[1]
Joschka Herteux, Christoph Raeth, Giulia Martini, Amine Baha, Kyriacos Koupparis, Ilaria Lauzana, and Duccio Piovani. Forecasting trends in food security with real time data.Communications Earth & Environment, 5(1):611, 2024
work page 2024
-
[2]
The state of food security and nutrition in the world 2023.FAO, 2023
FAO, IFAD, UNICEF, WFP and WHO. The state of food security and nutrition in the world 2023.FAO, 2023
work page 2023
-
[3]
Anket Patil, Dhairya Shah, Abhishek Shah, and Radhika Kotecha. Forecasting prices of agricultural commodities using machine learning for global food security: Towards sustainable development goal 2.International Journal of Engineering Trends and Technology, 71(12):277–291, 2023
work page 2023
-
[4]
MF Hassan, MA Islam, MF Imam, and SM Sayem. Forecasting wholesale price of coarse rice in bangladesh: A seasonal autoregressive integrated moving average approach.Journal of the Bangladesh Agricultural University, 11(2):271–276, 2013
work page 2013
-
[5]
Ascertaining the fluctuation of rice price in bangladesh using machine learning approach
Md Mehedi Hasan, Muslima Tuz Zahara, Md Mahamudunnobi Sykot, Arafat Ullah Nur, Mohd Saifuzzaman, and Rubaiya Hafiz. Ascertaining the fluctuation of rice price in bangladesh using machine learning approach. In2020 11th International Conference on Computing, Communication and Networking Technologies (ICCCNT), pages 1–5. IEEE, 2020. 14 APREPRINT- APRIL9, 2026
work page 2020
-
[6]
Abdullah Al Imran, Zaman Wahid, Alpana Akhi Prova, and Md Hannan. Harnessing the meteorological effect for predicting the retail price of rice in bangladesh.International Journal of Business Intelligence and Data Mining, 20(4):440–455, 2022
work page 2022
-
[7]
Forecasting at scale.The American Statistician, 72(1):37–45, 2018
Sean J Taylor and Benjamin Letham. Forecasting at scale.The American Statistician, 72(1):37–45, 2018
work page 2018
-
[8]
Informer: Beyond efficient transformer for long sequence time-series forecasting
Haoyi Zhou, Shanghang Zhang, Jieqi Peng, Shuai Zhang, Jianxin Li, Hui Xiong, and Wancai Zhang. Informer: Beyond efficient transformer for long sequence time-series forecasting. InProceedings of the AAAI conference on artificial intelligence, volume 35, pages 11106–11115, 2021
work page 2021
-
[9]
George EP Box, Gwilym M Jenkins, Gregory C Reinsel, and Greta M Ljung.Time series analysis: forecasting and control. John Wiley & Sons, 2015
work page 2015
-
[10]
Rob J Hyndman and George Athanasopoulos.Forecasting: principles and practice. OTexts, 2018
work page 2018
-
[11]
Price forecasting for vegetables using sarima-lstm and multitask learning
Suresh Babu Dasari, Hemanth Suresh Para, and Dheeraz Chaduvula. Price forecasting for vegetables using sarima-lstm and multitask learning. In2025 3rd International Conference on Inventive Computing and Informatics (ICICI), pages 1140–1146. IEEE, 2025
work page 2025
-
[12]
Pradeep Mishra, Aynur Yonar, Harun Yonar, Binita Kumari, Mostafa Abotaleb, Soumitra Sankar Das, and SG Patil. State of the art in total pulse production in major states of india using arima techniques.Current Research in Food Science, 4:800–806, 2021
work page 2021
-
[13]
Ranjit Kumar Paul, Md Yeasin, C Tamilselvi, A K Paul, Purushottam Sharma, and Pratap S Birthal. Can deep learning models enhance the accuracy of agricultural price forecasting? insights from india.Intelligent Systems in Accounting, Finance and Management, 32(1):e70002, 2025
work page 2025
-
[14]
Muhammad Aslam, Jong-Suk Kim, and Jaehoon Jung. N-beats deep learning architecture for agricultural commodity price forecasting.Potato Research, 2024
work page 2024
-
[15]
Long short-term memory.Neural computation, 9(8):1735–1780, 1997
Sepp Hochreiter and Jürgen Schmidhuber. Long short-term memory.Neural computation, 9(8):1735–1780, 1997
work page 1997
-
[16]
Mohd Shahrin Bahar, Imbarine Bujang, Abdul Aziz Karia, and Nur Zahidah Bahrudin. A dual methods approach to crude palm oil price forecasting in malaysia: Insights from ardl and lstm.Burgas Free University (BFU), 2024(2008):106–124, 2024
work page 2024
-
[17]
Andi Illa Erviani Nensi, Windi Pangesti, Nabila Syukri, Mahda Al Maida, and Khairil Anwar Notodiputro. Implementing lstm-based deep learning for forecasting food commodity prices with high volatility: A case study in east java province. InProceedings of The International Conference on Data Science and Official Statistics, volume 2025, pages 1032–1041, 2025
work page 2025
-
[18]
RL Manogna, Vijay Dharmaji, and S Sarang. Enhancing agricultural commodity price forecasting with deep learning.Scientific Reports, 15(1):20903, 2025
work page 2025
-
[19]
Rahul Singh et al. Deep learning-enabled cherry price forecasting and real-time system deployment across multi-market supply chains in india.Scientific Reports, 15, 2025
work page 2025
-
[20]
Murat Sari, Serbay Duran, Huseyin Kutlu, Bulent Guloglu, and Zehra Atik. Various optimized machine learning techniques to predict agricultural commodity prices.Neural Computing and Applications, 36(19):11439–11459, 2024
work page 2024
-
[21]
Attention is all you need.Advances in neural information processing systems, 30, 2017
Ashish Vaswani, Noam Shazeer, Niki Parmar, Jakob Uszkoreit, Llion Jones, Aidan N Gomez, Łukasz Kaiser, and Illia Polosukhin. Attention is all you need.Advances in neural information processing systems, 30, 2017
work page 2017
-
[22]
A Time Series is Worth 64 Words: Long-term Forecasting with Transformers
Yuqi Nie, Nam H Nguyen, Phanwadee Sinthong, and Jayant Kalagnanam. A time series is worth 64 words: Long-term forecasting with transformers.arXiv preprint arXiv:2211.14730, 2022
work page internal anchor Pith review Pith/arXiv arXiv 2022
-
[23]
Time2Vec: Learning a Vector Representation of Time
Seyed Mehran Kazemi, Rishab Goel, Sepehr Eghbali, Janahan Ramanan, Jaspreet Sahota, Sanjay Thakur, Stella Wu, Cathal Smyth, Pascal Poupart, and Marcus Brubaker. Time2vec: Learning a vector representation of time. arXiv preprint arXiv:1907.05321, 2019
work page internal anchor Pith review Pith/arXiv arXiv 1907
-
[24]
Tashreef Muhammad, Anika Bintee Aftab, Muhammad Ibrahim, Md Mainul Ahsan, Maishameem Meherin Muhu, Shahidul Islam Khan, and Mohammad Shafiul Alam. Transformer-based deep learning model for stock price prediction: A case study on bangladesh stock market.International Journal of Computational Intelligence and Applications, 22(03):2350013, 2023
work page 2023
-
[25]
AGMARKNET: Agricultural marketing informa- tion network.https://agmarknet.gov.in/, 2024
Government of India, Directorate of Marketing and Inspection. AGMARKNET: Agricultural marketing informa- tion network.https://agmarknet.gov.in/, 2024. Accessed 2025
work page 2024
-
[26]
Taufiqul Islam, Tanmoy Mazumder, Md Nishad Shahriair Roni, and Md Sadmin Nur. A comparative study of machine learning models for predicting aman rice yields in bangladesh.Heliyon, 10(23), 2024
work page 2024
-
[27]
Ian Goodfellow, Yoshua Bengio, and Aaron Courville.Deep Learning. MIT Press, 2016. 15 APREPRINT- APRIL9, 2026
work page 2016
-
[28]
Adam: A Method for Stochastic Optimization
Diederik P Kingma and Jimmy Ba. Adam: A method for stochastic optimization.arXiv preprint arXiv:1412.6980, 2014
work page internal anchor Pith review Pith/arXiv arXiv 2014
-
[29]
Comparing predictive accuracy.Journal of Business & Economic Statistics, 13(3):253–263, 1995
Francis X Diebold and Roberto S Mariano. Comparing predictive accuracy.Journal of Business & Economic Statistics, 13(3):253–263, 1995
work page 1995
-
[30]
Testing the equality of prediction mean squared errors
David Harvey, Stephen Leybourne, and Paul Newbold. Testing the equality of prediction mean squared errors. International Journal of Forecasting, 13(2):281–291, 1997
work page 1997
-
[31]
Kaixuan Sun, Qi Yao, and Yanhui Li. A novel agricultural commodity price prediction model integrating deep learning and enhanced swarm intelligence algorithm.PLOS ONE, 2025
work page 2025
-
[32]
Spyros Makridakis, Evangelos Spiliotis, and Vassilis Assimakopoulos. M5 accuracy competition: Results, findings, and conclusions.International Journal of Forecasting, 38(4):1346–1364, 2022. A Figures 0 200 400 600 800 1000 Test-set Day Index 85 90 95 100 105 110 115 120 125Garlic Price (BDT/kg) Informer Collapse on Garlic Test Set ProbSparse attention deg...
work page 2022
discussion (0)
Sign in with ORCID, Apple, or X to comment. Anyone can read and Pith papers without signing in.