Large or bright satellite constellations: Effects on observations, including on the background sky brightness
Pith reviewed 2026-05-10 16:18 UTC · model grok-4.3
The pith
Proposed satellite constellations with over a million objects or bright reflectors would substantially increase sky background and make trails pervasive in astronomical images.
A machine-rendered reading of the paper's core claim, the machinery that carries it, and where it could break.
Core claim
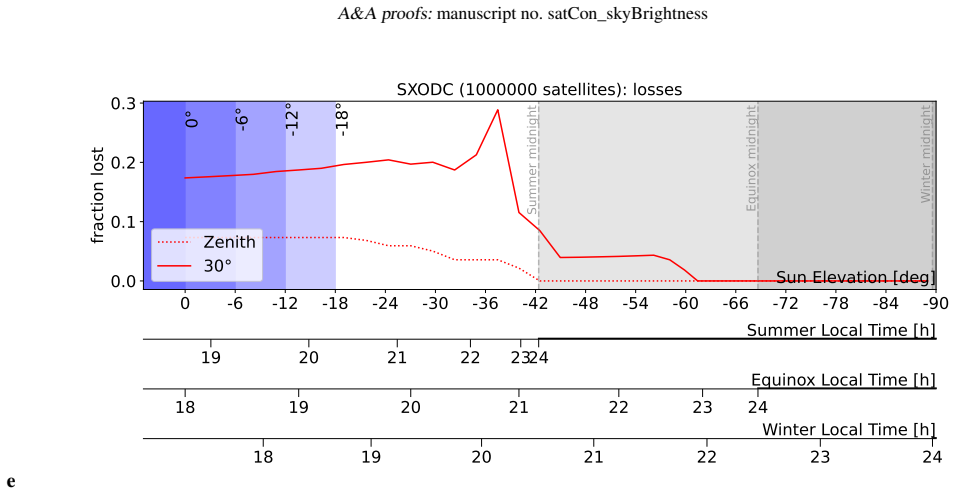
Using a numerical model for Mie and Rayleigh scattering in the V band adapted from moonlight sky-brightness calculations and validated against observations, combined with the SatConAnalytic package, the study shows that constellations of about 60,000 satellites with V_550km > 7 contribute negligibly to sky brightness at about 10^{-4} of the natural dark sky, whereas mega-constellations with 10^6 satellites make trails pervasive, bright satellites such as those from AST SpaceMobile affect saturating detectors even in moderate numbers, and extremely bright designs like a 5,000-satellite Reflect Orbital-like constellation elevate scattered background by 20-30 percent with 50,000 increasing it 2
What carries the argument
Numerical model for Mie and Rayleigh scattering in the V band combined with the SatConAnalytic package to quantify scattered light, diffuse light from undetected satellites, and direct trail losses.
Load-bearing premise
The numerical model for Mie and Rayleigh scattering in the V band accurately predicts the scattered and diffuse light contributions from the satellite populations considered.
What would settle it
Measurement of actual V-band sky brightness and trail statistics under a known satellite population of several thousand objects at known altitudes, compared directly to the model's zero-satellite baseline.
Figures




read the original abstract
This study evaluates the effect of proposed constellations -- ranging from current deployments to mega-constellations and very bright reflector concepts -- on direct trail losses, diffuse background, and scattered sky brightness. We use a numerical model for Mie and Rayleigh scattering in the V band, adapted from moonlight sky-brightness calculations and validated against observations of moonlight and stellar background light. This is combined with the SatConAnalytic package to quantify scattered light, diffuse light from undetected satellites, and direct losses from detected trails. Constellations comprising approximately 60,000 satellites that adhere to the V_550km > 7 recommendation exert a negligible effect on sky brightness, contributing only about 10^-4 of the natural dark sky. Conversely, mega-constellations with 10^6 satellites render trails pervasive. Bright satellites, such those from AST SpaceMobile, significantly impact saturating detectors even when their number is moderate. Extremely bright satellites pose a far more severe threat: a 5000-satellite Reflect Orbital-like constellation elevates the scattered sky background by 20%-30%, and a population of 50,000 increases it by 200%-300%. The constellations currently proposed for launch, over 1,700,000 objects and including satellites brighter than V_550km = 7, would substantially degrade observations. Maintaining satellite brightness below V_550km = 7 is important for all instruments, but critical for safeguarding saturating instruments, such as the VRO LSST camera and for limiting sky-background pollution. Even under this constraint, the total satellite population must remain below ~100,000 satellites to ensure that field-of-view losses do not exceed typical technical downtime.
Editorial analysis
A structured set of objections, weighed in public.
Referee Report
Summary. The paper evaluates impacts of satellite constellations (current to mega-scale and bright-reflector concepts) on astronomical observations via direct trail losses, diffuse background, and scattered sky brightness. It combines a V-band Mie+Rayleigh scattering model (adapted from moonlight calculations and validated on moonlight/stellar data) with the SatConAnalytic package to quantify effects. Key results: ~60k satellites with V_550km > 7 add only ~10^{-4} to dark-sky brightness (negligible); 10^6 satellites make trails pervasive; 5k bright reflectors raise background 20-30% and 50k raise it 200-300%; proposed >1.7M objects including bright satellites would substantially degrade observations. Recommendations: enforce V_550km > 7 for all instruments (critical for LSST) and cap total population below ~100k to keep FOV losses within typical downtime.
Significance. If the quantitative thresholds hold, the work supplies actionable limits for constellation design that directly protect wide-field surveys and saturating detectors. The integration of an established scattering framework with SatConAnalytic outputs provides a reproducible pathway for future updates as populations evolve. The emphasis on both brightness and number caps addresses two distinct observational threats.
major comments (3)
- [Abstract / scattering model section] Abstract and scattering-model description: the central claim that 60k satellites adhering to V_550km > 7 contribute only ~10^{-4} of natural dark-sky brightness rests on the adapted Mie+Rayleigh model. Validation is reported against moonlight (one extended source at known phase) and stellar background, yet no explicit test or sensitivity run is shown for the cumulative diffuse contribution from many moving point/trail sources at optical depths ~10^{-4}; phase-function averaging and possible multiple-scattering differences could shift the reported increment by a factor of several.
- [Results on bright satellites] Results on bright-reflector constellations: the reported 20-30% background increase for a 5k-satellite Reflect Orbital-like population and 200-300% for 50k satellites are load-bearing for the 'substantially degrade' conclusion. These percentages lack accompanying uncertainty estimates, sensitivity to orbital-phase averaging, or detection-threshold assumptions, so it is unclear how robust the factors of 10-20 difference between moderate and large bright populations are.
- [Discussion / recommendations] Population-limit derivation: the ~100k total-satellite cap (to keep FOV losses within typical technical downtime) is derived from SatConAnalytic outputs under the V_550km > 7 constraint. The specific assumptions on trail detection thresholds, orbital density distributions, and how 'pervasive' is quantified for 10^6 objects should be stated explicitly so the threshold can be reproduced or updated with new constellation parameters.
minor comments (2)
- [Abstract] Clarify the precise definition and reference altitude for the V_550km magnitude threshold; it is used repeatedly but its photometric system and phase-angle convention are not restated in the abstract.
- [Methods] Add a short reproducibility note on the SatConAnalytic version and input orbital-element distributions used for the 60k, 10^6, and bright-reflector cases.
Simulated Author's Rebuttal
We thank the referee for their detailed and constructive review, which has identified important areas for clarification in our analysis of satellite constellation impacts. We address each major comment below and indicate the revisions we will make.
read point-by-point responses
-
Referee: [Abstract / scattering model section] Abstract and scattering-model description: the central claim that 60k satellites adhering to V_550km > 7 contribute only ~10^{-4} of natural dark-sky brightness rests on the adapted Mie+Rayleigh model. Validation is reported against moonlight (one extended source at known phase) and stellar background, yet no explicit test or sensitivity run is shown for the cumulative diffuse contribution from many moving point/trail sources at optical depths ~10^{-4}; phase-function averaging and possible multiple-scattering differences could shift the reported increment by a factor of several.
Authors: We appreciate the referee pointing out the need for more explicit validation of the diffuse contribution. The Mie+Rayleigh model is taken from established moonlight calculations (which treat an extended source) and cross-checked against stellar background data for point sources. At the low optical depths (~10^{-4}) involved, scattering remains in the linear single-scattering regime, with multiple scattering negligible as in the original moonlight framework; phase averaging is performed by integrating over satellite positions and illumination angles within SatConAnalytic. To address the concern directly, we will add a short sensitivity subsection (or appendix) in the revised manuscript that tests the cumulative trail contribution under varied phase functions and confirms linearity at these depths. revision: partial
-
Referee: [Results on bright satellites] Results on bright-reflector constellations: the reported 20-30% background increase for a 5k-satellite Reflect Orbital-like population and 200-300% for 50k satellites are load-bearing for the 'substantially degrade' conclusion. These percentages lack accompanying uncertainty estimates, sensitivity to orbital-phase averaging, or detection-threshold assumptions, so it is unclear how robust the factors of 10-20 difference between moderate and large bright populations are.
Authors: The quoted percentage increases are direct outputs of the scattering model applied to the brightness and number distributions supplied by SatConAnalytic. The order-of-magnitude difference between the 5k and 50k cases follows from the linear scaling of total scattered flux with satellite count under fixed brightness. We agree that the original submission omitted formal uncertainty ranges and sensitivity tests. In revision we will add (i) approximate uncertainty bands derived from variations in orbital-phase sampling and (ii) a brief sensitivity table showing how the reported factors change under plausible shifts in detection threshold and phase averaging, thereby demonstrating robustness. revision: yes
-
Referee: [Discussion / recommendations] Population-limit derivation: the ~100k total-satellite cap (to keep FOV losses within typical technical downtime) is derived from SatConAnalytic outputs under the V_550km > 7 constraint. The specific assumptions on trail detection thresholds, orbital density distributions, and how 'pervasive' is quantified for 10^6 objects should be stated explicitly so the threshold can be reproduced or updated with new constellation parameters.
Authors: We concur that reproducibility requires explicit statement of the underlying assumptions. The ~100k limit is obtained from SatConAnalytic runs in which trail losses for 10^6 satellites exceed the fraction of exposures typically lost to technical downtime. In the revised discussion we will specify (a) the trail detection threshold (minimum S/N for reliable identification in a single exposure), (b) the orbital density and altitude distributions adopted, and (c) the quantitative definition of 'pervasive' (e.g., trails affecting >50% of exposures or a stated percentage of the field of view). These additions will allow the threshold to be updated with future constellation parameters. revision: yes
Circularity Check
No significant circularity; derivation relies on external models and packages
full rationale
The paper adapts its Mie/Rayleigh V-band scattering model from prior moonlight sky-brightness calculations (external literature) and validates it against independent observations of moonlight and stellar background light. It then combines this with the SatConAnalytic package to compute contributions for given satellite populations. No load-bearing step reduces by construction to a parameter fitted inside the paper, a self-definition, or a self-citation chain; the quantitative thresholds (e.g., 10^-4 contribution from 60k satellites, 20-30% increase from 5k bright reflectors) are direct outputs of applying these external tools to the input populations. The derivation chain is therefore self-contained against external benchmarks.
Axiom & Free-Parameter Ledger
free parameters (1)
- V_550km brightness threshold
axioms (1)
- domain assumption The Mie and Rayleigh scattering model adapted from moonlight sky-brightness calculations applies directly to sunlight reflected from satellites in the V band.
Reference graph
Works this paper leans on
-
[1]
Brightness Mitigation Best Practice for Satellite Operators
Appenzeller, I., Fricke, K., Fürtig, W., et al. 1998, The Messenger, 94, 1 Astropy Collaboration, Price-Whelan, A. M., Lim, P. L., et al. 2022, ApJ, 935, 167 Astropy Collaboration, Price-Whelan, A. M., Sip˝ocz, B. M., et al. 2018, AJ, 156, 123 Astropy Collaboration, Robitaille, T. P., Tollerud, E. J., et al. 2013, A&A, 558, A33 Bará, S. 2019, Photonic Let...
-
[2]
Walker, C., Di Pippo, S., Aubé, M., et al. 2020, Dark & Quiet Skies I (2020), Dark & Quiet Skies I (2020), Report of the conference held 5-9 October,
work page 2020
-
[3]
Walker, C., Hall, J., Allen, L., et al. 2020, SatCon1: Impact of Satellite Constel- lations on Optical Astronomy and Recommendations Towards Migigations Woods, T. N., Chamberlin, P. C., Harder, J. W., et al. 2009, Geophys. Res. Lett., 36, L01101 Article number, page 14 O. R. Hainaut: Large or bright satellite constellations Appendix A: Figure set a N E S ...
work page 2020
-
[4]
Article number, page 18 O. R. Hainaut: Large or bright satellite constellations Appendix B: Sky brightness unit conversion This appendix summarizes the brightness quantities, units, and conversions used in this paper. The conversions are presented as nomograms in Fig. B.1 and B.2. B.1. Radiometric and photometric brightnesses Brightness can be expressed a...
work page 1953
-
[5]
and integrate the 2008 Whole Heliosphere Interval (WHI) Solar Irradiance Reference Spectra15 (Woods et al
work page 2008
-
[6]
over a generic BesselVtransmis- sion curve. This givesF V,⊙ =164 W m −2 and therefore FV =164×10 −0.4(mV+26.75).(B.3) 15 https://lasp.colorado.edu/lisird/data/whi_ref_ spectra The perceptual photometric counterpart of irradiance is the illuminance, whose SI unit is the lux (lx), equivalent to lumen per square metre (lm m−2). For monochromatic light atλ=55...
work page 1991
discussion (0)
Sign in with ORCID, Apple, or X to comment. Anyone can read and Pith papers without signing in.