TraversalBench: Challenging Paths to Follow for Vision Language Models
Pith reviewed 2026-05-10 15:20 UTC · model grok-4.3
The pith
Vision-language models suffer sharp performance drops when visual paths cross themselves, with errors localizing at the first intersection.
A machine-rendered reading of the paper's core claim, the machinery that carries it, and where it could break.
Core claim
Self-intersections are the dominant source of difficulty for vision-language models on exact visual path traversal. A first-crossing analysis shows performance remains relatively stable immediately before the first self-intersection and then drops steeply when the model must resolve the correct continuation, while nearby confounding lines produce weaker but compounding degradation. An auxiliary benchmark further shows consistent left-to-right layout preferences that do not account for the primary effects of path structure.
What carries the argument
The first-crossing analysis applied to controlled polylines that vary self-intersection count while balancing tortuosity, vertex count, and nearby distractors.
Load-bearing premise
The benchmark's construction successfully balances structural factors and removes rendering or marker artifacts, so observed error patterns can be attributed to path complexity rather than dataset biases.
What would settle it
If error rates remain flat across paths that differ only in self-intersection count, or if the steep drop fails to appear specifically after the first crossing in matched image sets.
Figures






read the original abstract
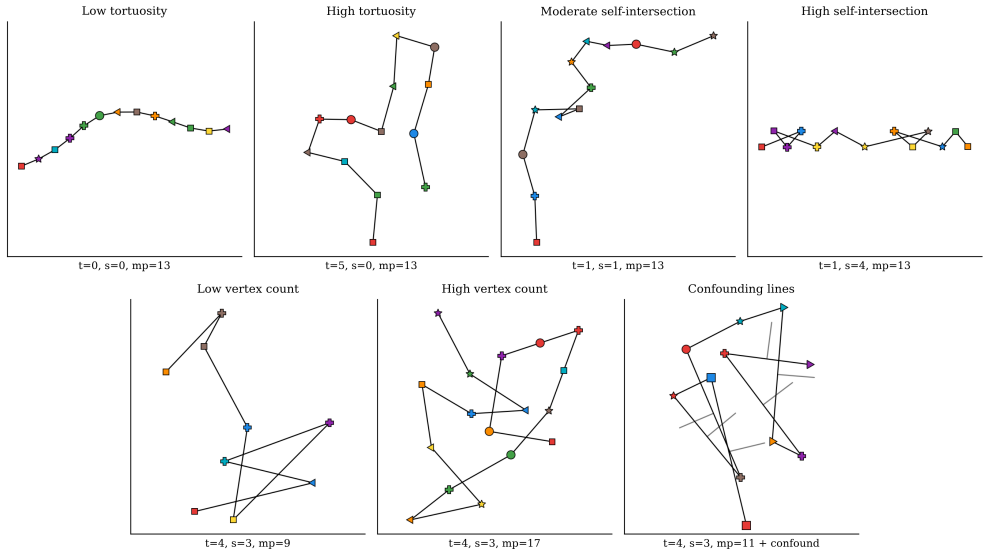
Vision-language models (VLMs) perform strongly on many multimodal benchmarks. However, the ability to follow complex visual paths -- a task that human observers typically find straightforward -- remains under-tested. We introduce TraversalBench, a controlled benchmark for exact visual path traversal. Each instance contains a single continuous polyline, a unique start marker, and markers placed at path vertices; the task is to recover the exact ordered sequence encountered when traversing the path from start to finish. The benchmark explicitly balances key path-structural factors including self-intersection count, tortuosity, vertex count, and nearby confounding lines, while minimizing reliance on OCR, world knowledge, and open-ended planning. We find that self-intersections are the dominant source of difficulty. A first-crossing analysis shows that errors are sharply localized: performance is relatively stable immediately before the first crossing, then drops steeply when the model must resolve the correct continuation. By contrast, nearby confounding lines produce a weaker persistent degradation that compounds with repeated exposure. These analyses make TraversalBench a useful diagnostic for identifying whether models suffer from human-like failures or other breakdowns in sustained visual processing. An auxiliary reading-order benchmark further reveals a consistent preference for layouts compatible with left-to-right serialization, while not explaining away the main effects of path complexity. Together, these results position TraversalBench as a controlled diagnostic of path-faithful visual reasoning and as a useful testbed for studying multimodal spatial reasoning under ambiguity, clutter, and distractor structure. More broadly, we position TraversalBench as a contribution to the still-limited area of sustained visual grounding benchmarks for VLMs.
Editorial analysis
A structured set of objections, weighed in public.
Referee Report
Summary. The paper introduces TraversalBench, a controlled benchmark consisting of single continuous polylines with a unique start marker and vertex markers, where VLMs must recover the exact ordered sequence of vertices traversed from start to finish. Key empirical claims are that self-intersections are the dominant source of difficulty for current VLMs, supported by a first-crossing analysis showing stable performance immediately before the first crossing followed by a steep drop; nearby confounding lines produce weaker, compounding degradation; and an auxiliary reading-order benchmark reveals consistent left-to-right layout preferences that do not explain away the path-complexity effects. The work positions the benchmark as a diagnostic for path-faithful visual reasoning and sustained multimodal spatial processing under ambiguity and clutter.
Significance. If the central empirical findings hold after addressing potential confounds, TraversalBench would provide a useful, controlled diagnostic tool for probing breakdowns in sustained visual grounding and spatial reasoning in VLMs, distinguishing structural path difficulties from other processing failures. It contributes to the still-limited set of benchmarks focused on exact path traversal and multimodal spatial reasoning, offering a testbed that minimizes reliance on OCR, world knowledge, and open-ended planning while balancing structural factors.
major comments (3)
- [first-crossing analysis / results on error localization] The first-crossing analysis (described in the abstract and presumably §4 or the results section) attributes the steep performance drop to the need to resolve the correct continuation at self-intersections. However, this risks confounding with absolute sequence position or cumulative visual load, since first crossings may systematically occur after more vertices or in regions of higher sustained processing demand. A control that matches path length, vertex count, or cumulative tortuosity before and after the crossing point is needed to isolate the structural effect of self-intersection from progressive degradation.
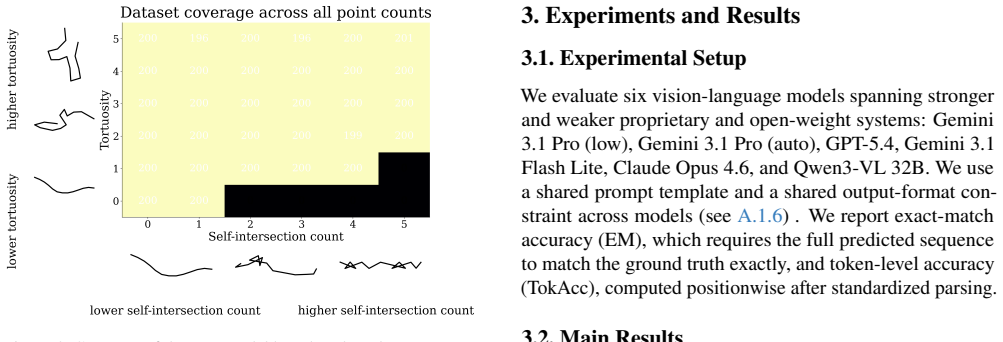
- [benchmark construction / dataset description] The claim that the benchmark 'explicitly balances key path-structural factors including self-intersection count, tortuosity, vertex count, and nearby confounding lines' (abstract) is central to attributing performance drops to path complexity rather than artifacts. The manuscript should include quantitative verification—such as summary statistics, histograms, or a table showing distributions and balance across these factors—to confirm successful minimization of confounds from rendering, marker placement, or implicit cues.
- [experimental setup / results] The abstract and empirical claims lack specifics on dataset size (number of instances and paths), exact model versions and prompting details, statistical tests for the reported performance drops, and error-bar reporting. These omissions make it difficult to assess the reliability and generalizability of the finding that self-intersections dominate difficulty.
minor comments (2)
- [figures] Figure captions and axis labels in the first-crossing and confounding-line plots should explicitly state the number of samples per condition and whether error bars represent standard error or deviation.
- [auxiliary benchmark] The auxiliary reading-order benchmark is mentioned but its exact task formulation, dataset overlap with the main benchmark, and quantitative results could be clarified to better show it does not explain away the main effects.
Simulated Author's Rebuttal
We thank the referee for the constructive and detailed feedback on TraversalBench. We have addressed each major comment point by point below. Revisions to the manuscript have been made to incorporate additional controls, quantitative verifications, and experimental details, which we believe strengthen the clarity and reliability of our claims.
read point-by-point responses
-
Referee: The first-crossing analysis (described in the abstract and presumably §4 or the results section) attributes the steep performance drop to the need to resolve the correct continuation at self-intersections. However, this risks confounding with absolute sequence position or cumulative visual load, since first crossings may systematically occur after more vertices or in regions of higher sustained processing demand. A control that matches path length, vertex count, or cumulative tortuosity before and after the crossing point is needed to isolate the structural effect of self-intersection from progressive degradation.
Authors: We appreciate the referee's identification of this potential confound. In the revised manuscript, we have added a matched-position control analysis. We stratified paths by the vertex index of the first crossing (e.g., crossings at positions 5–7, 10–12, and 15–17) and compared the performance delta at those exact positions against non-intersecting paths of matched length and tortuosity up to that point. The localized drop at crossings persists under these controls, while non-crossing paths show only gradual degradation. Updated figures and a new paragraph in §4.2 document this analysis, confirming the structural effect of self-intersections. revision: yes
-
Referee: The claim that the benchmark 'explicitly balances key path-structural factors including self-intersection count, tortuosity, vertex count, and nearby confounding lines' (abstract) is central to attributing performance drops to path complexity rather than artifacts. The manuscript should include quantitative verification—such as summary statistics, histograms, or a table showing distributions and balance across these factors—to confirm successful minimization of confounds from rendering, marker placement, or implicit cues.
Authors: We agree that explicit quantitative verification is necessary. The revised manuscript includes a new subsection (3.2) and Appendix B with summary statistics (means, standard deviations, and ranges), histograms for each factor, and a correlation matrix. Self-intersection counts range 0–4 with balanced sampling; tortuosity (integrated curvature) and vertex counts are uniformly distributed; nearby lines are controlled to 0–3 per segment. No significant inter-factor correlations (all |r| < 0.15) are observed, supporting that performance differences arise from the intended structural variations rather than generation artifacts. revision: yes
-
Referee: The abstract and empirical claims lack specifics on dataset size (number of instances and paths), exact model versions and prompting details, statistical tests for the reported performance drops, and error-bar reporting. These omissions make it difficult to assess the reliability and generalizability of the finding that self-intersections dominate difficulty.
Authors: We thank the referee for noting these omissions. The revised manuscript now reports: 1,200 total instances derived from 300 base paths; evaluated models with exact versions (GPT-4o-2024-08-06, Claude-3.5-Sonnet-20240620, LLaVA-1.6-34B); the full prompting template for ordered vertex prediction; standard-error bars on all bar and line plots; and paired t-tests (with p-values) confirming significant drops at first crossings (p < 0.01) versus weaker effects from confounding lines. These details appear in §4.1 and the figure captions. revision: yes
Circularity Check
No circularity: empirical benchmark with direct observations
full rationale
The paper constructs TraversalBench as a controlled dataset and performs empirical evaluation of VLMs on path traversal tasks. No mathematical derivations, parameter fitting, or predictions from first principles are present. The first-crossing analysis is a direct partitioning of observed errors by sequence position relative to intersections, not a fitted model or self-referential claim. Self-citations, if any, are not load-bearing for the central empirical findings. The work is self-contained against external benchmarks and does not reduce any result to its own inputs by construction.
Axiom & Free-Parameter Ledger
invented entities (1)
-
TraversalBench
no independent evidence
Forward citations
Cited by 1 Pith paper
-
VLMs Trace Without Tracking: Diagnosing Failures in Visual Path Following
VLMs frequently switch away from a target visual path to nearby similar distractors in controlled tracing tasks, with standard scaling, reasoning, and instruction interventions providing only partial mitigation.
Reference graph
Works this paper leans on
-
[1]
Tallyqa: Answering complex counting questions
Manoj Acharya, Kushal Kafle, and Christopher Kanan. Tallyqa: Answering complex counting questions. In Proceedings of the AAAI Conference on Artificial Intel- ligence, pages 8076–8084, 2019. 2, 14
work page 2019
-
[2]
Feenstra, Conner Arnold, Jan DeWitt, Natalie C
Christian Michael Arnold, Andrew Alini, Jonathan Wang, Pieter M. Feenstra, Conner Arnold, Jan DeWitt, Natalie C. Ritsema, Jung Hyun Yae, Boris Katz, Andrei Barbu, and Brian Cheung. Mapqa: A map-question- answering benchmark for visual language model rea- soning. InICLR 2026 Workshop on Multimodal Intelli- gence, 2026. OpenReview. 14
work page 2026
-
[3]
Visual graph ques- tion answering with asp and llms for language parsing
Jakob Johannes Bauer, Thomas Eiter, Nelson Higuera Ruiz, and Johannes Oetsch. Visual graph ques- tion answering with asp and llms for language parsing. arXiv preprint arXiv:2502.09211, 2025. 1, 2, 14, 15
-
[4]
Vlms have tunnel vision: Evaluating nonlocal visual reasoning in leading vlms,
Shmuel Berman and Jia Deng. Vlms have tunnel vision: Evaluating nonlocal visual reasoning in leading vlms,
-
[5]
Unveiling visual perception in language models: An attention head analysis approach
Jing Bi, Junjia Guo, Yunlong Tang, Lianggong Bruce Wen, Zhang Liu, Bingjie Wang, and Chenliang Xu. Unveiling visual perception in language models: An attention head analysis approach. InProceedings of the IEEE/CVF Conference on Computer Vision and Pattern Recognition (CVPR), pages 4135–4144, 2025. 8
work page 2025
-
[6]
Brian P. Bledsoe and Chester C. Watson. Logistic analysis of channel pattern thresholds: Meandering, braiding, and incising.Geomorphology, 38(3–4):281– 300, 2001. 3
work page 2001
-
[7]
Declan Campbell, Sunayana Rane, Tyler Giallanza, Nicol`o De Sabbata, Kia Ghods, Amogh Joshi, Alexan- der Ku, Steven M. Frankland, Thomas L. Griffiths, Jonathan D. Cohen, and Taylor W. Webb. Under- standing the limits of vision language models through the lens of the binding problem.arXiv preprint arXiv:2411.00238, 2024. 1
-
[8]
Liang Chen, Haozhe Zhao, Tianyu Liu, Shuai Bai, Jun- yang Lin, Chang Zhou, and Baobao Chang. An image is worth 1/2 tokens after layer 2: Plug-and-play infer- ence acceleration for large vision-language models. In Proceedings of the European Conference on Computer Vision (ECCV), 2024. 8
work page 2024
-
[9]
Knot so simple: A mini- malistic environment for spatial reasoning, 2026
Zizhao Chen and Yoav Artzi. Knot so simple: A mini- malistic environment for spatial reasoning, 2026. 15
work page 2026
-
[10]
Dawson, Tamara Munzner, and Joanna Mc- Grenere
Jessica Q. Dawson, Tamara Munzner, and Joanna Mc- Grenere. A search-set model of path tracing in graphs. Information Visualization, 14(4):308–338, 2015. 16
work page 2015
-
[11]
Sicheng Feng, Song Wang, Shuyi Ouyang, Lingdong Kong, Zikai Song, Jianke Zhu, Huan Wang, and Xin- chao Wang. Can mllms guide me home? a bench- mark study on fine-grained visual reasoning from tran- sit maps.arXiv preprint arXiv:2505.18675, 2025. 1, 2, 14
-
[12]
Paul Gavrikov, Jovita Lukasik, Steffen Jung, Robert Geirhos, Bianca Lamm, Muhammad Jehanzeb Mirza, Margret Keuper, and Janis Keuper. Are vision language models texture or shape biased and can we steer them? arXiv preprint arXiv:2403.09193, 2024. 1
-
[13]
Rinus Houtkamp, Henk Spekreijse, and Pieter R. Roelf- sema. A gradual spread of attention during mental curve tracing.Perception & Psychophysics, 65(7): 1136–1144, 2003. 16
work page 2003
-
[14]
Exploring the rela- tive importance of crossing number and crossing angle
Weidong Huang and Maolin Huang. Exploring the rela- tive importance of crossing number and crossing angle. InProceedings of the 3rd International Symposium on Visual Information Communication, pages 10:1–10:8. ACM, 2010. 4, 5, 16
work page 2010
-
[15]
Pierre Jolicoeur, Shimon Ullman, and Marilynn Mackay. Curve tracing: A possible basic operation in the perception of spatial relations.Memory & Cog- nition, 14(2):129–140, 1986. 16
work page 1986
-
[16]
Pierre Jolicoeur, Shimon Ullman, and Marilynn Mackay. Visual curve tracing properties.Journal of Experimental Psychology: Human Perception and Per- formance, 17(4):997–1022, 1991. 16
work page 1991
- [17]
-
[18]
Probing represen- tations of numbers in vision and language models
Ivana Kajic and Aida Nematzadeh. Probing represen- tations of numbers in vision and language models. In SVRHM 2022 Workshop @ NeurIPS, 2022. OpenRe- view. 1
work page 2022
-
[19]
See what you are told: Visual atten- tion sink in large multimodal models
Seil Kang, Jinyeong Kim, Junhyeok Kim, and Seong Jae Hwang. See what you are told: Visual atten- tion sink in large multimodal models. InThe Thirteenth International Conference on Learning Representations (ICLR), 2025. 8
work page 2025
-
[20]
Luna B. Leopold and M. Gordon Wolman. River chan- nel patterns: Braided, meandering, and straight.U.S. Geological Survey Professional Paper, 282-B:39–85,
-
[21]
Roni Paiss, Ariel Ephrat, Omer Tov, Shiran Zada, In- bar Mosseri, Michal Irani, and Tali Dekel. Teaching CLIP to count to ten. InProceedings of the IEEE/CVF International Conference on Computer Vision (ICCV), pages 3157–3167, 2023. 2, 14
work page 2023
- [22]
-
[23]
Vision lan- 9 guage models are blind: Failing to translate detailed visual features into words
Pooyan Rahmanzadehgervi, Logan Bolton, Moham- mad Reza Taesiri, and Anh Totti Nguyen. Vision lan- 9 guage models are blind: Failing to translate detailed visual features into words. 2025. 1
work page 2025
-
[24]
Yueqi Song, Tianyue Ou, Yibo Kong, Zecheng Li, Gra- ham Neubig, and Xiang Yue. Visualpuzzles: Decou- pling multimodal reasoning evaluation from domain knowledge.arXiv preprint arXiv:2504.10342, 2025. 2, 14, 15
-
[25]
Visual routines.Cognition, 18(1–3): 97–159, 1984
Shimon Ullman. Visual routines.Cognition, 18(1–3): 97–159, 1984. 16
work page 1984
-
[26]
Purchase, Linda Colpoys, and Matthew McGill
Colin Ware, Helen C. Purchase, Linda Colpoys, and Matthew McGill. Cognitive measurements of graph aesthetics.Information Visualization, 1(2):103–110,
-
[27]
Hsiang-Yun Wu, Benjamin Niedermann, Shigeo Taka- hashi, and Martin N ¨ollenburg. A survey on transit map layout — from design, machine, and human per- spectives.Computer Graphics Forum, 39(3):619–646,
-
[28]
Shengguang Wu, Fan-Yun Sun, Kaiyue Wen, and Nick Haber. Symmetrical visual contrastive optimization: Aligning vision-language models with minimal con- trastive images, 2025. 1
work page 2025
-
[29]
Can large vision language models read maps like a human?arXiv preprint arXiv:2503.14607, 2025
Shuo Xing, Zezhou Sun, Shuangyu Xie, Kaiyuan Chen, Yanjia Huang, Yuping Wang, Jiachen Li, Dezhen Song, and Zhengzhong Tu. Can large vision language models read maps like a human?arXiv preprint arXiv:2503.14607, 2025. 1, 2, 14 10 Figure 10. Representative benchmark instances illustrating the main controlled axes of path complexity. The panels show variatio...
discussion (0)
Sign in with ORCID, Apple, or X to comment. Anyone can read and Pith papers without signing in.