JOYS: Launching and destruction of dust in protostellar jets. The case of BHR71-IRS1 with JWST/MIRI
Pith reviewed 2026-05-10 15:09 UTC · model grok-4.3
The pith
JWST observations show dust grains are launched in a Class 0 jet and partly survive shock processing.
A machine-rendered reading of the paper's core claim, the machinery that carries it, and where it could break.
Core claim
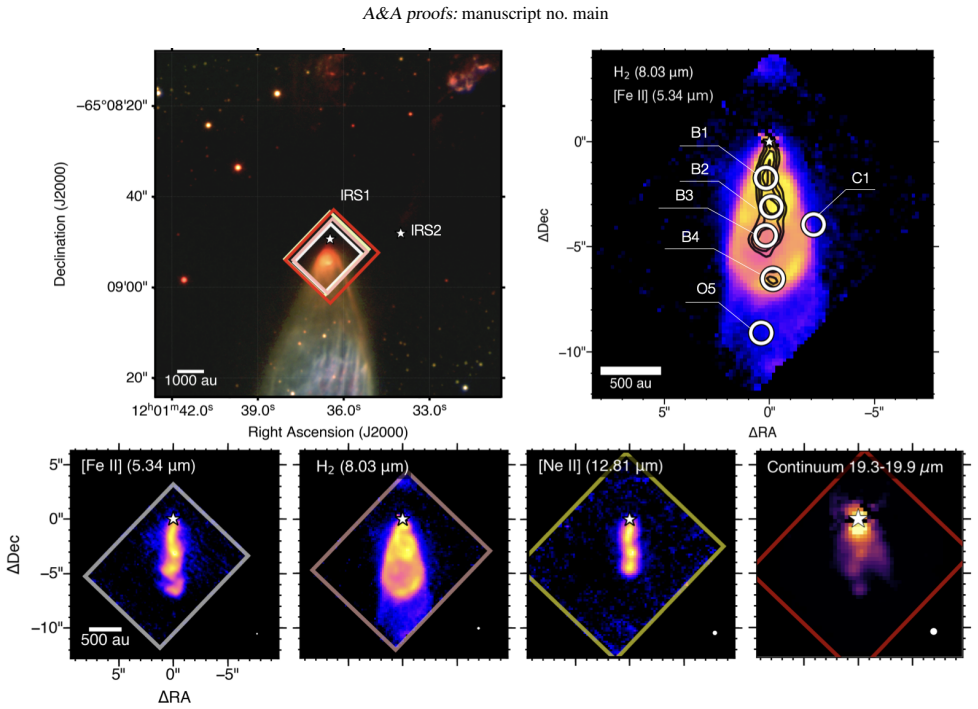
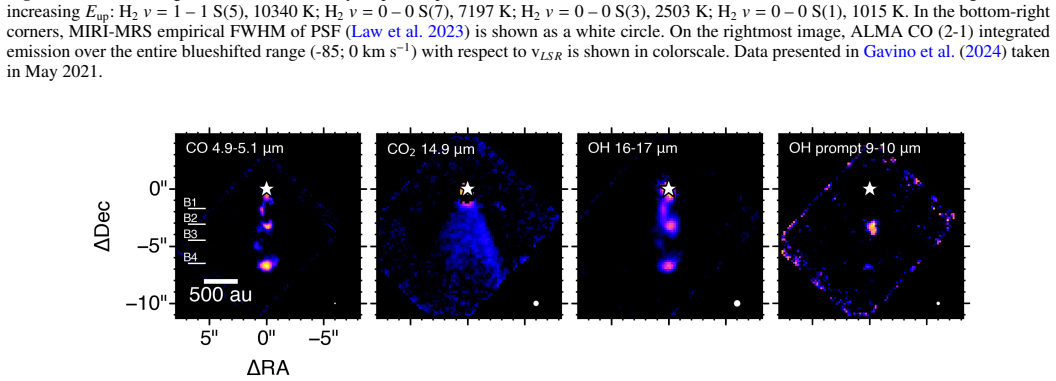
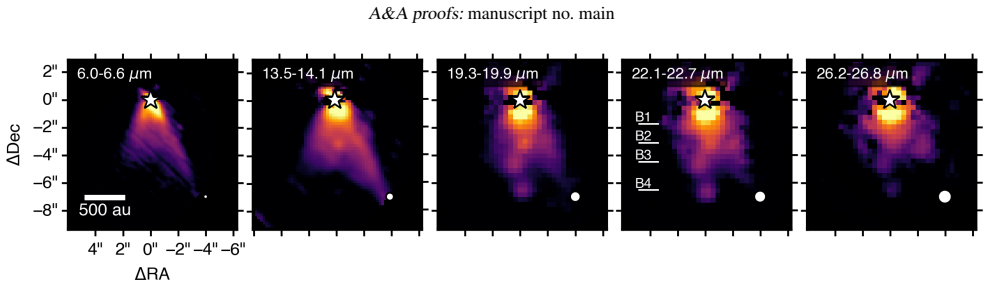
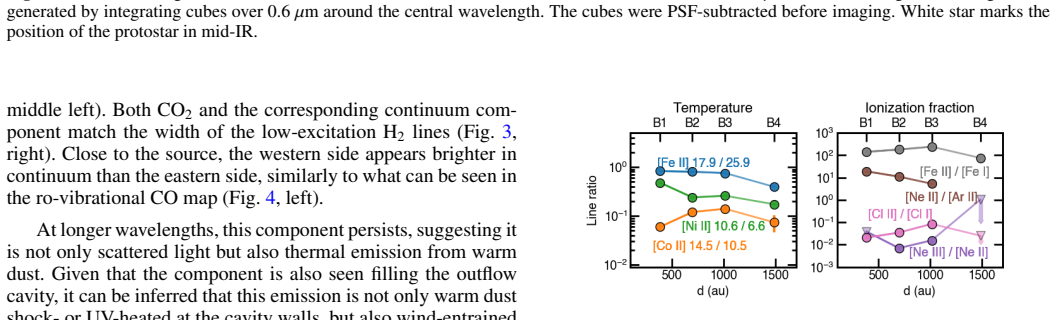
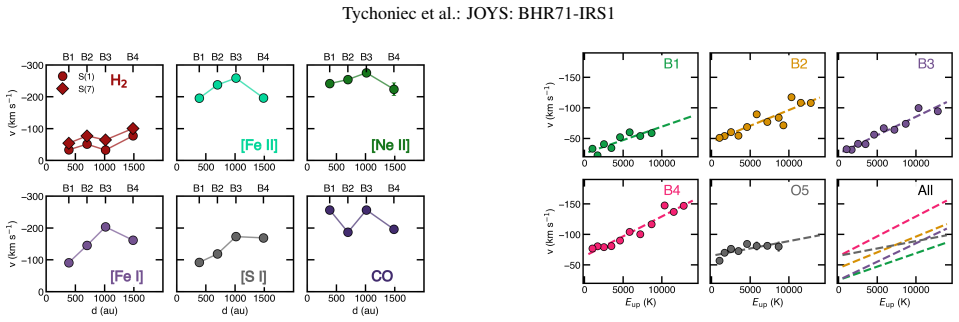
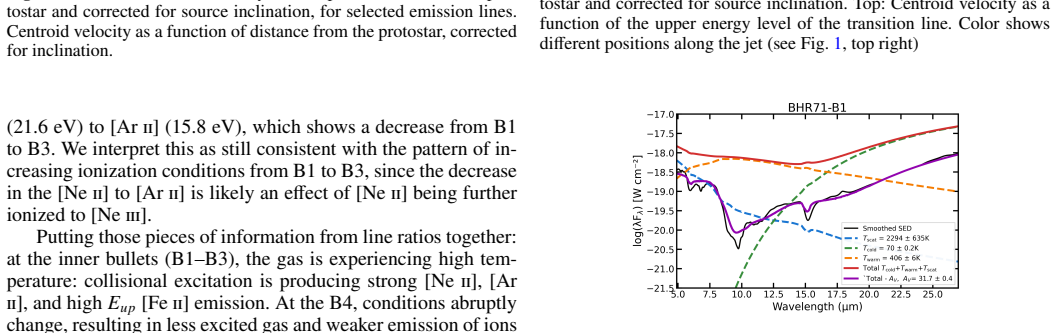
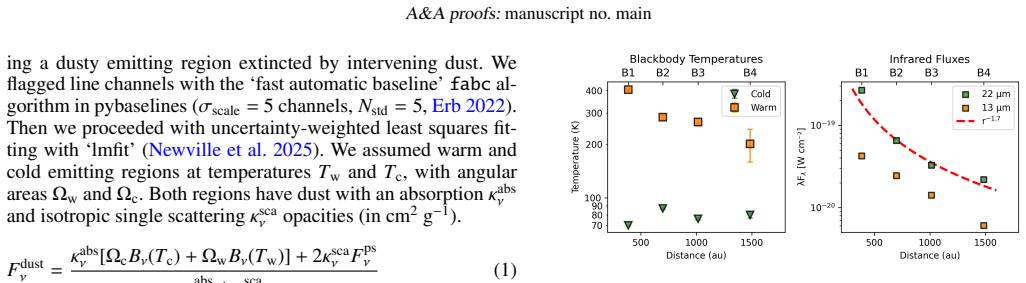
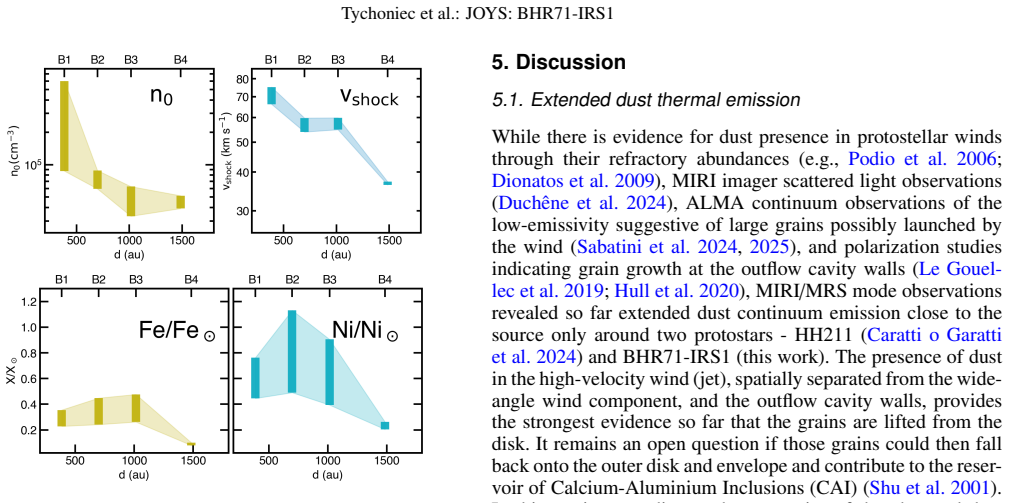
The ionized jet is spatially resolved with a unique set of refractory, volatile, and noble-gas lines concentrated in four bright knots that wiggle along the axis. PSF-subtracted continuum maps show extended mid-IR emission co-spatial with the jet bullets, with SED fits indicating a 200-400 K warm dust component and a 70-90 K cold component. Shock modeling of the mid-IR lines constrains a drop in velocity from 70 to 35 km/s and pre-shock density from above 10^5 to 4x10^4 cm^-3 with distance, while measurable depletions of Fe and Ni indicate that a substantial fraction of refractories remains locked in grains despite the shocks.
What carries the argument
PSF-subtracted mid-IR continuum maps from the MIRI-MRS cubes combined with shock models applied to the intensities of fine-structure atomic lines to quantify both physical conditions and elemental depletions.
If this is right
- Dust can be launched from the disk into the jet already during the Class 0 phase.
- A measurable fraction of refractory elements stays locked in grains after passing through the shocks.
- Shock velocity and density decrease systematically with distance from the protostar.
- Mid-IR fine-structure lines provide a direct probe of both gas-phase depletions and dust presence in outflows.
Where Pith is reading between the lines
- The survival of grains implies that some solids can be transported outward and potentially re-accreted or incorporated into later planet-forming material.
- Similar mid-IR continuum signatures could be searched for in other Class 0 sources to test whether dust launching is common.
- The observed wiggling knots and declining shock conditions offer a template for modeling how jets evolve and process material over hundreds of au.
Load-bearing premise
The extended mid-IR continuum after point-spread-function subtraction represents thermal emission from dust grains launched in the jet rather than scattered light or other non-thermal contributions.
What would settle it
Higher-resolution or polarimetric imaging that attributes the continuum to scattered light instead of thermal dust, or shock models that reproduce the observed line depletions with no surviving grains at all.
Figures


read the original abstract
Protostellar winds can theoretically lift solids from the planet-forming disks, but direct evidence for launched dust has been scarce so far. Numerous atomic lines that are unique to mid-infrared (IR) wavelengths reveal refractories eroded from dust grains and provide information on wind properties in the earliest stages of the star formation process. We present JWST/MIRI-MRS spectral imaging of the inner 2000 au of the BHR71-IRS1 blueshifted side of the outflow. Atomic line intensities are compared to shock models to constrain the physical conditions and elemental abundances of the outflowing gas. Dust continuum maps are constructed from PSF-subtracted cubes, and the dust spectral energy distribution is analyzed. The ionized central jet of BHR71-IRS1 is spatially resolved and imaged for the first time, revealing a unique inventory of refractory, volatile, and noble-gas fine-structure lines (Fe, Ni, Co, Cl, S, Ne, Ar). The emission is concentrated along four bright knots that wiggle along the jet axis. PSF-subtracted continuum maps reveal extended mid-IR continuum emission co-spatial with the jet bullets and within the H$_2$-traced outflow cone. Spectral energy distributions along the jet are fit together with the extinction, revealing a warm (200-400 K) and a cold (70-90 K) dust component. Shock modeling constrained by the mid-IR lines indicates a decline in shock velocity from 70 to 35 km s$^{-1}$ and pre-shock density from $>$10$^5$ to $ 4\times 10^4$ cm$^{-3}$ with distance from the protostar. Gas-phase Fe and Ni are measurably depleted relative to Solar abundances, consistent with a substantial fraction of refractories remaining locked in grains in spite of the shocks. These JWST observations provide direct evidence that dust is launched in a Class 0 jet and at least partly survives shock processing.
Editorial analysis
A structured set of objections, weighed in public.
Referee Report
Summary. The paper presents JWST/MIRI-MRS spectral imaging of the inner ~2000 au of the BHR71-IRS1 blueshifted outflow, identifying a rich set of atomic fine-structure lines (Fe, Ni, Co, Cl, S, Ne, Ar) concentrated in four wiggling knots. Line intensities are compared to shock models to derive declining shock velocities (70 to 35 km s^{-1}) and pre-shock densities (>10^5 to 4x10^4 cm^{-3}), along with measurable depletions of gas-phase Fe and Ni. PSF-subtracted continuum maps reveal extended mid-IR emission co-spatial with the jet bullets, whose SEDs are fit after extinction correction to yield warm (200-400 K) and cold (70-90 K) dust components. The authors conclude that these data furnish direct evidence that dust is launched in a Class 0 jet and at least partly survives shock processing.
Significance. If the continuum interpretation holds, the work supplies one of the first spatially resolved mid-IR constraints on dust entrainment and refractory survival in an embedded Class 0 jet, with direct relevance to the delivery of solids to planet-forming disks. The combination of multi-species line diagnostics with continuum mapping is a methodological strength and provides falsifiable predictions for depletion patterns that can be tested with future observations.
major comments (1)
- [Abstract and continuum-mapping section] Abstract and continuum-mapping section: The central claim of 'direct evidence' for dust launched in the jet rests on the extended mid-IR continuum being thermal emission from grains co-spatial with the jet bullets. The PSF subtraction of the bright central source can leave residuals or permit scattered-light contributions along the outflow cone; the manuscript must supply a quantitative description of the subtraction algorithm, residual maps, uncertainty propagation, and any tests (e.g., spatial correlation with H2 or multi-epoch checks) that exclude non-thermal origins. Without this, the 'launched dust' component of the conclusion lacks a secure observational basis even if the line-based depletion arguments remain intact.
minor comments (2)
- [Abstract] Abstract: the statement that 'Gas-phase Fe and Ni are measurably depleted' should be accompanied by the actual depletion factors and their uncertainties so readers can judge consistency with the shock-model grid.
- [Shock-modeling paragraph] Shock-modeling paragraph: the two free parameters (shock velocity and pre-shock density) are stated to decline with distance; the text should explicitly show how the full set of observed lines (including noble-gas species) jointly constrains these parameters and whether geometry or atomic-data uncertainties affect the derived depletions.
Simulated Author's Rebuttal
We thank the referee for the detailed and constructive report. The single major comment concerns the robustness of the continuum interpretation and the need for more quantitative documentation of the PSF subtraction. We address this point directly below and will revise the manuscript to incorporate additional details and tests as outlined.
read point-by-point responses
-
Referee: [Abstract and continuum-mapping section] Abstract and continuum-mapping section: The central claim of 'direct evidence' for dust launched in the jet rests on the extended mid-IR continuum being thermal emission from grains co-spatial with the jet bullets. The PSF subtraction of the bright central source can leave residuals or permit scattered-light contributions along the outflow cone; the manuscript must supply a quantitative description of the subtraction algorithm, residual maps, uncertainty propagation, and any tests (e.g., spatial correlation with H2 or multi-epoch checks) that exclude non-thermal origins. Without this, the 'launched dust' component of the conclusion lacks a secure observational basis even if the line-based depletion arguments remain intact.
Authors: We agree that a more quantitative presentation of the continuum extraction is required to support the claim of launched dust. The current manuscript (Section 3.2) describes the use of the JWST pipeline with a custom PSF subtraction scaled to the central source flux, and notes the resulting extended emission is co-spatial with the H2-traced outflow and atomic-line knots. However, we will expand this section (and add an appendix) to include: (i) the precise subtraction algorithm, including the reference PSF selection, scaling factor determination, and any iterative masking; (ii) residual maps after subtraction, with quantitative metrics on residual levels relative to the extended emission; (iii) explicit propagation of subtraction uncertainties into the extracted SED fluxes and derived dust temperatures; and (iv) additional tests of thermal origin, such as the tight spatial correlation with both H2 and refractory lines (already shown in Figures 3 and 5) and the SED shape being inconsistent with scattered light or non-thermal processes. Multi-epoch checks are not possible with the existing single-epoch JWST data, but the combination of temperature fits (200-400 K warm component) and co-spatiality with shock tracers provides strong support for thermal dust emission. These revisions will be made in the next version, thereby securing the observational basis for the dust-launching conclusion while leaving the line-based depletion results unchanged. revision: yes
Circularity Check
No circularity: claims rest on new JWST data vs external shock models
full rationale
The paper's core claims derive from direct observational products (PSF-subtracted MIRI-MRS cubes, line intensities, and SED fits) compared against standard external shock models. No equations or steps reduce a 'prediction' or 'first-principles result' to the paper's own fitted inputs by construction. No self-citation chains, uniqueness theorems, or ansatzes are invoked to justify load-bearing choices. The derivation is self-contained against external benchmarks.
Axiom & Free-Parameter Ledger
free parameters (2)
- shock velocity =
70 to 35 km/s
- pre-shock density =
>10^5 to 4e4 cm^-3
axioms (2)
- domain assumption Mid-IR fine-structure lines reliably trace gas-phase abundances released by dust erosion in shocks
- domain assumption Standard shock models apply without major modifications to this protostellar jet environment
Forward citations
Cited by 1 Pith paper
-
JOYS$+$: A JWST/MIRI survey of the evolution of H$_2$ winds and jets from low-mass protostars
JWST observations of 33 protostars show H2 winds broadening from ~20° to ~90° and warm mass-loss rates declining by 100x from Class 0 to Class I, matching MHD disk wind model predictions.
Reference graph
Works this paper leans on
-
[1]
JOYS$+$: A JWST/MIRI survey of the evolution of H$_2$ winds and jets from low-mass protostars
Agra-Amboage, V ., Dougados, C., Cabrit, S., & Reunanen, J. 2011, A&A, 532, A59 Allen, C. W. 1973, Astrophysical quantities Anglada, G., López, R., Estalella, R., et al. 2007, AJ, 133, 2799 Argyriou, I., Glasse, A., Law, D. R., et al. 2023, A&A, 675, A111 Assani, K. D., Harsono, D., Ramsey, J. P., et al. 2024, A&A, 688, A26 Astropy Collaboration, Price-Wh...
work page internal anchor Pith review Pith/arXiv arXiv 2011
-
[2]
and would cause noticeable precession of the disk (Vioque et al. 2026). If instead the wiggle were due to orbital motion of the jet source itself, the observed single-jet geometry implies the launching star would be more massive than any companion. Ap- plying Eq. 7 of Lee et al. (2010) to the observed properties yields no physically plausible solution for...
work page 2026
-
[3]
offer a powerful probe of inner disk structure and dynamical state. Disentangling precession, orbital Table C.1.Results of the H 2 line intensity analysis Reg, log(N warm) log(N hot) Nhot Nwarm Twarm Thot OPR cm−2 cm−2 % K K B1 21.2±0.2 19.2±0.3 0.9 674±75 2350±390 1.9±0.5 B2 20.2±0.1 19.0±0.2 6.0 881±80 2270±220 2.6±0.3 B3 19.8±0.1 18.4±0.1 3.8 813±52 22...
work page 2080
-
[4]
with opacity magnitude as a free pa- rameter (τS(3)). We choose this extinction curve as it is based on mid-IR measurements fromSpitzerspanning a range of extinc- tions more relevant for the most embedded sources (Chapman et al. 2008). H2-based extinctions are reported in Table E.2. We denote this asτ S(3) rather thanτ 9.7 to avoid confusion with directly...
work page 2008
-
[5]
for undepleted species, xS =10 −5. Results are reported in Fig. D.2. The abundances found for the BHR71-71 shocks are predominantly lower than the solar values. For iron, the range is 0.1-0.4 of solar abundance; for nickel, 0.02-0.41; and for chlorine, 0.3-1.7. These results indi- cate a clear depletion of refractory species in the jet’s gas phase, sugges...
work page 2013
-
[6]
E.1, dust properties as measured in 4.1
In Tab. E.1, dust properties as measured in 4.1. The range of values is provided since different values are obtained based on density estimates from S and Cl. Tab. E.2 provides a summary of the properties of regions used for spectral analysis. Article number, page 18 of 21 Tychoniec et al.: JOYS: BHR71-IRS1 Fig. D.1.Extinction-corrected intensities of [Ne...
work page 2080
discussion (0)
Sign in with ORCID, Apple, or X to comment. Anyone can read and Pith papers without signing in.