JWST observations of photodissociation regions. IV. Carbonaceous emission band sub-components in NGC 7023 have distinct spatial distributions
Pith reviewed 2026-05-10 15:04 UTC · model grok-4.3
The pith
JWST maps show at least two separate carrier populations produce the 16-18 micron bands in NGC 7023.
A machine-rendered reading of the paper's core claim, the machinery that carries it, and where it could break.
Core claim
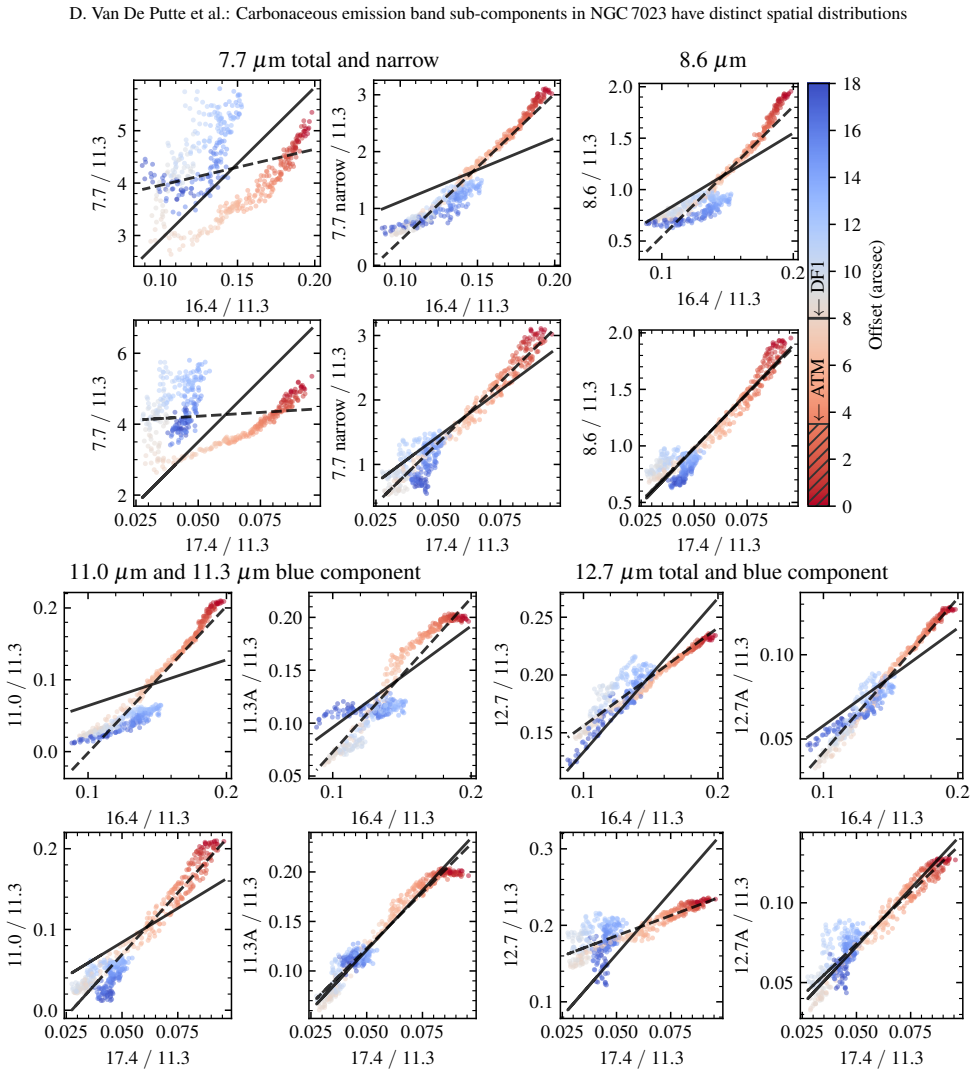
Nearly all emission maps peak at the dissociation front DF1, while relative intensity in the atomic hydrogen region varies strongly by feature. Classification into spatial types shows most bands as type I or II, but blue sub-components of the 5.7, 7.7, 11.3 and 12.7 micron bands are type III while red sub-components are type I or II. These differing distributions demonstrate that at least two distinct populations contribute to the 16-18 micron range and link to the shapes of the main bands, with continued profile evolution toward the central cavity preceding fullerene formation.
What carries the argument
PAHFIT spectral decomposition that isolates the main bands and their blue/red sub-components, followed by mapping of their intensity ratios between the atomic hydrogen region (ATM) and dissociation front (DF1) to classify spatial distribution types.
If this is right
- The blue sides of the 5.7, 7.7, 11.3 and 12.7 micron bands arise from one population while the red sides arise from another.
- At least two populations contribute to the 16.4 and 17.4 micron features.
- The emission profiles continue to evolve inward from the dissociation front toward the central cavity.
- This evolution occurs in a stage that precedes the appearance of fullerene emission such as C60.
Where Pith is reading between the lines
- Photochemical processing models may need to track separate carrier groups moving through the same radiation field.
- Similar two-population behavior could appear in other photodissociation regions if mapped at comparable resolution.
- Excitation or temperature effects might still contribute to the observed profile shifts even if populations differ.
- Targeted observations of the central cavity could test whether the inferred populations directly convert into fullerenes.
Load-bearing premise
That the PAHFIT decomposition cleanly isolates physically distinct sub-components rather than artifacts of blending, temperature variations, or template choices, and that intensity ratios directly trace carrier populations instead of excitation or optical depth effects.
What would settle it
If re-decomposition with different templates or higher-resolution data shows the blue and red sub-components of the 5.7-12.7 micron bands having identical spatial maps, the claim of multiple distinct populations would fail.
Figures


read the original abstract
We analyze JWST spectroscopy of the northwest filament of NGC7023, where the relatively soft radiation field results in a photodissociation region with an extended atomic hydrogen region, and strongly pronounced variations of the carbonaceous emission band profiles. We focus on the 16.4 and 17.4 um bands and their relation to the main bands at 3.3, 3.4, 5.2, 5.7, 6.2, 7.7, 8.6, 11.3, and 12.7 um, and aim to identify which bands and sub-features originate from co-spatial emission carriers. We apply a PAHFIT spectral decomposition to measure the emission bands and their individual sub-components, and produce maps that spatially resolve the main dissociation front (DF1). Nearly all emission maps peak at DF1, while the relative intensity in the atomic hydrogen region (ATM) varies strongly. We classify the features into spatial distribution types based on the intensity ratio in ATM relative to DF1. Most bands are of type I (low ATM/DF1; 3.3, 3.4, 5.2, 5.7, 11.3 um) or II (medium ATM/DF1; 16.2, 7.7, 8.6, 12.7, 16.4 um), while only few are of type III (high ATM/DF1; 11.0, 17.4 um). A breakdown of the 5.7, 7.7, 11.3 and 12.7 um bands into blue and red sub-components reveals that contributions on the blue side are of type III, while those on the red side are of type I or II. These strongly differing spatial distributions reveal that at least two different populations contribute to the 16-18 um range, and that these populations are also connected to the profiles of the 5.7, 7.7, 11.3, and 12.7 um bands. The maps further indicate a continued evolution of these profiles toward the central cavity of NGC7023, where fullerene emission (C60) was previously detected. We speculate that the population of emission carriers could be in an intermediate photochemical evolution stage that precedes fullerene formation.
Editorial analysis
A structured set of objections, weighed in public.
Referee Report
Summary. The paper analyzes JWST spectroscopy of the northwest filament of NGC 7023, applying PAHFIT decomposition to map the spatial distributions of carbonaceous emission bands (3.3–17.4 μm) and their sub-components relative to the main dissociation front (DF1) and atomic hydrogen region (ATM). Bands and sub-components are classified into spatial types I–III based on ATM/DF1 intensity ratios, with the key finding that blue sub-components of the 5.7, 7.7, 11.3, 12.7, and 16–18 μm features show type-III behavior while red sub-components are type I/II; this is interpreted as evidence for at least two distinct carrier populations in the 16–18 μm range that are also linked to the profiles of other bands, possibly representing an intermediate stage in photochemical evolution toward fullerene formation.
Significance. If the sub-component separation holds, the work supplies valuable spatially resolved observational constraints on the diversity and evolution of PAH carriers in PDRs, extending the JWST PDR series with direct mapping of intensity ratios that can test models of carrier populations. The use of public JWST data and clear production of emission maps are strengths that make the results reproducible and falsifiable in principle.
major comments (2)
- Spectral decomposition and mapping section: the classification of blue versus red sub-components (and thus the claim of multiple carrier populations) depends on the fixed PAHFIT templates cleanly isolating independent features. No sensitivity tests to template parameter variations (positions, widths, or relative strengths) or alternative decompositions are described, leaving open whether the reported type-III behavior of blue wings arises from physically distinct populations or from template-driven splitting of continuously varying profiles (cf. reader's weakest assumption and skeptic note).
- Results on spatial distributions: the interpretation that ATM/DF1 intensity ratios directly trace separate carrier populations (rather than position-dependent excitation, ionization, or optical-depth gradients) is central but lacks quantitative checks, such as correlations with local radiation field or comparisons to excitation models, which are needed to rule out non-carrier explanations for the differing maps.
minor comments (2)
- Abstract and introduction: the description of the type I/II/III classification is clear, but adding a brief note on the exact number of sub-components fitted per band would help readers assess the decomposition scope immediately.
- Figure captions (maps): ensure all panels explicitly label the ATM and DF1 regions and include the intensity ratio scale used for classification to improve readability.
Simulated Author's Rebuttal
We thank the referee for their constructive and detailed report. We address each major comment below, outlining how we will strengthen the manuscript through additional analysis and discussion while preserving the core findings.
read point-by-point responses
-
Referee: Spectral decomposition and mapping section: the classification of blue versus red sub-components (and thus the claim of multiple carrier populations) depends on the fixed PAHFIT templates cleanly isolating independent features. No sensitivity tests to template parameter variations (positions, widths, or relative strengths) or alternative decompositions are described, leaving open whether the reported type-III behavior of blue wings arises from physically distinct populations or from template-driven splitting of continuously varying profiles (cf. reader's weakest assumption and skeptic note).
Authors: We acknowledge the importance of demonstrating robustness against template choices. The PAHFIT templates were selected for consistency with prior decompositions of NGC 7023 and other PDRs in the literature. To directly address this concern, we will add a new subsection performing sensitivity tests: we will vary the central positions and widths of the sub-components by ±5–10% (within observed profile uncertainties) and re-derive the ATM/DF1 ratios and spatial types. We will also test an alternative decomposition using unconstrained Gaussians for the 5.7, 7.7, 11.3, and 12.7 μm complexes. Results confirming that the type-III classification of blue sub-components persists will be presented, with any caveats noted. These additions will appear in the revised spectral decomposition section. revision: yes
-
Referee: Results on spatial distributions: the interpretation that ATM/DF1 intensity ratios directly trace separate carrier populations (rather than position-dependent excitation, ionization, or optical-depth gradients) is central but lacks quantitative checks, such as correlations with local radiation field or comparisons to excitation models, which are needed to rule out non-carrier explanations for the differing maps.
Authors: The opposing spatial behaviors of blue and red sub-components within the same band already argue against a simple excitation or ionization gradient explanation, since such effects would not produce wavelength-dependent reversals over such narrow ranges. Nevertheless, we agree that explicit checks are valuable. In the revision we will add: (1) maps and correlations of the ATM/DF1 ratios against local radiation field strength estimated from the 5–20 μm continuum; (2) a comparison of the observed sub-component ratios to predictions from existing PDR excitation models for NGC 7023 (e.g., those incorporating varying G0 and density). This discussion will be placed in the Results and Interpretation sections to clarify why multiple carrier populations remain the most parsimonious explanation. revision: yes
Circularity Check
No significant circularity; derivation is direct from JWST data maps
full rationale
The paper's central result follows from applying the standard PAHFIT decomposition to the observed JWST spectra, extracting intensities for main bands and their blue/red sub-components, constructing spatial maps across the PDR, and classifying features by the empirical ATM/DF1 intensity ratio. The conclusion that at least two populations contribute to the 16-18 um range (and link to other bands) is a direct reading of the differing ratio values for blue vs. red sub-components. No step reduces by construction to a fitted parameter, self-defined quantity, or self-citation chain; the classification and population inference are data-driven outputs with no load-bearing self-reference or ansatz smuggling. This is a standard observational analysis against external JWST measurements.
Axiom & Free-Parameter Ledger
free parameters (1)
- PAHFIT template parameters (positions, widths, relative strengths)
axioms (1)
- domain assumption Emission bands arise from distinct molecular or dust populations whose spatial distributions reflect photochemical evolution.
Reference graph
Works this paper leans on
-
[1]
Allamandola, L. J., Hudgins, D. M., & Sandford, S. A. 1999, ApJ, 511, L115
work page 1999
-
[2]
Allamandola, L. J., Tielens, A. G. G. M., & Barker, J. R. 1985, ApJ, 290, L25 3 http://www.astropy.org Article number, page 16 D. Van De Putte et al.: Carbonaceous emission band sub-components in NGC 7023 have distinct spatial distributions
work page 1985
-
[3]
Allamandola, L. J., Tielens, A. G. G. M., & Barker, J. R. 1989, ApJS, 71, 733
work page 1989
-
[4]
Andrews, H., Boersma, C., Werner, M. W., et al. 2015, ApJ, 807, 99 Astropy Collaboration, Price-Whelan, A. M., Lim, P. L., et al. 2022, ApJ, 935, 167 Astropy Collaboration, Price-Whelan, A. M., Sip˝ocz, B. M., et al. 2018, AJ, 156, 123 Astropy Collaboration, Robitaille, T. P., Tollerud, E. J., et al. 2013, A&A, 558, A33
work page 2015
-
[5]
W., Peeters, E., & Allamandola, L
Bauschlicher, Jr., C. W., Peeters, E., & Allamandola, L. J. 2008, ApJ, 678, 316
work page 2008
-
[6]
W., Ricca, A., Boersma, C., & Allamandola, L
Bauschlicher, Jr., C. W., Ricca, A., Boersma, C., & Allamandola, L. J. 2018, ApJS, 234, 32
work page 2018
-
[7]
2012, ApJ, 757, 41 Berné, O., Habart, É., Peeters, E., et al
Bernard-Salas, J., Cami, J., Peeters, E., et al. 2012, ApJ, 757, 41 Berné, O., Habart, É., Peeters, E., et al. 2022, PASP, 134, 054301 Berné, O., Joblin, C., Deville, Y ., et al. 2007, A&A, 469, 575 Berné, O., Montillaud, J., & Joblin, C. 2015, A&A, 577, A133 Berné, O. & Tielens, A. G. G. M. 2012, Proceedings of the National Academy of Science, 109, 401
work page 2012
-
[8]
Boersma, C., Allamandola, L. J., Esposito, V . J., et al. 2023, ApJ, 959, 74
work page 2023
-
[9]
Boersma, C., Bauschlicher, C. W., Allamandola, L. J., et al. 2010, A&A, 511, A32
work page 2010
-
[10]
Boersma, C., Bregman, J., & Allamandola, L. J. 2014, ApJ, 795, 110
work page 2014
-
[11]
Boersma, C., Bregman, J., & Allamandola, L. J. 2015, ApJ, 806, 121
work page 2015
-
[12]
Boersma, C., Bregman, J. D., & Allamandola, L. J. 2013, ApJ, 769, 117
work page 2013
-
[13]
Boersma, C., Mattioda, A. L., Bauschlicher, Jr., C. W., et al. 2009, ApJ, 690, 1208
work page 2009
- [14]
-
[15]
Cami, J., Bernard-Salas, J., Peeters, E., & Malek, S. E. 2010, Science, 329, 1180
work page 2010
- [16]
-
[17]
Chokshi, A., Tielens, A. G. G. M., Werner, M. W., & Castelaz, M. W. 1988, ApJ, 334, 803
work page 1988
- [18]
-
[19]
A., Candian, A., Berné, O., & Tielens, A
Croiset, B. A., Candian, A., Berné, O., & Tielens, A. G. G. M. 2016, A&A, 590, A26
work page 2016
-
[20]
Draine, B. T. 1978, ApJS, 36, 595
work page 1978
-
[21]
Duley, W. W. & Hu, A. 2012, ApJ, 745, L11
work page 2012
-
[22]
Fleming, B., France, K., Lupu, R. E., & McCandliss, S. R. 2010, ApJ, 725, 159
work page 2010
-
[23]
Galliano, F., Madden, S. C., Tielens, A. G. G. M., Peeters, E., & Jones, A. P. 2008, ApJ, 679, 310 García-Hernández, D. A., Manchado, A., García-Lario, P., et al. 2010, ApJ, 724, L39
work page 2008
-
[24]
Habart, E., Abergel, A., Walmsley, C. M., Teyssier, D., & Pety, J. 2005, A&A, 437, 177
work page 2005
-
[25]
Habing, H. J. 1968, Bull. Astron. Inst. Netherlands, 19, 421
work page 1968
-
[26]
Hollenbach, D. J. & Tielens, A. G. G. M. 1997, ARA&A, 35, 179
work page 1997
-
[27]
Hollenbach, D. J. & Tielens, A. G. G. M. 1999, Reviews of Modern Physics, 71, 173
work page 1999
-
[28]
Hony, S., Van Kerckhoven, C., Peeters, E., et al. 2001, A&A, 370, 1030
work page 2001
-
[29]
Hudgins, D. M. & Allamandola, L. J. 1999, ApJ, 516, L41
work page 1999
-
[30]
Jensen, P. A., Leccese, M., Simonsen, F. D. S., et al. 2019, MNRAS, 486, 5492
work page 2019
-
[31]
2025, A&A, 699, A133 Köhler, M., Habart, E., Arab, H., et al
Khan, B., Abbott, B., Peeters, E., et al. 2025, A&A, 699, A133 Köhler, M., Habart, E., Arab, H., et al. 2014, A&A, 569, A109
work page 2025
- [32]
-
[33]
Mackie, C. J., Candian, A., Lee, T. J., & Tielens, A. G. G. M. 2022, The journal of physical chemistry. A, 126, 3198—3209
work page 2022
-
[34]
J., Peeters, E., Bauschlicher, C
Mackie, C. J., Peeters, E., Bauschlicher, C. W., J., & Cami, J. 2015, ApJ, 799, 131
work page 2015
-
[35]
PDRs4All: XVIII. The evolution of the PAH ionisation and PAH size distribution across the Orion Bar
Maragkoudakis, A., Boersma, C., Peeters, E., et al. 2026, arXiv e-prints, arXiv:2601.23282
work page internal anchor Pith review Pith/arXiv arXiv 2026
-
[36]
Marconi, A., Testi, L., Natta, A., & Walmsley, C. M. 1998, A&A, 330, 696
work page 1998
-
[37]
Mattioda, A. L., Hudgins, D. M., Boersma, C., et al. 2020, ApJS, 251, 22
work page 2020
- [38]
- [39]
- [40]
- [41]
-
[42]
Peeters, E., Bauschlicher, Jr., C. W., Allamandola, L. J., et al. 2017, ApJ, 836, 198
work page 2017
- [43]
-
[44]
Peeters, E., Hony, S., Van Kerckhoven, C., et al. 2002, A&A, 390, 1089
work page 2002
-
[45]
Peeters, E., Mattioda, A. L., Hudgins, D. M., & Allamandola, L. J. 2004, ApJ, 617, L65
work page 2004
-
[46]
Peeters, E., Tielens, A. G. G. M., Allamandola, L. J., & Wolfire, M. G. 2012, ApJ, 747, 44
work page 2012
-
[47]
Pilleri, P., Montillaud, J., Berné, O., & Joblin, C. 2012, A&A, 542, A69
work page 2012
- [48]
- [49]
-
[50]
Ricca, A., Bauschlicher, Jr., C. W., Boersma, C., Tielens, A. G. G. M., & Alla- mandola, L. J. 2012, ApJ, 754, 75
work page 2012
-
[51]
Ricca, A., Bauschlicher, Jr., C. W., Mattioda, A. L., Boersma, C., & Allaman- dola, L. J. 2010, ApJ, 709, 42
work page 2010
-
[52]
Rosenberg, M. J. F., Berné, O., Boersma, C., Allamandola, L. J., & Tielens, A. G. G. M. 2011, A&A, 532, A128
work page 2011
- [53]
-
[54]
Sellgren, K., Werner, M. W., Ingalls, J. G., et al. 2010, ApJ, 722, L54
work page 2010
-
[55]
Shannon, M. J. & Boersma, C. 2019, ApJ, 871, 124
work page 2019
- [56]
- [57]
-
[58]
Sidhu, A., Bazely, J., Peeters, E., & Cami, J. 2022, MNRAS, 511, 2186
work page 2022
-
[59]
Sidhu, A., Tielens, A. G. G. M., Peeters, E., & Cami, J. 2023, MNRAS, 522, 3227
work page 2023
-
[60]
Singh, A. K., Anand, R. K., & Rastogi, S. 2025, arXiv e-prints, arXiv:2508.11407
-
[61]
Sloan, G. C., Jura, M., Duley, W. W., et al. 2007, ApJ, 664, 1144
work page 2007
-
[62]
Smith, J. D. T., Draine, B. T., Dale, D. A., et al. 2007, ApJ, 656, 770
work page 2007
-
[63]
Stock, D. J., Choi, W. D. Y ., Moya, L. G. V ., et al. 2016, ApJ, 819, 65
work page 2016
-
[64]
Stock, D. J. & Peeters, E. 2017, ApJ, 837, 129
work page 2017
-
[65]
Thrower, J. D., Jørgensen, B., Friis, E. E., et al. 2012, ApJ, 752, 3 Van De Putte, D., Meshaka, R., Trahin, B., et al. 2024, A&A, 687, A86 Van De Putte, D., Peeters, E., Gordon, K. D., et al. 2025, A&A, 701, A111 van Diedenhoven, B., Peeters, E., Van Kerckhoven, C., et al. 2004, ApJ, 611, 928 Van Kerckhoven, C., Hony, S., Peeters, E., et al. 2000, A&A, 357, 1013
work page 2012
-
[66]
Werner, M. W., Uchida, K. I., Sellgren, K., et al. 2004, ApJS, 154, 309
work page 2004
-
[67]
G., Vallini, L., & Chevance, M
Wolfire, M. G., Vallini, L., & Chevance, M. 2022, ARA&A, 60, 247
work page 2022
-
[68]
M., Linnartz, H., & Tielens, A
Zhen, J., Castellanos, P., Paardekooper, D. M., Linnartz, H., & Tielens, A. G. G. M. 2014, ApJ, 797, L30 Article number, page 17 A&A proofs:manuscript no. aa58975-26 Appendix A: Overview of all maps For completeness, in Fig. A.1, we illustrate the spatial distribu- tion of the dust continuum emission as derived from the PAHFIT results. The results themsel...
work page 2014
discussion (0)
Sign in with ORCID, Apple, or X to comment. Anyone can read and Pith papers without signing in.