PDRs4All: XVIII. The evolution of the PAH ionisation and PAH size distribution across the Orion Bar
Pith reviewed 2026-05-16 09:11 UTC · model grok-4.3
The pith
Spectral modeling shows cationic PAHs peak in the atomic PDR of the Orion Bar while neutral and anionic PAHs dominate deeper in the molecular cloud.
A machine-rendered reading of the paper's core claim, the machinery that carries it, and where it could break.
Core claim
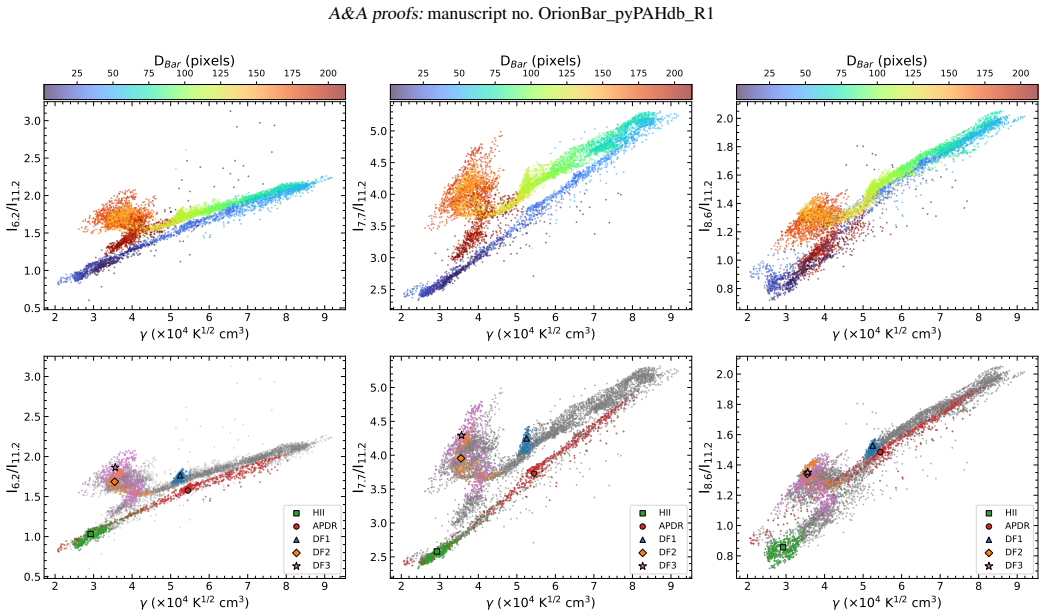
Using the pyPAHdb tool to fit the 5-15 micron PAH emission bands, the authors extract the fractional contributions of neutral, cationic, and anionic PAHs together with their size distribution in each physical zone. Cationic emission reaches its maximum in the atomic PDR, neutral emission peaks in the HII region and past the second dissociation front, and anionic emission is detected only within DF2 and DF3. The derived average PAH size is 60-74 carbon atoms and stays roughly constant. The fits indicate top-down PAH formation at the ionization front and bottom-up formation inside the molecular cloud. The ionization parameter gamma lies between 2 and 9 times 10 to the fourth, and intensity–rat
What carries the argument
pyPAHdb spectral decomposition of the 5-15 micron bands that separates contributions from neutral, cationic, and anionic PAHs using templates from the NASA Ames PAH database.
If this is right
- Intensity ratios that trace PAH ionization scale reliably with the parameter gamma only in regions dominated by edge-on or face-on PDR emission.
- Empirical ratio tracers become unreliable inside the molecular cloud zone and must be replaced by full spectral modeling.
- PAH size remains in the 60-74 carbon range across zones, consistent with stronger ultraviolet processing nearer the ionization front.
- The coexistence of top-down and bottom-up formation routes within a single object shows that PAH populations are actively reshaped by local conditions.
Where Pith is reading between the lines
- The same transition from top-down to bottom-up formation could be searched for in other PDRs that have different densities or radiation intensities.
- If the size distribution stays narrow, models of interstellar carbon chemistry may need to include a stable reservoir of mid-sized PAHs rather than continuous growth or destruction.
- Past observations that relied on simple intensity ratios in molecular-cloud sightlines may require reanalysis with full spectral fits.
Load-bearing premise
The pyPAHdb decomposition uniquely and accurately separates neutral, cationic, and anionic contributions from the observed 5-15 micron spectra without significant degeneracies or template mismatches in these environments.
What would settle it
Laboratory spectra or higher-resolution observations that show the fitted templates fail to reproduce the exact band positions or relative strengths in any zone would invalidate the derived charge fractions and size distribution.
Figures


read the original abstract
We investigate the evolution of the PAH population's charge state and size across key physical zones in the Orion Bar, which include the HII region, the atomic PDR (APDR), and three HI/H2 dissociation fronts (DF1, DF2, and DF3). Utilising the NASA Ames PAH Infrared Spectroscopic Database (PAHdb) and the pyPAHdb spectral modelling tool, we analysed the MIRI-MRS observations of the Orion Bar from the "PDRs4All" ERS Program. pyPAHdb modelling reveals the fractional contribution of the different PAH charge states and sizes to the total PAH emission across the Orion Bar. Cationic PAH emission peaks in the APDR region, where neutral PAHs have minimal contribution. Emission from neutral PAHs peaks in the HII region that consists of emission from a face-on PDR associated to the background OMC-1 molecular cloud, and in the molecular cloud regions past DF2. PAH anions are observed deep within the DF2 and DF3 zones. The average PAH size ranges between ~$60-74$ Nc. The modelling reveals regions of top-down PAH formation at the ionisation front, and bottom-up PAH formation within the molecular cloud region. The PAH ionisation parameter $\gamma$ ranges between ~$2-9 x 10^4$. Intensity ratios tracing PAH ionisation scale well with $\gamma$ in regions encompassing edge-on or face-on PDR emission, but their correlation weakens within the molecular cloud zone. Modelling of the $5-15$ $\mu$m PAH spectrum with pyPAHdb achieves comprehensive characterization of the net contribution of neutral and cationic PAHs across different environments, whereas empirical PAH proxy intensity ratio tracers can be highly variable and unreliable outside regions dominated by PDR emission. The derived average PAH size in the different physical zones is consistent with a view of PAHs being more extensively subjected to ultraviolet processing closer to the ionisation front, and less affected within the molecular cloud.
Editorial analysis
A structured set of objections, weighed in public.
Referee Report
Summary. The manuscript analyzes MIRI-MRS spectra of the Orion Bar using pyPAHdb modeling to map PAH charge-state fractions (neutral, cationic, anionic) and average sizes across the HII region, atomic PDR, and dissociation fronts DF1–DF3. It reports cationic emission peaking in the APDR, neutral emission in the HII and molecular cloud zones, anionic PAHs deep in DF2/DF3, average sizes of 60–74 carbon atoms, and ionization parameter γ ranging from 2–9×10^4, interpreting the spatial patterns as evidence for top-down PAH formation at the ionization front and bottom-up formation in the molecular cloud while noting that intensity-ratio tracers correlate with γ only in PDR-dominated regions.
Significance. If the pyPAHdb decomposition holds, the spatially resolved charge and size maps provide a concrete observational benchmark for PAH processing and formation pathways in a well-studied PDR, with the caution that empirical intensity ratios are unreliable outside edge-on PDR zones offering a practical takeaway for the community.
major comments (2)
- [Abstract] Abstract: The headline interpretation of top-down PAH formation at the ionization front versus bottom-up formation in the molecular cloud is derived solely from the pyPAHdb charge-state fractions and γ values, yet the abstract supplies no fit-residual statistics, covariance matrices, or tests against alternative PAHdb template subsets to demonstrate that the decomposition is unique and free of degeneracies under the Orion Bar radiation fields.
- [Abstract] Abstract: The reported ranges for average PAH size (~60–74 Nc) and γ (~2–9×10^4) are presented without uncertainties, error propagation details, or zone-by-zone fitting statistics, which are required to evaluate whether the claimed spatial gradients and intensity-ratio scaling are statistically significant rather than artifacts of the modeling procedure.
minor comments (2)
- [Abstract] Abstract: The notation 'x 10^4' should be rendered as the standard scientific multiplier '×10^4'.
- [Abstract] Abstract: The statement that the HII region 'consists of emission from a face-on PDR associated to the background OMC-1 molecular cloud' would benefit from a short clause indicating how this component was spatially or spectrally isolated from the foreground PDR emission.
Simulated Author's Rebuttal
We thank the referee for their constructive comments on the abstract. We address each point below and have revised the abstract to incorporate additional details on modeling robustness, fit quality, and uncertainties while preserving its concise nature.
read point-by-point responses
-
Referee: [Abstract] Abstract: The headline interpretation of top-down PAH formation at the ionization front versus bottom-up formation in the molecular cloud is derived solely from the pyPAHdb charge-state fractions and γ values, yet the abstract supplies no fit-residual statistics, covariance matrices, or tests against alternative PAHdb template subsets to demonstrate that the decomposition is unique and free of degeneracies under the Orion Bar radiation fields.
Authors: The abstract serves as a high-level summary; detailed residual maps, covariance information, and tests against alternative PAHdb template subsets (showing stable charge-state fractions with residuals typically below 5% in the 5-15 μm range) are presented in the methods and results sections of the full manuscript. These tests confirm the decomposition is robust and not strongly degenerate under the Orion Bar radiation field. To better support the headline claims, we will revise the abstract to briefly note the goodness-of-fit and uniqueness of the solutions. revision: yes
-
Referee: [Abstract] Abstract: The reported ranges for average PAH size (~60–74 Nc) and γ (~2–9×10^4) are presented without uncertainties, error propagation details, or zone-by-zone fitting statistics, which are required to evaluate whether the claimed spatial gradients and intensity-ratio scaling are statistically significant rather than artifacts of the modeling procedure.
Authors: We agree that uncertainties and zone-specific statistics strengthen the presentation. The full manuscript contains the underlying per-pixel fitting results and maps from which the ranges are derived. In the revised version we will update the abstract to report the size and γ ranges with uncertainties (obtained via standard error propagation from the pyPAHdb fits) and note that the spatial gradients remain significant across the HII, APDR, and DF zones. revision: yes
Circularity Check
No significant circularity detected
full rationale
The paper applies the established pyPAHdb fitting procedure to MIRI-MRS spectra to extract charge-state fractions, average sizes, and the ionization parameter γ directly from the data. It then reports spatial trends in these quantities and notes that certain intensity ratios correlate with γ in PDR zones. No quoted step equates a claimed result (e.g., top-down vs. bottom-up formation regions) to its inputs by construction, nor does any prediction reduce to a fitted parameter renamed as output. The formation interpretations are post-hoc inferences from the extracted fractions rather than tautological outputs, and the correlation check is an empirical observation on the fitted model rather than a forced statistical identity. The derivation chain remains self-contained against the observed spectra without load-bearing self-citations or ansatzes that loop back to the target claims.
Axiom & Free-Parameter Ledger
free parameters (3)
- PAH charge state fractions
- Average PAH size (Nc)
- Ionisation parameter γ
axioms (2)
- domain assumption The NASA Ames PAH Infrared Spectroscopic Database provides representative spectral templates for the interstellar PAH population in the Orion Bar.
- domain assumption The 5-15 μm emission is dominated by PAH features that can be linearly decomposed into charge and size components without major contributions from other carriers.
Forward citations
Cited by 3 Pith papers
-
JWST observations of photodissociation regions. IV. Carbonaceous emission band sub-components in NGC 7023 have distinct spatial distributions
Sub-components of the 5.7, 7.7, 11.3, 12.7 and 16-18 μm bands exhibit distinct spatial distributions in NGC 7023, indicating at least two different populations of carbonaceous emission carriers.
-
JWST Observations of Starbursts: Dust Processing in the M82 Superwind
PAH abundance remains constant at ~1% throughout the M82 superwind to 5 kpc, indicating shielding within cool cloud surfaces rather than destruction by the hot outflow.
-
JWST Observations of Starbursts: Dust Processing in the M82 Superwind
JWST observations find constant ~1% PAH abundance in the M82 superwind to 5 kpc, consistent with shielding in surface layers of cool clouds and possible replenishment.
Reference graph
Works this paper leans on
-
[1]
Allamandola, L. J., Boersma, C., Lee, T. J., Bregman, J. D., & Temi, P. 2021, ApJ, 917, L35
work page 2021
-
[2]
Allamandola, L. J., Hudgins, D. M., & Sandford, S. A. 1999, ApJ, 511, L115
work page 1999
-
[3]
Allamandola, L. J., Tielens, A. G. G. M., & Barker, J. R. 1985, ApJ, 290, L25
work page 1985
-
[4]
Allamandola, L. J., Tielens, A. G. G. M., & Barker, J. R. 1989, ApJS, 71, 733
work page 1989
- [5]
-
[6]
Bakes, E. L. O. & Tielens, A. G. G. M. 1994, ApJ, 427, 822
work page 1994
-
[7]
Bally, J., O’Dell, C. R., & McCaughrean, M. J. 2000, AJ, 119, 2919
work page 2000
-
[8]
W., Boersma, C., Ricca, A., et al
Bauschlicher, Jr., C. W., Boersma, C., Ricca, A., et al. 2010, ApJS, 189, 341
work page 2010
-
[9]
Bauschlicher, Charles W., J., Ricca, A., Boersma, C., & Allamandola, L. J. 2018, ApJS, 234, 32
work page 2018
-
[10]
Beintema, D. A., van den Ancker, M. E., Molster, F. J., et al. 1996, A&A, 315, L369
work page 1996
-
[11]
2012, A&A, 538, A37 Berné, O., Foschino, S., Jalabert, F., & Joblin, C
Bernard-Salas, J., Habart, E., Arab, H., et al. 2012, A&A, 538, A37 Berné, O., Foschino, S., Jalabert, F., & Joblin, C. 2022a, A&A, 667, A159 Berné, O., Habart, É., Peeters, E., et al. 2022b, PASP, 134, 054301 Berné, O., Habart, E., Peeters, E., et al. 2024, Science, 383, 988 Berné, O., Joblin, C., Deville, Y ., et al. 2007, A&A, 469, 575 Berné, O., Marti...
work page 2012
-
[12]
Boersma, C., Allamandola, L. J., Esposito, V . J., et al. 2023, ApJ, 959, 74
work page 2023
-
[13]
Boersma, C., Bauschlicher, Jr., C. W., Ricca, A., et al. 2014, ApJS, 211, 8
work page 2014
-
[14]
Boersma, C., Bregman, J., & Allamandola, L. J. 2015, ApJ, 806, 121
work page 2015
-
[15]
Boersma, C., Bregman, J., & Allamandola, L. J. 2018, ApJ, 858, 67
work page 2018
-
[16]
Boersma, C., Bregman, J. D., & Allamandola, L. J. 2013, ApJ, 769, 117
work page 2013
-
[17]
Boersma, C., Mattioda, A. L., Bauschlicher, C. W., et al. 2009, ApJ, 690, 1208
work page 2009
-
[18]
Witteborn, F. C. 1989, ApJ, 344, 791
work page 1989
-
[19]
2011, in EAS Publications Series, V ol
Cami, J. 2011, in EAS Publications Series, V ol. 46, EAS Publications Series, 117–122
work page 2011
-
[20]
P., Lequeux, J., & Verstraete, L
Cesarsky, D., Jones, A. P., Lequeux, J., & Verstraete, L. 2000, A&A, 358, 708
work page 2000
-
[21]
Chastenet, J., Sutter, J., Sandstrom, K., et al. 2023, ApJ, 944, L12
work page 2023
-
[22]
Cheng, B.-M., Chen, H.-F., Lu, H.-C., et al. 2011, ApJS, 196, 3 Article number, page 10 of 12 Maragkoudakis et al.: PDRs4All XVIII: PAH Ionisation and Size Across the Orion Bar
work page 2011
- [23]
-
[24]
A., Candian, A., Berné, O., & Tielens, A
Croiset, B. A., Candian, A., Berné, O., & Tielens, A. G. G. M. 2016, A&A, 590, A26
work page 2016
-
[25]
Draine, B. T. & Li, A. 2007, ApJ, 657, 810
work page 2007
-
[26]
Draine, B. T., Li, A., Hensley, B. S., et al. 2021, ApJ, 917, 3
work page 2021
-
[27]
V ., Kreckel, K., Sandstrom, K
Egorov, O. V ., Kreckel, K., Sandstrom, K. M., et al. 2023, ApJ, 944, L16
work page 2023
-
[28]
Ekern, S. P., Marshall, A. G., Szczepanski, J., & Vala, M. 1998, Journal of Phys- ical Chemistry A, 102, 3498
work page 1998
-
[29]
Galliano, F., Madden, S. C., Tielens, A. G. G. M., Peeters, E., & Jones, A. P. 2008, ApJ, 679, 310 García-Bernete, I., Rigopoulou, D., Alonso-Herrero, A., et al. 2022, A&A, 666, L5
work page 2008
-
[30]
R., Pety, J., Cuadrado, S., et al
Goicoechea, J. R., Pety, J., Cuadrado, S., et al. 2025, A&A, 696, A100
work page 2025
-
[31]
R., Pety, J., Cuadrado, S., et al
Goicoechea, J. R., Pety, J., Cuadrado, S., et al. 2016, Nature, 537, 207
work page 2016
-
[32]
Goicoechea, J. R., Santa-Maria, M. G., Bron, E., et al. 2019, A&A, 622, A91
work page 2019
- [33]
-
[34]
Habing, H. J. 1968, Bull. Astron. Inst. Netherlands, 19, 421
work page 1968
-
[35]
Haworth, T. J., Reiter, M., O’Dell, C. R., et al. 2023, MNRAS, 525, 4129
work page 2023
-
[36]
Heays, A. N., Bosman, A. D., & van Dishoeck, E. F. 2017, A&A, 602, A105
work page 2017
-
[37]
Hogerheijde, M. R., Jansen, D. J., & van Dishoeck, E. F. 1995, A&A, 294, 792
work page 1995
-
[38]
Hony, S., Van Kerckhoven, C., Peeters, E., et al. 2001, A&A, 370, 1030
work page 2001
- [39]
-
[40]
Joblin, C., Tielens, A. G. G. M., Allamandola, L. J., & Geballe, T. R. 1996, ApJ, 458, 610
work page 1996
-
[41]
W., Ruhl, E., Baumgartel, H., Tobita, S., & Leach, S
Jochims, H. W., Ruhl, E., Baumgartel, H., Tobita, S., & Leach, S. 1994, ApJ, 420, 307
work page 1994
-
[42]
Kassis, M., Adams, J. D., Campbell, M. F., et al. 2006, ApJ, 637, 823
work page 2006
- [43]
-
[44]
Knight, C., Peeters, E., Stock, D. J., Vacca, W. D., & Tielens, A. G. G. M. 2021, ApJ, 918, 8
work page 2021
-
[45]
Knight, C., Peeters, E., Tielens, A. G. G. M., & Vacca, W. D. 2022, MNRAS, 509, 3523
work page 2022
-
[46]
Lai, T. S. Y ., Armus, L., Bianchin, M., et al. 2023, ApJ, 957, L26
work page 2023
-
[47]
Lai, T. S. Y ., Armus, L., U, V ., et al. 2022, ApJ, 941, L36
work page 2022
- [48]
-
[49]
J., Candian, A., Huang, X., et al
Mackie, C. J., Candian, A., Huang, X., et al. 2016, Journal of Chemical Physics, 145, 084313
work page 2016
-
[50]
Maltseva, E., Mackie, C. J., Candian, A., et al. 2018, A&A, 610, A65
work page 2018
-
[51]
Maragkoudakis, A., Boersma, C., Temi, P., Bregman, J. D., & Allamandola, L. J. 2022, ApJ, 931, 38
work page 2022
-
[52]
Maragkoudakis, A., Boersma, C., Temi, P., et al. 2025, ApJ, 979, 90
work page 2025
-
[53]
Maragkoudakis, A., Ivkovich, N., Peeters, E., et al. 2018, MNRAS, 481, 5370
work page 2018
-
[54]
Maragkoudakis, A., Peeters, E., & Ricca, A. 2020, MNRAS, 494, 642
work page 2020
-
[55]
Mattioda, A. L., Hudgins, D. M., Boersma, C., et al. 2020, ApJS, 251, 22
work page 2020
-
[56]
Parikka, A., Habart, E., Bernard-Salas, J., Köhler, M., & Abergel, A. 2018, A&A, 617, A77
work page 2018
-
[57]
Pasquini, S., Peeters, E., Schefter, B., et al. 2024, A&A, 685, A77
work page 2024
-
[58]
Peeters, E., Bauschlicher, Jr., C. W., Allamandola, L. J., et al. 2017, ApJ, 836, 198
work page 2017
- [59]
-
[60]
Peeters, E., Spoon, H. W. W., & Tielens, A. G. G. M. 2004, ApJ, 613, 986
work page 2004
-
[61]
Pilleri, P., Joblin, C., Boulanger, F., & Onaka, T. 2015, A&A, 577, A16
work page 2015
-
[62]
Pilleri, P., Montillaud, J., Berné, O., & Joblin, C. 2012, A&A, 542, A69
work page 2012
-
[63]
Allamandola, L. J. 2012, ApJ, 754, 75
work page 2012
-
[64]
Rigopoulou, D., Donnan, F. R., García-Bernete, I., et al. 2024, arXiv e-prints, arXiv:2406.11415
- [65]
- [66]
-
[67]
Schutte, W. A., Tielens, A. G. G. M., & Allamandola, L. J. 1993, ApJ, 415, 397
work page 1993
-
[68]
Shannon, M. J. & Boersma, C. 2018, in Proceedings of the 17th Python in Sci- ence Conference (SciPy), 99
work page 2018
-
[69]
Smith, J. D. T., Draine, B. T., Dale, D. A., et al. 2007, ApJ, 656, 770
work page 2007
-
[70]
Stock, D. J., Choi, W. D.-Y ., Moya, L. G. V ., et al. 2016, ApJ, 819, 65
work page 2016
-
[71]
Stock, D. J. & Peeters, E. 2017, ApJ, 837, 129
work page 2017
-
[72]
Tielens, A. G. G. M. 2005, The Physics and Chemistry of the Interstellar Medium (Cambridge Univ. Press, Cambridge)
work page 2005
-
[73]
Tielens, A. G. G. M., Meixner, M. M., van der Werf, P. P., et al. 1993, Science, 262, 86 Van De Putte, D., Meshaka, R., Trahin, B., et al. 2024, A&A, 687, A86 Van De Putte, D., Peeters, E., Gordon, K. D., et al. 2025, A&A, 701, A111
work page 1993
-
[74]
Vicente, S., Berné, O., Tielens, A. G. G. M., et al. 2013, ApJ, 765, L38
work page 2013
-
[75]
Werner, M. W., Uchida, K. I., Sellgren, K., et al. 2004, ApJS, 154, 309
work page 2004
-
[76]
X., Maragkoudakis, A., & Peeters, E
Zang, R. X., Maragkoudakis, A., & Peeters, E. 2022, MNRAS, 511, 5142
work page 2022
- [77]
-
[78]
Road, Tangjia, Zhuhai 519000, Guangdong Province, China Article number, page 11 of 12 A&A proofs:manuscript no. OrionBar_pyPAHdb_R1 5h35m20.8s -5°25'20" 15" 10" 05" 00" DF3 DF2 DF1 IF 0.10 0.15 0.20 0.25 0.30 0.35 0.40 pyPAHdb Fig. A.1.The pyPAHdb modelling error (σ pyPAHdb ) map. Appendix A: pyPAHdb modelling error The pyPAHdb modelling error (σpyPAHdb )...
work page 2018
discussion (0)
Sign in with ORCID, Apple, or X to comment. Anyone can read and Pith papers without signing in.