Recognition: unknown
Possible fractal nature of accretion flows in MAD and SANE simulations: Implications to GRS 1915+105
Pith reviewed 2026-05-10 07:19 UTC · model grok-4.3
The pith
MAD accretion flows show higher Higuchi fractal dimensions and flatter spectra than SANE flows in GRMHD simulations.
A machine-rendered reading of the paper's core claim, the machinery that carries it, and where it could break.
Core claim
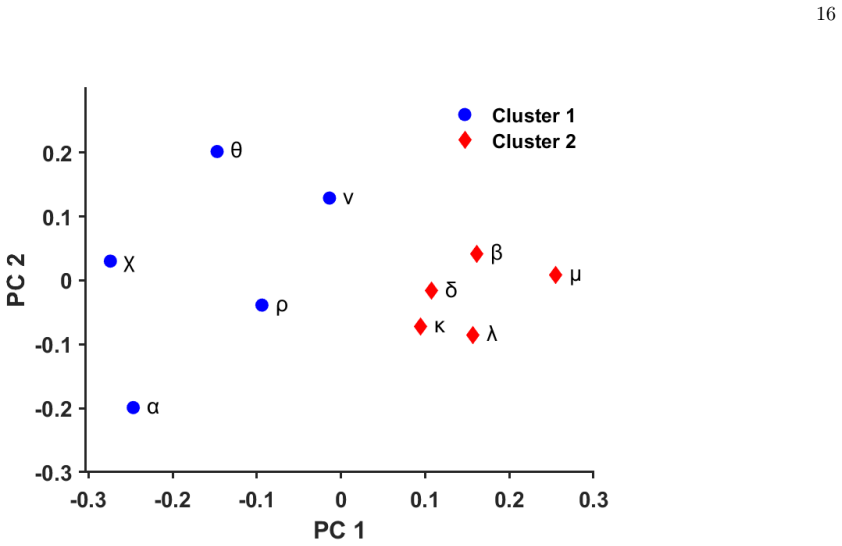
In GRMHD simulations performed with both HARMPI and BHAC codes, magnetically arrested disks exhibit higher Higuchi fractal dimensions, lower Hurst indices, and flatter spectral slopes than standard and normal evolution disks for both disk and jet time series; HFD decreases with spin magnitude in MADs due to more collimated jets while it increases with positive spin in SANEs due to wind-jet interplay, and the same metrics applied to X-ray data from GRS 1915+105 produce MAD-like and SANE-like clusters with higher mean HFD in the former group.
What carries the argument
Higuchi fractal dimension (HFD) applied to time series extracted from GRMHD simulation outputs and from X-ray light curves, serving as a quantitative indicator of intermittency and temporal correlation strength.
Load-bearing premise
Nonlinear time series metrics computed on simulation data map directly onto observable spectral and variability properties of real black hole systems such as GRS 1915+105.
What would settle it
X-ray time series from GRS 1915+105 showing no separation into two clusters with differing mean HFD when binned by spectral hardness, or MAD and SANE simulations producing statistically indistinguishable HFD distributions.
Figures


read the original abstract
The general relativistic magnetohydrodynamic (GRMHD) simulations are widely used to study accretion disk and jet dynamics around a black hole. Despite strong observational evidences for intrinsically nonlinear behavior, the interpretations of GRMHD simulation results, more precisely the underlying timeseries, have not been well-explored by nonlinear timeseries analysis. In this work, we characterize the jet and disk dynamics of different GRMHD simulated flows using the nonlinear timeseries analysis. As diagnostic tools, we consider Higuchi fractal dimension (HFD), Hurst Index (H) and spectral slope. We implement them for two model disk frameworks: magnetically arrested disk (MAD) and standard and normal evolution (SANE), across a range of black hole spins with the Kerr parameter spanning from -0.9375 to 0.9375. We simulate the disk/jet systems by two well-documented codes: HARMPI and BHAC, and obtain, respectively, low and high temporally resolved timeseries data. For both jet and disk dynamics, MADs are characterized by higher HFD, lower H and flatter spectral slopes than SANEs. High HFD in MAD could be due to its intermittent variability and indicates that it has lesser long-range temporal correlations than SANE. Moreover, HFD in MAD decreases with spin magnitude owing to increase in collimated, hence ordered, jets. However, in SANE, it increases with spin for positive ones due to interplay of winds and jets. Extending our analysis to observations, we attempt to segregate the classes of black hole: GRS 1915+105, into MAD- and SANE-like clusters based on their spectral properties extracted from X-ray data. The mean HFD of MAD-like cluster is higher than SANE-like cluster, thus, corroborating with the simulation results. Our work highlights the role of nonlinear timeseries analysis to understand the underlying dynamics of accretion flows and their connection to magnetic regulation.
Editorial analysis
A structured set of objections, weighed in public.
Referee Report
Summary. The paper applies nonlinear time-series metrics (Higuchi fractal dimension HFD, Hurst index H, and spectral slope) to GRMHD simulation outputs from HARMPI and BHAC codes for MAD and SANE accretion flows across black-hole spins from -0.9375 to 0.9375. It reports that MADs exhibit higher HFD, lower H, and flatter spectral slopes than SANEs for both disk and jet dynamics, with HFD trends depending on spin. The analysis is extended to X-ray data of GRS 1915+105 by clustering sources into MAD-like and SANE-like groups based on spectral properties and finding a higher mean HFD in the MAD-like cluster.
Significance. If the claimed distinctions and observational mapping hold after addressing methodological gaps, the work could provide a new diagnostic linking fractal properties of accretion flows to magnetic states (MAD vs SANE), with potential implications for interpreting variability in sources like GRS 1915+105. The use of two independent codes (HARMPI, BHAC) adds robustness to the simulation results. However, the overall significance remains moderate due to the untested physical correspondence between simulation time series and observed X-ray light curves.
major comments (3)
- [Abstract] Abstract: the claim that higher mean HFD in the MAD-like cluster of GRS 1915+105 'corroborates' the simulation results is not supported, because the clustering is performed on spectral properties while HFD is then computed on the same light curves without any demonstration that the clustering variable is independent of HFD (or of the other two metrics) and without reported statistical tests, error bars, or data-exclusion criteria.
- [Observational analysis] The observational extension (described after the simulation results): no forward-modeling or proxy test is shown to establish that HFD computed on simulation variables (accretion rate or magnetic flux) produces values comparable to HFD computed on Poisson-noisy, irregularly sampled X-ray count-rate light curves; this mapping is load-bearing for the central claim that the metrics distinguish MAD/SANE classes in both domains.
- [Methods] Methods for the time-series metrics: the abstract and results present comparative HFD/H/slope values but provide no details on window lengths, embedding dimensions, frequency ranges for the spectral slope, or handling of finite-length effects and numerical resolution differences between the low- and high-resolution HARMPI/BHAC runs; these choices directly affect the reported MAD/SANE distinctions.
minor comments (2)
- [Abstract] The abstract states that HFD in MAD 'decreases with spin magnitude' but does not specify whether this holds for both positive and negative spins or only one sign; the corresponding figure or table should clarify the spin dependence separately for each sign.
- [Throughout] Notation for the Hurst index is introduced as 'H' but later references to 'H' could be confused with black-hole spin; a brief clarification or consistent use of 'Hurst index' would improve readability.
Simulated Author's Rebuttal
We thank the referee for the constructive comments and the opportunity to improve our manuscript. We address each major comment below and have made revisions to clarify methods, add statistical details, and acknowledge limitations in the observational mapping.
read point-by-point responses
-
Referee: [Abstract] Abstract: the claim that higher mean HFD in the MAD-like cluster of GRS 1915+105 'corroborates' the simulation results is not supported, because the clustering is performed on spectral properties while HFD is then computed on the same light curves without any demonstration that the clustering variable is independent of HFD (or of the other two metrics) and without reported statistical tests, error bars, or data-exclusion criteria.
Authors: We partially agree with this assessment. The clustering relies on spectral properties (hardness ratio and intensity), which are not directly the same as the time-series metrics, but we did not explicitly demonstrate independence or provide statistical tests in the original submission. In the revision, we have included error bars on the mean HFD for each cluster, conducted a two-sample t-test showing p < 0.05 for the difference, and added a sentence noting that spectral clustering variables are orthogonal to the fractal metrics in the sense that they capture average spectral shape rather than temporal correlations. We have also specified the data exclusion criteria (e.g., excluding observations with insufficient duration). The abstract has been updated to reflect these additions while retaining the core finding. revision: yes
-
Referee: [Observational analysis] The observational extension (described after the simulation results): no forward-modeling or proxy test is shown to establish that HFD computed on simulation variables (accretion rate or magnetic flux) produces values comparable to HFD computed on Poisson-noisy, irregularly sampled X-ray count-rate light curves; this mapping is load-bearing for the central claim that the metrics distinguish MAD/SANE classes in both domains.
Authors: This comment highlights a genuine limitation in our work. A full forward-modeling would involve generating synthetic X-ray light curves from the GRMHD simulations using radiative transfer codes, accounting for Poisson noise and irregular sampling, which is computationally intensive and outside the primary scope of this paper on applying nonlinear metrics to existing simulation outputs and observations. We have added a paragraph in the discussion section acknowledging that the comparison is qualitative and that quantitative mapping requires future work with synthetic observations. However, we maintain that the relative trends (MAD-like having higher HFD) provide suggestive evidence, as both datasets reflect the underlying accretion variability. revision: partial
-
Referee: [Methods] Methods for the time-series metrics: the abstract and results present comparative HFD/H/slope values but provide no details on window lengths, embedding dimensions, frequency ranges for the spectral slope, or handling of finite-length effects and numerical resolution differences between the low- and high-resolution HARMPI/BHAC runs; these choices directly affect the reported MAD/SANE distinctions.
Authors: We agree that the Methods section lacked sufficient detail on these parameters. We have substantially expanded it in the revised manuscript to specify: for HFD, we used sliding windows of lengths from 256 to 4096 time steps with step size 128; the Hurst index was computed using rescaled range analysis with embedding dimension considerations via detrended fluctuation analysis for robustness; spectral slopes were fitted over the frequency range 0.001 to 0.1 (in normalized units) using least-squares on the log-log periodogram. Finite-length effects were addressed by applying linear detrending and using Welch's method for spectra. Regarding resolution differences, we have added a comparison showing that the MAD vs SANE distinctions in HFD (MAD higher by ~0.2-0.3) hold for both low-res HARMPI and high-res BHAC runs, with a new supplementary table. These details ensure reproducibility and confirm the robustness of our findings. revision: yes
- The lack of forward-modeling to directly compare simulation-derived HFD with observed X-ray HFD remains unaddressed in terms of quantitative validation, as it would require significant additional computational resources and expertise in radiative modeling.
Circularity Check
No significant circularity: independent metric computations on separate simulation and observational datasets
full rationale
The paper applies the standard metrics (HFD, Hurst index, spectral slope) directly to time series outputs from two independent GRMHD codes (HARMPI and BHAC) for MAD versus SANE models, then computes the same metrics on separate X-ray light curves of GRS 1915+105 to form clusters based on spectral properties and compares mean HFD values. No load-bearing step reduces by construction to a fitted parameter, self-definition, or self-citation chain; the derivation consists of straightforward, non-circular computations on distinct data sources with no equations or ansatzes that presuppose the target distinctions.
Axiom & Free-Parameter Ledger
axioms (2)
- domain assumption GRMHD simulations from HARMPI and BHAC accurately represent the physical processes in accretion disks and jets around black holes.
- domain assumption Higuchi fractal dimension, Hurst index, and spectral slope are meaningful and sufficient diagnostics for the underlying nonlinear dynamics of the flows.
Reference graph
Works this paper leans on
-
[1]
MAD:A ϕ = max(ρ/ρ 0 exp(−r/400)(r/rin)3 sin3 θ− 0.2,0),
-
[2]
SANE:A ϕ = max(ρ/ρ 0 −0.2,0), whereρ 0 is the maximum density in the initial torus, set atr= 41, whiler in = 20is the inner edge of the FM torus. The initial field strength is set by defining the initial plasma-βparameter to be100(plasma-β= pgas/pmag =p gas/(b2/2), wherep gas is the gas pressure andb 2 =b µbµ is the norm of the four-magnetic field). We st...
-
[3]
Outflow Efficiency:η=P c/ ˙M
-
[4]
We analyse the simulated data for both positive and negative spins:0.9375,0.5,0.3,0,−0.3,−0.5,and− 0.9375, representing prograde and retrograde motion re- spectively
Normalized magnetic flux: ϕ= √ 4π 2 √ ˙M R √−gB rdθdϕ, where ˙Mis the accretion rate, defined by ˙M= − R √−g ρu r dθdϕandP c is the outflow power defined asP c = ˙M− ˙E, ˙E= R √−gT r t dθdϕandT µ ν = (ρ+p+ ug +b 2)uµuν + (p+b 2/2)δµ ν −b µbν is the stress-energy tensor. We analyse the simulated data for both positive and negative spins:0.9375,0.5,0.3,0,−0...
-
[5]
Surrogate Data Analysis To identify the presence of nonlinearity in signals, we perform the surrogate analysis. We generate sur- rogate timeseries that preserve the PSD and the am- plitude distribution of the original data, while destroy- ing any intrinsic nonlinear structure and compare its HFD with the HFD of original timeseries. If the timeseries is no...
-
[6]
V below, we analyze data observed from the black hole source GRS 1915+105 in order to find natural implications of our results
Filtering Data In Sec. V below, we analyze data observed from the black hole source GRS 1915+105 in order to find natural implications of our results. Generally, observed data are contaminated by noise, which are advisable to filter, as was done in earlier similar analysis [46]. We filter various temporal classes of GRS 1915+105 lightcurves to reduce nois...
1915
-
[7]
spin- less black hole described by the Schwarzschild spacetime
Schwarzschild black hole We begin by considering the simplest case, i.e. spin- less black hole described by the Schwarzschild spacetime. Fig. 1a showsηfor MAD and SANE for simulated time- series in time spant= 0−30000 r g/c. The simulation reach a steady MAD state only after 20000rg/c. To en- sure stability within the system and stationarity of time- seri...
-
[8]
Rotating black hole with different spins Next, we observe the variation of the nonlinear char- acteristics with black hole spin. Fig. 2 showsηprofiles for MAD and SANE simulations for different spins span- ning highly counter-rotating to highly co-rotating black holes for time 25000 to 30000rg/c.ηfor SANE is con- sistently lower than MAD for all spins. Th...
1915
-
[9]
Class name [24] 3. HFD. 4.z-score using 39 surrogates for filtered timeseries. 11. Behaviour viaz-score for HFD, (NL: Nonlinear or S: Stochastic). 5. Behavior using correlation dimension [32] (D2; F: fractal, LC: limit cycle, S: Stochastic. 6. Power-law component (PL, in percent). 7. Multicolour black body component (diskbb, in percent). 8. PL photon spec...
1915
-
[10]
M. A. Nowak, B. A. Vaughan, J. Wilms, J. B. Dove, and M. C. Begelman, The Astrophysical Journal510, 874 (1999). 17 Figure 10. HFD for the filtered lightcurves of ten nonlinear GRS 1915+105 classes vs. their PL (left) and diskbb (right) extracted from Table. I. The classes are represented as orange circles. Regression curve is in black. Shaded region repre...
1999
-
[11]
van der Klis, inCompact Stellar X-ray Sources, edited by W
M. van der Klis, inCompact Stellar X-ray Sources, edited by W. H. G. Lewin and M. van der Klis (Cambridge University Press, Cambridge, 2006) pp. 39–112
2006
-
[12]
I. M. McHardy, E. Körding, C. Knigge, P. Uttley, and R. P. Fender, Nature444, 730 (2006)
2006
-
[13]
Misra, K
R. Misra, K. P. Harikrishnan, B. Mukhopadhyay, G. Am- bika, and A. K. Kembhavi, The Astrophysical Journal 609, 313 (2004)
2004
-
[14]
K. P. Harikrishnan, R. Misra, G. Ambika, and A. K. Kembhavi, Physica D: Nonlinear Phenomena215, 137 (2006)
2006
-
[15]
Grassberger and I
P. Grassberger and I. Procaccia, Physica D: Nonlinear Phenomena9, 189 (1983)
1983
-
[16]
Theiler, Physical Review A34, 2427 (1986), publisher: American Physical Society
J. Theiler, Physical Review A34, 2427 (1986), publisher: American Physical Society
1986
-
[17]
Kantz and T
H. Kantz and T. Schreiber,Nonlinear Time Series Anal- ysis, 2nd ed. (Cambridge University Press, 2004)
2004
-
[18]
Higuchi, Physica D: Nonlinear Phenomena31, 277 (1988)
T. Higuchi, Physica D: Nonlinear Phenomena31, 277 (1988)
1988
-
[19]
Accardo, M
A. Accardo, M. Affinito, M. Carrozzi, and F. Bouquet, Biological Cybernetics77, 339 (1997)
1997
-
[20]
Watari, Solar Physics163, 371 (1996)
S. Watari, Solar Physics163, 371 (1996)
1996
-
[21]
Bhatt, S
H. Bhatt, S. K. Sharma, R. Trivedi, and H. O. Vats, Monthly Notices of the Royal Astronomical Society475, 3117 (2018)
2018
-
[22]
R. T. J. McAteer, P. T. Gallagher, and J. Ireland, The Astrophysical Journal631, 628 (2005), publisher: IOP Publishing
2005
-
[23]
D. B. de Freitas, M. M. F. Nepomuceno, J. G. Cordeiro, M. L. Das Chagas, and J. R. De Medeiros, Monthly No- tices of the Royal Astronomical Society488, 3274 (2019)
2019
-
[24]
H. E. Hurst, Transactions of the American Society of Civil Engineers116, 770 (1951), publisher: American Society of Civil Engineers
1951
-
[25]
Adams, D
M. Adams, D. H. Hathaway, B. A. Stark, and Z. E. Musielak, Solar Physics174, 341 (1997)
1997
-
[26]
A. K. Singh and A. Bhargawa, Astrophysics and Space Science362, 199 (2017)
2017
-
[27]
Hurst Index of Gamma-Ray Burst Light Curves and Its Statistical Study,
R.-Y. Guan, F. Wang, and Y.-C. Zou, “Hurst Index of Gamma-Ray Burst Light Curves and Its Statistical Study,” (2025), arXiv:2509.11631 [astro-ph]
-
[28]
R.Narayan, I.V.Igumenshchev, andM.A.Abramowicz, Publications of the Astronomical Society of Japan55, L69 (2003)
2003
-
[29]
Tchekhovskoy, R
A. Tchekhovskoy, R. Narayan, and J. C. McKinney, Monthly Notices of the Royal Astronomical Society: Let- ters418, L79 (2011)
2011
-
[30]
Narayan, A
R. Narayan, A. Sądowski, R. F. Penna, and A. K. Kulka- rni, Monthly Notices of the Royal Astronomical Society 426, 3241 (2012)
2012
- [31]
-
[32]
Rohoza, M
V. Rohoza, M. Paik, A. Lalakos, K. Chatterjee, A. Tchekhovskoy, and M. Liska (2023) p. 116.35
2023
-
[33]
2000, A&A, 355, 271, doi: 10.48550/arXiv.astro-ph/0001103
T. Belloni, M. Klein-Wolt, M. Méndez, M. van der Klis, and J. van Paradijs, Astronomy and Astrophysics355, 271 (2000), arXiv:astro-ph/0001103 [astro-ph]
- [34]
-
[35]
R. Raha, B. Mukhopadhyay, K. Chatterjee, and S. M. Gopika, Astronomy Reports67, S189 (2023)
2023
-
[36]
J. F. Hawley, S. A. Balbus, and W. F. Winters, The Astrophysical Journal554, 49 (2001)
2001
-
[37]
J. C. McKinney, A. Tchekhovskoy, and R. D. Blandford, Monthly Notices of the Royal Astronomical Society423, 3083 (2012)
2012
-
[38]
B. Ripperda, O. Porth, L. Sironi, and R. Keppens, Monthly Notices of the Royal Astronomical Society485, 299 (2019), arXiv:1810.10116 [astro-ph.HE]
-
[39]
K. P. Harikrishnan, R. Misra, and G. Ambika, Research in Astronomy and Astrophysics11, 71 (2011)
2011
-
[40]
C. S. Pradeep, N. Sinha, and B. Mukhopadhyay, in ICASSP 2023 - 2023 IEEE International Conference 18 on Acoustics, Speech and Signal Processing (ICASSP) (2023) pp. 1–5, iSSN: 2379-190X
2023
-
[41]
Adegoke, P
O. Adegoke, P. Dhang, B. Mukhopadhyay, M. C. Ra- madevi, and D. Bhattacharya, Monthly Notices of the Royal Astronomical Society476, 1581 (2018)
2018
-
[42]
L. G. Fishbone and V. Moncrief, The Astrophysical Jour- nal207, 962 (1976)
1976
-
[43]
C. F. Gammie, J. C. McKinney, and G. Toth, The As- trophysical Journal589, 444–457 (2003)
2003
-
[44]
Tóth, Journal of Computational Physics161, 605 (2000)
G. Tóth, Journal of Computational Physics161, 605 (2000)
2000
-
[45]
Keppens, Z
R. Keppens, Z. Meliani, A. J. van Marle, P. Delmont, A. Vlasis, and B. van der Holst, Journal of Computa- tional Physics231, 718 (2012)
2012
- [46]
- [47]
-
[48]
Dedner, F
A. Dedner, F. Kemm, D. Kröner, C.-D. Munz, T. Schnitzer, and M. Wesenberg, Journal of Compu- tational Physics175, 645 (2002)
2002
-
[49]
S.Spasić, A.Kalauzi, M.Ćulić, G.Grbić, andL.Martać, Annals of the New York Academy of Sciences1048, 427 (2005)
2005
-
[50]
Higuchi, Physica D: Nonlinear Phenomena46, 254 (1990)
T. Higuchi, Physica D: Nonlinear Phenomena46, 254 (1990)
1990
-
[51]
Schreiber and A
T. Schreiber and A. Schmitz, Physical Review Letters 77, 635 (1996), publisher: American Physical Society
1996
-
[52]
Prichard and J
D. Prichard and J. Theiler, Physical Review Letters73, 951 (1994)
1994
-
[53]
Schreiber and A
T. Schreiber and A. Schmitz, Physica D: Nonlinear Phe- nomena142, 346 (2000)
2000
-
[54]
Bevington and D
P. Bevington and D. K. Robinson,Data Reduction and Error Analysis for the Physical Sciences(McGraw-Hill Education, 2003) google-Books-ID: 0poQAQAAIAAJ
2003
-
[55]
A.GuriaandB.Mukhopadhyay,TheAstrophysicalJour- nal980, 77 (2025), publisher: The American Astronom- ical Society
2025
-
[56]
Aggarwal and S
S. Aggarwal and S. Ray, European Journal of Neuro- science62, e70193 (2025)
2025
-
[57]
B. B. Mandelbrot,Fractals and Scaling in Finance (Springer, New York, NY, 1997)
1997
-
[58]
A. Eke, P. Hermán, J. Bassingthwaighte, G. Raymond, D.Percival, M.Cannon, I.Balla, andC.Ikrényi,Pflügers Archiv439, 403 (2000)
2000
-
[59]
Orey, Zeitschrift für Wahrscheinlichkeitstheorie und Verwandte Gebiete15, 249 (1970)
S. Orey, Zeitschrift für Wahrscheinlichkeitstheorie und Verwandte Gebiete15, 249 (1970)
1970
-
[60]
B. B. Mandelbrot and J. W. Van Ness, SIAM Review10, 422 (1968), publisher: Society for Industrial and Applied Mathematics
1968
-
[61]
Weron, Physica A: Statistical Mechanics and its Ap- plications312, 285 (2002)
R. Weron, Physica A: Statistical Mechanics and its Ap- plications312, 285 (2002)
2002
-
[62]
Dieker,Simulation of fractional Brownian motion, Ph.D
T. Dieker,Simulation of fractional Brownian motion, Ph.D. thesis, Columbia University (2004)
2004
-
[63]
Barunik and L
J. Barunik and L. Kristoufek, Physica A: Statistical Me- chanics and its Applications389, 3844 (2010)
2010
-
[64]
T. D. Matteo, T. Aste, and M. M. Dacorogna, Journal of Banking & Finance Risk Measurement,29, 827 (2005)
2005
-
[65]
Barabási and T
A.-L. Barabási and T. Vicsek, Physical Review A44, 2730 (1991), publisher: American Physical Society
1991
-
[66]
Generalized Hurst Exponent,
T. Aste, “Generalized Hurst Exponent,” (2024)
2024
-
[67]
Donoghue, M
T. Donoghue, M. Haller, E. J. Peterson, P. Varma, P. Se- bastian, R. Gao, T. Noto, A. H. Lara, J. D. Wallis, R. T. Knight, A. Shestyuk, and B. Voytek, Nature Neuro- science23, 1655 (2020), number: 12 Publisher: Nature Publishing Group
2020
-
[68]
Aggarwal and S
S. Aggarwal and S. Ray, Cerebral Cortex Communica- tions4, tgad011 (2023)
2023
-
[69]
Narayan and I
R. Narayan and I. Yi, The Astrophysical Journal428, L13 (1994)
1994
-
[70]
R. D. Blandford and R. L. Znajek, Monthly Notices of the Royal Astronomical Society179, 433 (1977)
1977
-
[71]
R. D. Blandford and D. G. Payne, Monthly Notices of the Royal Astronomical Society199, 883 (1982)
1982
-
[72]
Yuan and R
F. Yuan and R. Narayan, Annual Review of Astronomy and Astrophysics52, 529 (2014)
2014
-
[73]
Pathak and B
M. Pathak and B. Mukhopadhyay, The Astrophysical Journal981, 162 (2025), publisher: The American As- tronomical Society
2025
-
[74]
Greiner, J
J. Greiner, J. G. Cuby, and M. J. McCaughrean, Nature 414, 522 (2001)
2001
-
[75]
N. I. Shakura and R. A. Sunyaev, Astronomy and Astro- physics24, 337 (1973)
1973
-
[76]
I. D. Novikov and K. S. Thorne, inBlack Holes (Les Astres Occlus), edited by C. Dewitt and B. S. Dewitt (1973) pp. 343–450
1973
-
[77]
B. B. Mandelbrot, Physica Scripta32, 257 (1985)
1985
-
[78]
S. A. Balbus and P. Henri, The Astrophysical Journal 674, 408 (2008)
2008
discussion (0)
Sign in with ORCID, Apple, or X to comment. Anyone can read and Pith papers without signing in.