Automated Palynological Analysis System: Integrating Deep Metric Learning and U²-Net Detection in Hinfty bright field microscopy
Pith reviewed 2026-05-10 08:07 UTC · model grok-4.3
The pith
An integrated deep learning system automates pollen counting and classification with 95.8% recall and sixfold speedup over manual analysis.
A machine-rendered reading of the paper's core claim, the machinery that carries it, and where it could break.
Core claim
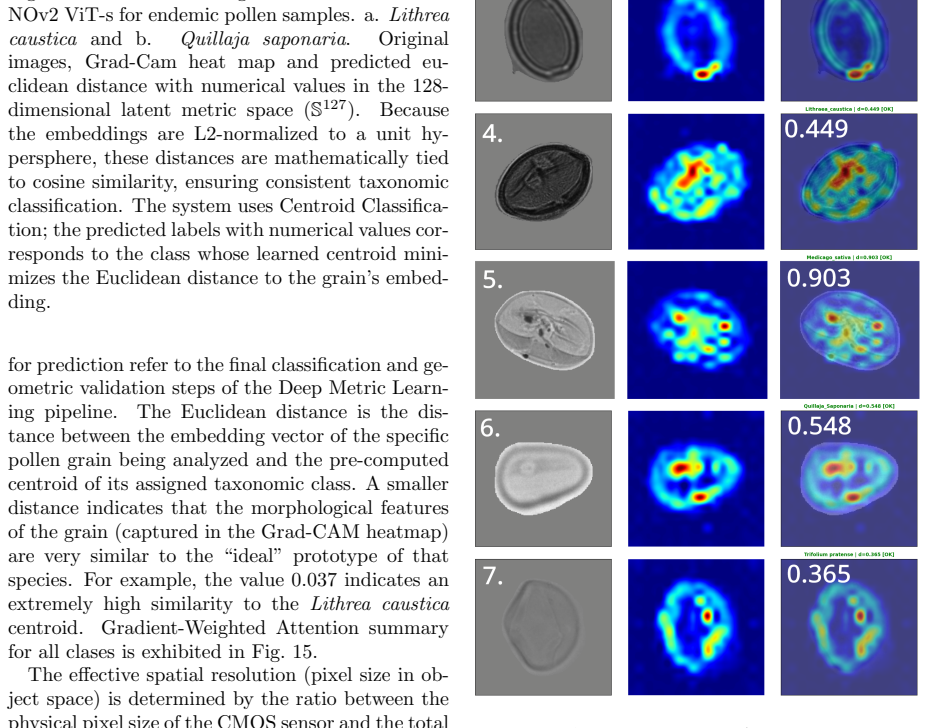
The central discovery is that combining U²-Net for salient object detection with deep metric learning on a DINOv2 backbone, integrated with gradient-weighted attention, enables precise automated counting, classification, and morphological analysis of pollen grains, reaching 95.8% classification recall and a 6x processing speedup compared to manual expert analysis.
What carries the argument
The U²-Net model for detecting salient pollen objects paired with a DINOv2 Vision Transformer trained through deep metric learning for classification, augmented by Gradient-Weighted Attention to annotate diagnostic features.
Load-bearing premise
The models trained on Bio Bio region pollen images will maintain high accuracy when applied to new samples, different imaging conditions, or pollen from other geographic areas.
What would settle it
Collect a test set of pollen images from a different region or under altered microscope settings and measure if the classification recall falls significantly below 95.8%.
Figures


read the original abstract
Traditional melissopalynology is a time-consuming and subjective process, often taking 4-6 hours per sample. We present an automated, high-throughput microscopy system that integrates $H\infty$ robust mechanical control with advanced deep learning pipelines for the precise counting, classification, and morphological analysis of pollen grains from Bio Bio region in south central territory in Chile. Our system employs $U^{2}$-Net for salient object detection and a DINOv2 Vision Transformer backbone trained via Deep Metric Learning for classification. By integrating Gradient-Weighted Attention, the model provides human-interpretable texture and diagnostic feature annotations. The system achieves a 95.8$\%$ classification recall and a 6x processing speedup compared to manual expert analysis.
Editorial analysis
A structured set of objections, weighed in public.
Referee Report
Summary. The manuscript presents an automated palynological analysis system for pollen grains from the Bio Bio region in Chile. It combines H∞ robust mechanical control in bright-field microscopy with U²-Net for salient object detection and a DINOv2 Vision Transformer backbone trained via deep metric learning for classification, with Gradient-Weighted Attention for interpretability. The central claims are a 95.8% classification recall and a 6x processing speedup relative to manual expert analysis.
Significance. If the reported performance is supported by proper validation, the work could meaningfully advance high-throughput automation of melissopalynology, reducing the 4-6 hour manual analysis time and subjectivity. The integration of robust control, modern self-supervised vision backbones, metric learning, and attention-based interpretability is a coherent technical contribution with potential utility in ecology, apiculture, and environmental monitoring.
major comments (3)
- [Methods] Methods section: No dataset size, class distribution, train/test split, or validation protocol (e.g., k-fold, held-out set) is described for the DINOv2 + deep metric learning classifier. Without these, the 95.8% recall cannot be evaluated for generalization versus overfitting.
- [Results] Results section: The 6x speedup claim lacks any description of the timing protocol, hardware, number of samples, or direct comparison to a documented manual workflow, rendering the quantitative advantage unverifiable.
- [Results] No external test set or domain-shift experiments are reported. All evaluation appears to use internal splits from the same Bio Bio imaging distribution; this directly undermines claims of robustness to new geographic regions, illumination changes, or microscope variations under H∞ control.
minor comments (1)
- [Abstract] The abstract and introduction would benefit from a one-sentence definition or reference for H∞ control and U²-Net to aid readers outside the immediate subfield.
Simulated Author's Rebuttal
We thank the referee for the constructive and detailed comments. We address each major point below and will incorporate revisions to improve clarity and verifiability of the results.
read point-by-point responses
-
Referee: [Methods] Methods section: No dataset size, class distribution, train/test split, or validation protocol (e.g., k-fold, held-out set) is described for the DINOv2 + deep metric learning classifier. Without these, the 95.8% recall cannot be evaluated for generalization versus overfitting.
Authors: We agree that these critical details are omitted from the current Methods section. In the revised manuscript we will add a dedicated subsection that reports the total number of images and samples collected from the Bio Bio region, the per-class distribution, the train/test split ratios (including any stratification), and the validation protocol (e.g., k-fold cross-validation or held-out test set) used to compute the 95.8% recall. This addition will allow readers to assess generalization versus overfitting. revision: yes
-
Referee: [Results] Results section: The 6x speedup claim lacks any description of the timing protocol, hardware, number of samples, or direct comparison to a documented manual workflow, rendering the quantitative advantage unverifiable.
Authors: We acknowledge that the timing protocol, hardware platform, number of samples, and explicit comparison to the manual workflow are not described. The revised Results section will include these details: the hardware used for automated processing, the exact measurement protocol, the number of samples timed, and a side-by-side description of the manual expert workflow (4–6 h per sample) to substantiate the 6x speedup claim. revision: yes
-
Referee: [Results] No external test set or domain-shift experiments are reported. All evaluation appears to use internal splits from the same Bio Bio imaging distribution; this directly undermines claims of robustness to new geographic regions, illumination changes, or microscope variations under H∞ control.
Authors: The current evaluation uses internal splits from the Bio Bio dataset acquired under the H∞-controlled bright-field setup; the manuscript does not claim robustness to arbitrary new geographic regions or microscope hardware. To address the concern we will add explicit language in the Discussion clarifying the intended scope (Bio Bio region, controlled imaging conditions) and will discuss potential domain-shift limitations and the role of H∞ control in mitigating illumination and mechanical variations within this setting. revision: yes
Circularity Check
No circularity detected; empirical ML results with no derivation chain
full rationale
The manuscript reports an empirical pipeline (U²-Net detection + DINOv2 + deep metric learning) evaluated on Bio Bio pollen images, claiming 95.8% recall and 6x speedup. No first-principles derivation, uniqueness theorem, or mathematical prediction is presented that could reduce to its own inputs by construction. Performance numbers are standard held-out test metrics from a single-region dataset; they are not fitted parameters renamed as predictions, nor do they rely on self-citation load-bearing steps. The work is self-contained as an applied engineering report rather than a theoretical derivation.
Axiom & Free-Parameter Ledger
free parameters (1)
- Deep learning hyperparameters and training choices
axioms (1)
- domain assumption Deep neural networks trained on the available images can reliably detect and classify pollen grains in H∞ bright-field microscopy from the Bio Bio region.
Reference graph
Works this paper leans on
-
[1]
Machuca, G., Staforelli, J., Rondanelli-Reyes, M., Garces, R., Contreras-Trigo, B., Tapia, J., ... & Coelho, P. (2022). Hyperspectral mi- croscopy technology to detect syrups adul- teration of endemic guindo santo and quil- lay honey using machine-learning tools. Foods, 11(23), 3868
work page 2022
-
[2]
Jofre, R., Tapia, J., Troncoso, J., Staforelli, J., Sanhueza, I., Jara, A., ... & Coelho, P. (2025). YOLOv8-based on-the-fly classifier system for pollen analysis of Guindo Santo (Eucryphia glutinosa) honey and assessment of its monoflorality. Journal of Agriculture and Food Research, 19, 101665
work page 2025
-
[3]
Sevillano, V., & Aznarte, J. L. (2020). Precise pollen classification with deep learning.PLOS ONE,15(4), e0229751
work page 2020
-
[4]
DINOv2: Learning Robust Visual Features without Supervision
Oquab, M., Darcet, T., Moutakanni, T., Vo, H., Szafraniec, M., Khalidov, V., ... & Bo- janowski, P. (2023). DINOv2: Learning ro- bust visual features without supervision.arXiv preprint arXiv:2304.07193. 12 Table 1: Morphological and Texture Metrics for Pollen Identification Pollen Class Size(µm)Area(10 3 px2)Circ.(C)I.C.D.(µ±σ) 1.Acaena s.12.67±1.30 45.2±...
work page internal anchor Pith review Pith/arXiv arXiv 2023
-
[5]
Chefer, H., Gur, S., & Wolf, L. (2021). Trans- former interpretability beyond attention vi- sualization. InProceedings of the IEEE/CVF Conference on Computer Vision and Pattern Recognition(pp. 782-791)
work page 2021
-
[6]
Dosovitskiy, A., Beyer, L., Kolesnikov, A., Weissenborn, D., Zhai, X., Unterthiner, T., ... & Houlsby, N. (2021). An image is worth 16x16 words: Transformers for image recognition at scale. InInternational Conference on Learning Representations
work page 2021
-
[7]
Touvron, H., Cord, M., & J´ egou, H. (2022). DeiT III: Revenge of the ViT. InEuropean Conference on Computer Vision(pp. 516- 533). Springer, Cham
work page 2022
-
[8]
Qin, X., Zhang, Z., Huang, C., Dehghan, M., Zaiane, O. R., & Jagersand, M. (2020). U²- Net: Going deeper with nested U-structure for salient object detection.Pattern Recognition, 106, 107404
work page 2020
-
[9]
Caron, M., Touvron, H., Misra, I., J´ egou, H., Mairal, J., Bojanowski, P., & Joulin, A. (2021). Emerging properties in self-supervised vision transformers. InProceedings of the IEEE/CVF International Conference on Com- puter Vision(pp. 9650-9660)
work page 2021
-
[10]
Musgrave, K., Belongie, S., & Lim, S. N. (2020). A metric learning reality check. InEu- ropean Conference on Computer Vision(pp. 681-699). Springer, Cham
work page 2020
-
[11]
Roth, K., Milbich, T., Sinha, S., Gupta, P., Ommer, B., & Cohen, J. P. (2022). Non-isotropy regularization for proxy-based deep metric learning. InProceedings of the IEEE/CVF Conference on Computer Vision and Pattern Recognition(pp. 7420-7430)
work page 2022
-
[12]
Kim, S., Kim, D., Cho, M., & Kwak, S. (2023). HIER: Metric learning beyond class-level sim- ilarities. InProceedings of the IEEE/CVF Conference on Computer Vision and Pattern Recognition(pp. 11956-11966)
work page 2023
-
[13]
Wang, X., Han, X., Huang, W., Dong, D., & Scott, M. R. (2019). Multi-similarity loss with general pair weighting for deep metric learn- ing. InProceedings of the IEEE/CVF Confer- ence on Computer Vision and Pattern Recog- nition(pp. 5022-5030)
work page 2019
-
[14]
R., Cogswell, M., Das, A., Vedantam, R., Parikh, D., & Batra, D
Selvaraju, R. R., Cogswell, M., Das, A., Vedantam, R., Parikh, D., & Batra, D. (2017). Grad-CAM: Visual explanations from deep networks via gradient-based localization. In Proceedings of the IEEE international confer- ence on computer vision(pp. 618-626)
work page 2017
-
[15]
M., Carva- jal, R., Caba˜ na-Brunod, M., & Otero, M
Poulsen-Silva, E., Gordillo-Fuenzalida, F., Vel´ asquez, P., Llancalahuen, F. M., Carva- jal, R., Caba˜ na-Brunod, M., & Otero, M. C. (2023). Antimicrobial, antioxidant, and anti- inflammatory properties of monofloral honeys from Chile. Antioxidants, 12(9), 1785
work page 2023
-
[16]
Garc´ ıa, S., Troncoso, J. M., & Rondanelli- Reyes, M. (2020). Study of honey according to botanical origin and physicochemical parame- ters in the Biob´ ıo Region, Chile. Chilean jour- nal of agricultural research, 80(4), 675-685
work page 2020
-
[17]
Figueroa-Flores, C., & San-Martin, P. (2023). Deep learning for Chilean native flora classi- fication: a comparative analysis. Frontiers in Plant Science, 14, 1211490
work page 2023
- [18]
-
[19]
Louveaux, J., Maurizio, A., & Vorwohl, G. (1978). Methods of melissopalynology.Bee World,59(4), 139-157
work page 1978
-
[20]
Faegri, K., Kaland, P. E., & Krzywinski, K. (1989). Textbook of pollen analysis
work page 1989
-
[21]
Sohn, Y. J., Barnes, B. M., Howard, L., Sil- ver, R. M., Attota, R., & Stocker, M. T. 13 (2006, March). K¨ ohler illumination for high- resolution optical metrology. In Metrology, In- spection, and Process Control for Microlithog- raphy XX (Vol. 6152, pp. 1236-1244). SPIE
work page 2006
-
[22]
https://www.madcitylabs.com/cfocus.html 14
discussion (0)
Sign in with ORCID, Apple, or X to comment. Anyone can read and Pith papers without signing in.