Does PCA Work for Rough Functional Data?
Pith reviewed 2026-05-09 20:58 UTC · model grok-4.3
The pith
FPCA becomes entirely uninformative for functional data past a critical roughness threshold.
A machine-rendered reading of the paper's core claim, the machinery that carries it, and where it could break.
Core claim
The authors introduce a roughness model that parametrizes the irregularity of functional observations and prove that the bias of the empirical covariance operator undergoes a phase transition: below a critical roughness value the leading eigenfunctions remain consistent for the population ones, while above it they become asymptotically orthogonal to the true signal, rendering FPCA uninformative.
What carries the argument
The roughness model that controls the decay rate of the covariance kernel and induces a quantifiable bias in the empirical eigenstructure.
If this is right
- Diagnostic tests can now check whether computed principal components are still informative for a given dataset.
- Spectral statistics derived from the model supply a basis for goodness-of-fit tests tailored to rough functional data.
- Consistency guarantees for FPCA must be stated relative to the roughness parameter rather than assumed uniformly.
- The phase-transition threshold supplies a practical cutoff for deciding when alternative dimension-reduction methods are required.
Where Pith is reading between the lines
- Analysts working with environmental or climate curves should first estimate roughness before reporting FPCA results.
- The same roughness-induced bias may affect other linear dimension-reduction techniques in functional data analysis.
- Extensions of the model could yield similar transition points for nonlinear methods such as functional kernel PCA.
Load-bearing premise
The proposed roughness model accurately represents the irregularity present in real functional datasets and the phase transition occurs under conditions relevant to practice.
What would settle it
A simulation or real-data experiment in which the leading FPCA components remain informative for roughness levels that the model predicts should already make them orthogonal to the true eigenfunctions.
Figures




read the original abstract
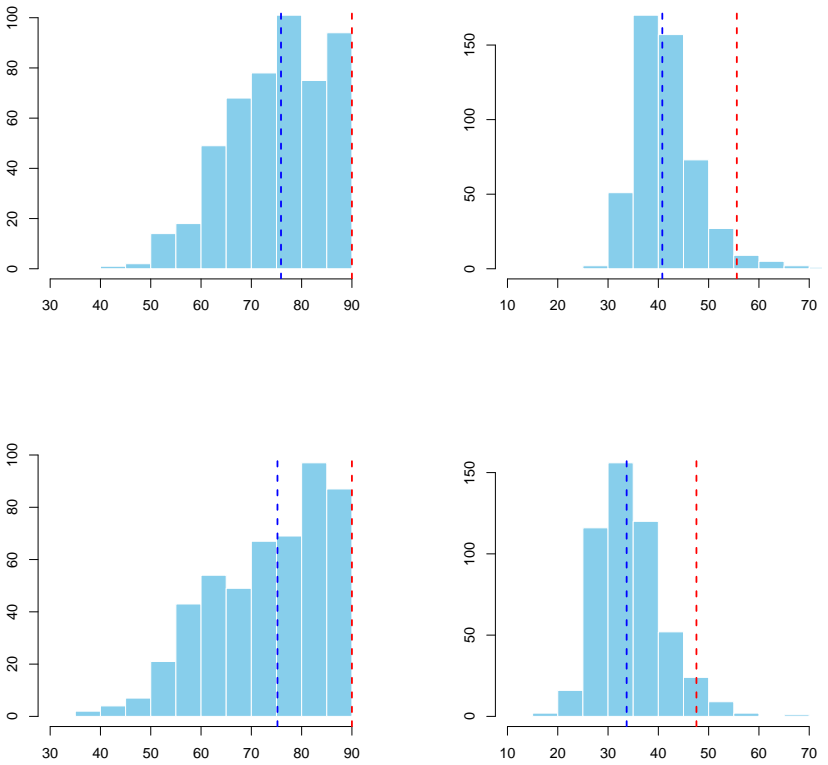
Functional data analysis is concerned with the analysis of infinite-dimensional data functions. Functional principal component analysis (FPCA) is a key method to obtain finite-dimensional summaries. Consistency of FPCA has been theoretically established for sufficiently regular data functions. However, empirical evidence shows that FPCA can become severely inconsistent when the underlying functions are too rough. This paper provides the first theoretical explanation for this phenomenon. We propose a model that explicitly captures the roughness of functional data and allows us to quantify the resulting bias of FPCA, depending on the functional roughness. The model undergoes a phase transition marking the point at which FPCA becomes entirely uninformative. Based on these probabilistic results, we discuss diagnostic tests for informative principal components. As an additional contribution, we derive results on spectral statistics that may serve as a foundation for goodness-of-fit tests for rough functional data. Mathematically, our approach combines recent advances in random matrix theory and generic chaining with tools from FDA. We illustrate the effects of roughness on FPCA using simulations, as well as climate and environmental datasets.
Editorial analysis
A structured set of objections, weighed in public.
Referee Report
Summary. The paper proposes a roughness model for functional data that captures irregularity and induces a phase transition in the behavior of functional principal component analysis (FPCA). It claims to provide the first theoretical quantification of FPCA bias as a function of roughness, identifies a threshold beyond which FPCA becomes entirely uninformative, derives associated spectral statistics, and proposes diagnostic tests for informative principal components. The approach combines random matrix theory with generic chaining bounds and is illustrated through simulations plus climate and environmental datasets.
Significance. If the phase transition and bias results are robust, the work supplies a much-needed theoretical account of why FPCA can fail on irregular functional data, which is frequently observed in practice. The explicit roughness parameterization and the resulting sharp threshold constitute a concrete advance over existing consistency theory that assumes sufficient smoothness. The additional spectral statistics may seed new goodness-of-fit procedures, and the real-data illustrations demonstrate relevance to environmental statistics.
major comments (2)
- [§3] The central phase-transition claim (abstract and §3) is derived under the specific covariance structure and eigenvalue decay induced by the roughness parameter. Because the threshold is obtained by combining RMT for the empirical covariance with chaining bounds on the roughness process, it is unclear whether the transition remains sharp or even exists when the model is replaced by standard roughness classes (e.g., fractional Brownian motion with different Hurst indices or non-stationary kernels) that better match localized irregularity in climate data.
- [§5] The diagnostic tests for informative principal components (abstract and §5) rely on the spectral statistics derived from the same roughness model. No power analysis or cross-validation against held-out real datasets is reported to show that the tests reliably flag the uninformative regime; the simulation evidence may therefore overstate practical utility when the true roughness deviates from the assumed global parameter.
minor comments (2)
- [§2] Notation for the roughness parameter and the associated eigenvalue decay rate should be introduced once and used consistently; several passages in the model section switch between equivalent but visually distinct symbols.
- [§6] The real-data examples would benefit from an explicit statement of how the roughness parameter was estimated from each dataset and whether the estimated values lie near the reported phase-transition threshold.
Simulated Author's Rebuttal
We thank the referee for the detailed and constructive report. We address the two major comments point by point below, indicating the revisions we will make to the manuscript.
read point-by-point responses
-
Referee: [§3] The central phase-transition claim (abstract and §3) is derived under the specific covariance structure and eigenvalue decay induced by the roughness parameter. Because the threshold is obtained by combining RMT for the empirical covariance with chaining bounds on the roughness process, it is unclear whether the transition remains sharp or even exists when the model is replaced by standard roughness classes (e.g., fractional Brownian motion with different Hurst indices or non-stationary kernels) that better match localized irregularity in climate data.
Authors: We agree that the phase-transition threshold is obtained for the specific roughness model introduced in the paper, which produces a particular eigenvalue decay rate through the global roughness parameter. This parameterization was chosen to permit sharp results via random matrix theory and generic chaining. While the qualitative mechanism (eigenvalues of the signal being dominated by roughness-induced noise) is expected to be robust, we do not claim universality across all roughness classes. In the revision we will add a dedicated paragraph in §3 discussing the scope of the model and its relation to fractional Brownian motion and non-stationary kernels. We will also include new simulation experiments that replace the model covariance with fBM kernels of varying Hurst indices and report the resulting empirical phase-transition behavior. revision: partial
-
Referee: [§5] The diagnostic tests for informative principal components (abstract and §5) rely on the spectral statistics derived from the same roughness model. No power analysis or cross-validation against held-out real datasets is reported to show that the tests reliably flag the uninformative regime; the simulation evidence may therefore overstate practical utility when the true roughness deviates from the assumed global parameter.
Authors: We accept that the current validation of the diagnostic tests is limited to simulations under the assumed model and does not include power curves or held-out real-data checks. In the revised manuscript we will add a power analysis of the proposed tests under the roughness model (varying sample size and roughness level) and perform a cross-validation exercise on the climate and environmental datasets by randomly partitioning each series into training and test portions. These additions will be reported in §5 and the supplementary material. revision: yes
Circularity Check
No significant circularity in the derivation chain.
full rationale
The paper introduces an explicit roughness model as an external probabilistic construction (not derived from or fitted to the target FPCA bias). It then applies independent tools—random matrix theory for the empirical covariance and generic chaining bounds—to derive the phase transition and bias quantification as mathematical consequences. No step reduces a prediction or first-principles result to a fitted parameter, self-definition, or self-citation chain; the transition threshold is a derived property of the model rather than an input. Real-data illustrations and diagnostic tests are presented as applications, not as anchors that close a circular loop. This is the standard non-circular case of model-based analysis.
Axiom & Free-Parameter Ledger
free parameters (1)
- roughness parameter
Reference graph
Works this paper leans on
-
[1]
Al-Ghattas, O., J. Chen, and D. Sanz-Alonso (2025). Sharp concentration of simple random tensors. Information and Inference: A Journal of the IMA\/ 14\/ (4), iaaf029
work page 2025
-
[2]
Aue, A., G. Rice, and O. Sönmez (2018). Detecting and dating structural breaks in functional data without dimension reduction. Journal of the Royal Statistical Society: Series B (Statistical Methodology)\/ 80\/ (3), 509--529
work page 2018
-
[3]
Baik, J., G. Ben Arous, and S. P\'ech\'e (2005). Phase transition of the largest eigenvalue for nonnull complex sample covariance matrices. The Annals of Probability\/ 33\/ (5), 1643--1697
work page 2005
-
[4]
Bosq, D. (2000). Linear P rocesses in F unction S paces . Springer
work page 2000
- [5]
-
[6]
Dehling, H. (1983). Limit theorems for sums of weakly dependent B anach space valued random variables. Zeitschrift für Wahrscheinlichkeitstheorie und verwandte Gebiete\/ 63 , 393--432
work page 1983
-
[7]
Dette, H., K. Kokot, and S. Volgushev (2020). Testing relevant hypotheses in functional time series via self-normalization. Journal of the Royal Statistical Society Series B: Statistical Methodology\/ 82 , 629--–660
work page 2020
-
[8]
Klimadaten D eutschland: Historisches T emperaturarchiv
Deutscher Wetterdienst (2025). Klimadaten D eutschland: Historisches T emperaturarchiv
work page 2025
- [9]
-
[10]
Fremdt, S., L. Horváth, P. Kokoszka, and J. G. Steinebach (2014). Functional data analysis with increasing number of projections. Journal of Multivariate Analysis\/ 124 , 313--332
work page 2014
-
[11]
Hadjipantelis, P. Z. and H.-G. Müller (Eds.) (2018). Handbook of Big Data Analytics . Springer
work page 2018
-
[12]
Hoffmann-J rgensen, J., T. M. Liggett, and J. Neveu (1977). Ecole d' E t \'e de probabilit \'e s de Saint-Flour VI, 1976 , Volume 598 of Lecture Notes in Mathematics . Springer
work page 1977
-
[13]
Horv \'a th, L. and P. Kokoszka (2012). Inference for F unctional D ata with A pplications . New York: Springer
work page 2012
-
[14]
Hsing, T. and R. Eubank (2015). Theoretical F oundations of F unctional D ata A nalysis, with an I ntroduction to L inear O perators . Wiley
work page 2015
-
[15]
Koltchinskii, V. and K. Lounici (2017). Concentration inequalities and moment bounds for sample covariance operators. Bernoulli\/ 23\/ (1), 110–133
work page 2017
-
[16]
Kuelbs, J. (1973). The invariance principle for B anach space valued random variables. Journal of Multivariate Analysis\/ 3 , 161--172
work page 1973
-
[17]
Onatski, A. (2009). Testing hypotheses about the number of factors in large factor models. Econometrica\/ 77\/ (5), 1447--1479
work page 2009
-
[18]
Ramsay, J. O. and B. W. Silverman (2005). Functional D ata A nalysis . Springer
work page 2005
-
[19]
Shah, D. A., E. D. D. Wolf, P. A. Paul, and L. V. Madden (2024). Functional data analysis of weather variables linked to fusarium head blight epidemics in the U nited S tates. Phytopathology\/
work page 2024
-
[20]
Wang, J.-L., J.-M. Chiou, and H.-G. M\" u ller (2016). Review of functional data analysis. Annual Review of Statistics and Its Application\/ 3 , 257--295
work page 2016
-
[21]
Bai, Z. and J. W. Silverstein (2010). Spectral analysis of large dimensional random matrices , Volume 20. Springer
work page 2010
-
[22]
Bai, Z. and J. Yao (2012). On sample eigenvalues in a generalized spiked population model. Journal of Multivariate Analysis\/ 106 , 167--177
work page 2012
-
[23]
Ding, X. and F. Yang (2021). Spiked separable covariance matrices and principal components . The Annals of Statistics\/ 49\/ (2), 1113 -- 1138
work page 2021
-
[24]
El Karoui, N. (2007). Tracy--widom limit for the largest eigenvalue of a large class of complex sample covariance matrices. The Annals of Probability\/ 35\/ (2), 663--714
work page 2007
-
[25]
Knowles, A. and J. Yin (2014). The outliers of a deformed W igner matrix. Annals of Probability\/ 42\/ (5), 1980--2031
work page 2014
-
[26]
Knowles, A. and J. Yin (2017). Anisotropic local laws for random matrices. Probability Theory and Related Fields\/ 169 , 257--352
work page 2017
-
[27]
Koltchinskii, V. and K. Lounici (2017). Normal approximation and confidence regions for the spectral projectors of sample covariance. Annals of Statistics\/ 45\/ (1), 121–157
work page 2017
-
[28]
Lee, J. O. and K. Schnelli (2016). Tracy–Widom distribution for the largest eigenvalue of real sample covariance matrices with general population . The Annals of Applied Probability\/ 26\/ (6), 3786 -- 3839
work page 2016
-
[29]
Li, Z., F. Han, and J. Yao (2020). Asymptotic joint distribution of extreme eigenvalues and trace of large sample covariance matrix in a generalized spiked population model. The Annals of Statistics\/ 48\/ (6), 3138--3160
work page 2020
-
[30]
Tracy, C. A. and H. Widom (1994). Level-spacing distributions and the airy kernel. Communications in Mathematical Physics\/ 159 , 151--174
work page 1994
-
[31]
Yao, J., S. Zheng, and Z. Bai (2015). Sample covariance matrices and high-dimensional data analysis. Cambridge UP, New York\/
work page 2015
- [32]
-
[33]
J. Hoffmann-Jørgensen , title =. Studia Mathematica , volume =. 1974 , doi =
work page 1974
-
[34]
D. A. Shah and E. D. De Wolf and P. A. Paul and L. V. Madden , title =. Phytopathology , year =
- [35]
- [36]
-
[37]
S. Fremdt and L. Horváth and P. Kokoszka and J. G. Steinebach , title =. Journal of Multivariate Analysis , volume =. 2014 , doi =
work page 2014
- [38]
-
[39]
R. Vershynin , title =. Compressed Sensing: Theory and Applications , editor =
-
[40]
El Karoui, N. , title =. The Annals of Probability , year =. doi:10.1214/009117906000000917 , publisher =
-
[41]
V. Gelardi and J. Godard and D. Paleressompoulle and N. Claidiere and A. Barrat , title =. Proceedings of the Royal Society A: Mathematical, Physical and Engineering Sciences , volume =
-
[42]
Random Matrices: Theory and Applications , volume=
Spiked sample covariance matrices with possibly multiple bulk components , author=. Random Matrices: Theory and Applications , volume=. 2021 , publisher=
work page 2021
-
[43]
Spectral analysis of large dimensional random matrices , author=. 2010 , publisher=
work page 2010
-
[44]
Cambridge UP, New York , year=
Sample covariance matrices and high-dimensional data analysis , author=. Cambridge UP, New York , year=
-
[45]
The Annals of Applied Probability , number =
Ji Oon Lee and Kevin Schnelli , title =. The Annals of Applied Probability , number =
-
[46]
Journal of Multivariate Analysis , volume=
On sample eigenvalues in a generalized spiked population model , author=. Journal of Multivariate Analysis , volume=. 2012 , publisher=
work page 2012
-
[47]
The Annals of Statistics , volume=
Asymptotic joint distribution of extreme eigenvalues and trace of large sample covariance matrix in a generalized spiked population model , author=. The Annals of Statistics , volume=. 2020 , publisher=
work page 2020
-
[48]
The Annals of Statistics , volume=
Asymptotic independence of spiked eigenvalues and linear spectral statistics for large sample covariance matrices , author=. The Annals of Statistics , volume=. 2022 , publisher=
work page 2022
-
[49]
IEEE Transactions on Information Theory , volume=
Improved estimation of eigenvalues and eigenvectors of covariance matrices using their sample estimates , author=. IEEE Transactions on Information Theory , volume=. 2008 , publisher=
work page 2008
-
[50]
The Annals of Statistics , number =
Xiucai Ding and Fan Yang , title =. The Annals of Statistics , number =. 2021 , doi =
work page 2021
-
[51]
N. Eagle and A. Pentland , title =. Personal and Ubiquitous Computing , volume =
-
[52]
Proceedings of the IEEE , volume=
PCA in high dimensions: An orientation , author=. Proceedings of the IEEE , volume=. 2018 , publisher=
work page 2018
-
[53]
G. H. Davis and M. C. Crofoot and D. R. Farine , title =. Animal Behaviour , volume =
-
[54]
J. P. Capitanio , title =. American Journal of Primatology , volume =
- [55]
-
[56]
Econometrics and Statistics , year =
Data Segmentation Algorithms: Univariate Mean Change and Beyond , author =. Econometrics and Statistics , year =
-
[57]
International Conference on Machine Learning , pages=
Weak detection of signal in the spiked wigner model , author=. International Conference on Machine Learning , pages=. 2019 , organization=
work page 2019
-
[58]
IEEE Transactions on Information Theory , year=
Detection problems in the spiked random matrix models , author=. IEEE Transactions on Information Theory , year=
-
[59]
The Annals of Statistics , number =
Ahmed El Alaoui and Florent Krzakala and Michael Jordan , title =. The Annals of Statistics , number =. 2020 , doi =
work page 2020
-
[60]
Sequential Analysis: Some Classical Problems and New Challenges , author =. Statistica Sinica , volume =
- [61]
- [62]
-
[63]
Journal of Time Series Analysis , year =
Structural Breaks in Time Series , author =. Journal of Time Series Analysis , year =
-
[64]
X. Chen and K. Kato , title =. Probability Theory and Related Fields , volume =. 2020 , doi =
work page 2020
-
[65]
J. G. Electronic Journal of Statistics , pages =
- [66]
-
[67]
F. A. Moricz and R. J. Serfling and W. F. Stout , title =. The Annals of Probability , year =
-
[68]
Kutta, T. and Jach, A. and Kokoszka, P. , title =. Journal of Time Series Analysis , year =
-
[69]
A. W. van der Vaart and J. A. Wellner. Weak Convergence and Empirical Processes. With Applications to Statistics
- [70]
-
[71]
P. J. Huber and E. M. Ronchetti. Robust S tatistics. 2009
work page 2009
-
[72]
Communications in Mathematical Physics , volume=
On orthogonal and symplectic matrix ensembles , author=. Communications in Mathematical Physics , volume=. 1996 , publisher=
work page 1996
- [73]
-
[74]
Communications in Mathematical Physics , volume=
Level-spacing distributions and the Airy kernel , author=. Communications in Mathematical Physics , volume=. 1994 , publisher=
work page 1994
-
[75]
J. Baik and G. B. Arous and S. P. The Annals of Probability , number =. 2005 , doi =
work page 2005
-
[76]
Tracy, Craig A. and Widom, Harold. The Distribution of the Largest Eigenvalue in the G aussian Ensembles: = 1, 2, 4. Calogero---Moser--- Sutherland Models. 2000
work page 2000
-
[77]
Erd. Universality of. Russian Mathematical Surveys , volume=. 2011 , publisher=
work page 2011
-
[78]
M. Capitaine and C. Donati-Martin and D. F. The Annals of Probability , number =. 2009 , doi =
work page 2009
-
[79]
A. Onatski and M. J. Moreira and M. Hallin , title =. The Annals of Statistics , number =. 2014 , doi =
work page 2014
-
[80]
I. M. Johnstone and A. Onatski , title =. The Annals of Statistics , number =. 2020 , doi =
work page 2020
discussion (0)
Sign in with ORCID, Apple, or X to comment. Anyone can read and Pith papers without signing in.