Urban Flood Observations (UFO): A hand-labeled training and validation dataset of post-flood inundation
Pith reviewed 2026-05-08 12:11 UTC · model grok-4.3
The pith
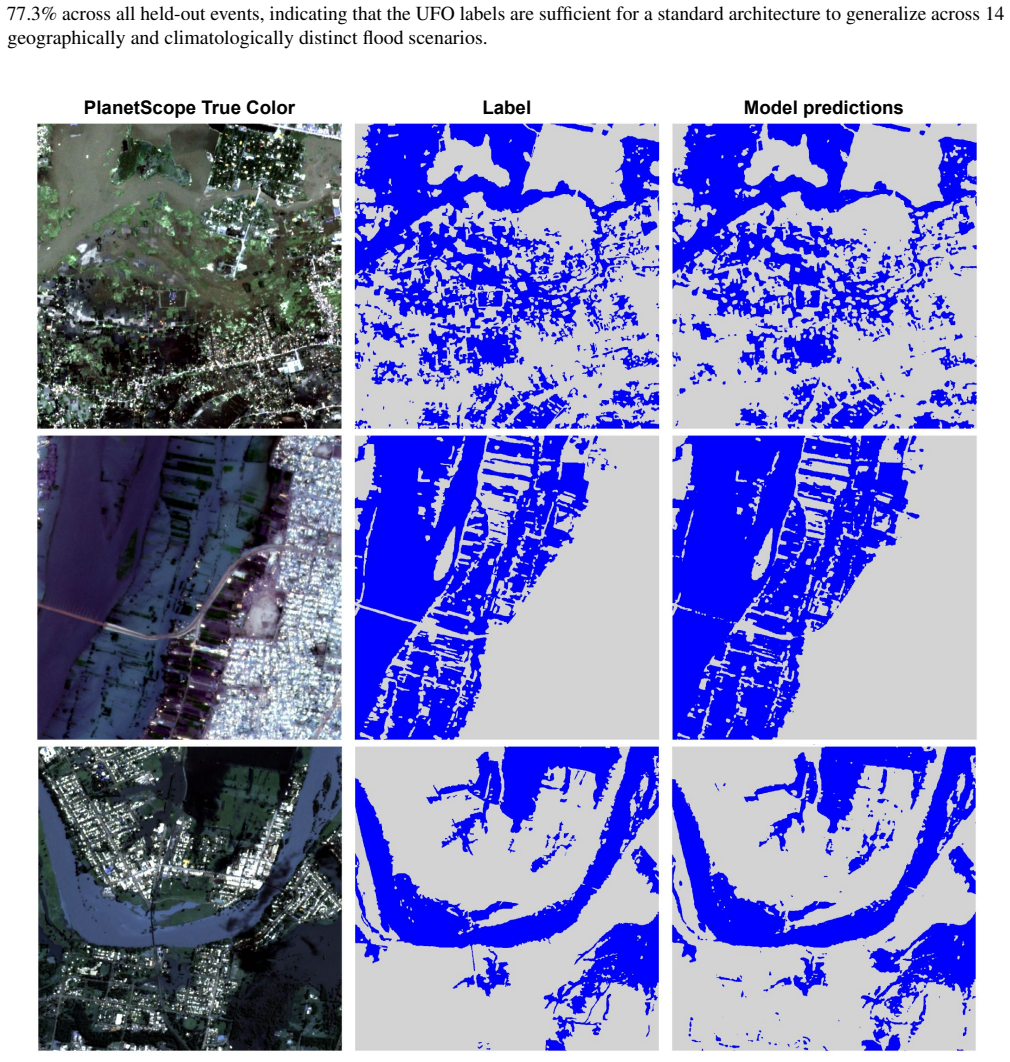
A hand-labeled dataset of 215 satellite image chips enables machine learning models to map urban flood inundation at 77.3 mean IoU.
A machine-rendered reading of the paper's core claim, the machinery that carries it, and where it could break.
Core claim
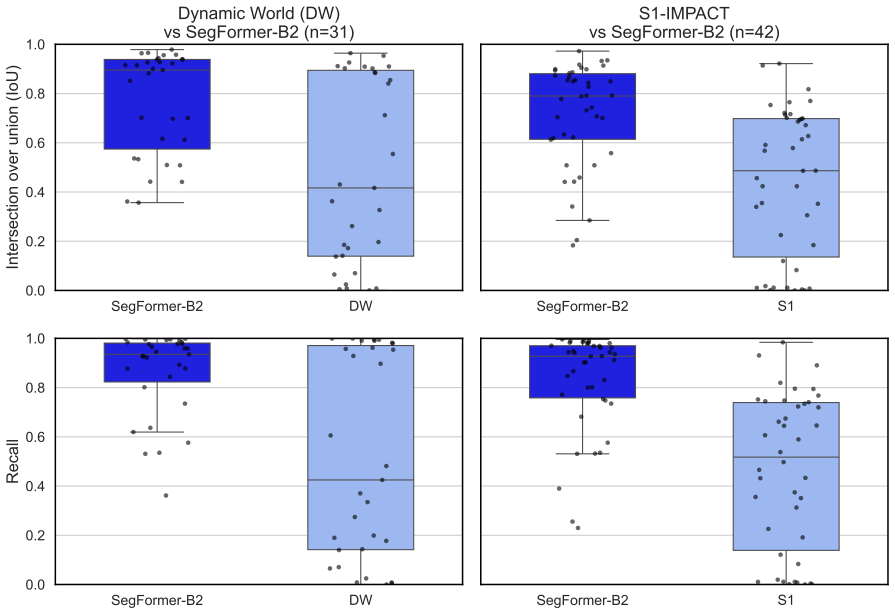
The central claim is that the UFO dataset of 215 globally distributed, expert-labeled image chips from 14 flood events, annotated for visible surface water in two classes, supports training of a segmentation model that achieves 77.3 mean IoU via leave-one-event-out cross-validation and shows that two widely used surface water products achieve only 44.1 and 48.1 IoU on the same chips.
What carries the argument
The UFO hand-labeled dataset of 1024x1024 PlanetScope image chips with binary 'inundated' and 'non-inundated' annotations, used to train and validate segmentation models through leave-one-event-out cross-validation.
Load-bearing premise
Expert hand-labeling accurately identifies all visible surface water without significant errors from shadows, vegetation, or urban structures, and the 14 selected events with their chips capture sufficient diversity to support generalizable models.
What would settle it
Testing a model trained on UFO against an independent collection of PlanetScope urban flood images labeled by a separate group of experts yields a mean IoU below 60.
Figures




read the original abstract
Urban flooding affects lives and infrastructure worldwide. Mapping inundation in complex urban environments from satellite imagery remains challenging due to limited spatial resolution, infrequent acquisitions, and cloud cover. We present Urban Flood Observations (UFO), a global, hand-labeled dataset of post-flood inundation in diverse urban settings. UFO comprises 215 image chips (1024 by 1024 pixels) from 14 flood events between 2017 and 2021, derived from 3 m PlanetScope imagery. Each chip is annotated with two classes: 'inundated' (all visible surface water, including floodwater and pre-existing water bodies (permanent or seasonal)) and 'non-inundated'. To demonstrate the dataset's utility, we trained a segmentation model using leave-one-event-out cross-validation, achieving a mean Intersection over Union (IoU) of 77.3. We also used UFO to evaluate two widely used surface water products, the Sentinel-1-based NASA IMPACT model and Google's 10 m Dynamic World water class, which yielded IoUs of 44.1 and 48.1, respectively. UFO is publicly available to support the development and validation of urban inundation mapping methods.
Editorial analysis
A structured set of objections, weighed in public.
Referee Report
Summary. The manuscript presents the Urban Flood Observations (UFO) dataset: 215 hand-labeled 1024×1024 pixel chips from 3 m PlanetScope imagery across 14 flood events (2017–2021). Chips are annotated into two classes—inundated (all visible surface water, including permanent bodies) and non-inundated. Utility is shown via leave-one-event-out cross-validation of a segmentation model (mean IoU 77.3) and by benchmarking two existing products (NASA IMPACT IoU 44.1; Dynamic World IoU 48.1). The dataset is released publicly.
Significance. If the hand labels prove reliable, UFO would fill a documented gap in high-resolution urban inundation training data and enable more rigorous benchmarking than current coarse products allow. The leave-one-event-out protocol and public release are concrete strengths that support reproducibility and community use.
major comments (2)
- [Methods/§3] Dataset construction (Methods/§3): No labeling protocol, number of annotators, inter-annotator agreement statistics, or independent validation (higher-resolution optical/SAR or field data) is reported. Because the central claim—that UFO supplies reliable ground truth for training and benchmarking—rests on label accuracy, the absence of these details leaves open the possibility that reported IoUs partly reflect label consistency rather than true inundation detection, especially given known urban confounds (shadows, dark roofs, wet pavement).
- [Results/§4] Results (§4): The leave-one-event-out mean IoU of 77.3 is presented without per-event breakdowns, confusion matrices, or error analysis stratified by urban density or event type. This makes it impossible to verify whether performance generalizes across the claimed diversity of 14 events or is driven by a subset of easier scenes.
minor comments (2)
- [Abstract] Abstract: The sentence describing the two benchmark products should explicitly name the products and their resolutions for immediate clarity.
- [Dataset description] The manuscript would benefit from a table summarizing event dates, locations, and number of chips per event to allow readers to assess geographic and temporal coverage.
Simulated Author's Rebuttal
We thank the referee for their constructive comments, which identify important areas for improving the transparency and rigor of the UFO dataset description. We respond to each major comment below, indicating planned revisions where feasible.
read point-by-point responses
-
Referee: [Methods/§3] Dataset construction (Methods/§3): No labeling protocol, number of annotators, inter-annotator agreement statistics, or independent validation (higher-resolution optical/SAR or field data) is reported. Because the central claim—that UFO supplies reliable ground truth for training and benchmarking—rests on label accuracy, the absence of these details leaves open the possibility that reported IoUs partly reflect label consistency rather than true inundation detection, especially given known urban confounds (shadows, dark roofs, wet pavement).
Authors: We agree that the original manuscript omitted key details on annotation. The revised version will expand §3 with a full description of the labeling protocol and the number of annotators. However, inter-annotator agreement statistics were not computed during the original process, and independent validation against higher-resolution optical/SAR or field data was not performed for these retrospective events. We will explicitly note these as limitations and discuss potential impacts from urban confounds such as shadows and wet pavement. revision: partial
-
Referee: [Results/§4] Results (§4): The leave-one-event-out mean IoU of 77.3 is presented without per-event breakdowns, confusion matrices, or error analysis stratified by urban density or event type. This makes it impossible to verify whether performance generalizes across the claimed diversity of 14 events or is driven by a subset of easier scenes.
Authors: We agree that additional granularity is warranted. In the revision we will add a table of per-event IoU scores from the leave-one-event-out validation, an overall confusion matrix, and a qualitative error analysis of common failure modes. Although quantitative urban-density stratification is not available, we will group events by qualitative characteristics (e.g., flood type and setting) and report any observed performance differences to help readers assess generalization across the 14 events. revision: yes
- Inter-annotator agreement statistics, as they were not calculated during dataset creation.
- Independent validation with higher-resolution optical/SAR or field data, which was not available for the selected events.
Circularity Check
No circularity: empirical dataset release with standard ML validation
full rationale
The paper describes creation of a hand-labeled dataset from PlanetScope imagery and its use to train a segmentation model under leave-one-event-out cross-validation, reporting mean IoU of 77.3 against the same labels on held-out events, plus direct evaluation of two external surface-water products on the same labels. These steps are self-contained empirical procedures: the labels function as the defined ground truth for the reported metrics, with no equations, fitted parameters renamed as predictions, self-citation load-bearing arguments, or uniqueness claims that reduce the central results to their own inputs by construction. The work contains no derivation chain that collapses into tautology.
Axiom & Free-Parameter Ledger
axioms (1)
- domain assumption Hand-labeling by experts provides accurate ground truth for visible surface water in satellite imagery of urban floods.
Reference graph
Works this paper leans on
-
[1]
Hammond, M. J., Chen, A. S., Djordjevi´c, S., Butler, D. & Mark, O. Urban flood impact assessment: A state-of-the-art review.Urban Water J.12, 14–29, 10.1080/1573062X.2013.857421 (2015)
-
[2]
Ren, D., Wang, Y ., Wang, G. & Liu, L. Rising trends of global precipitable water vapor and its correlation with flood frequency.Geod. Geodyn.14, 355–367, 10.1016/j.geog.2022.12.001 (2023)
-
[3]
Zhang, W., Villarini, G., Vecchi, G. A. & Smith, J. A. Urbanization exacerbated the rainfall and flooding caused by hurricane Harvey in Houston.Nature563, 384–388 (2018)
work page 2018
-
[4]
Zhou, Q., Leng, G., Su, J. & Ren, Y . Comparison of urbanization and climate change impacts on urban flood volumes: Importance of urban planning and drainage adaptation.Sci. The Total. Environ.658, 24–33, 10.1016/j.scitotenv.2018.12.184 (2019). 12/15
-
[5]
Tellman, B.et al.Satellite imaging reveals increased proportion of population exposed to floods.Nature596, 80–86, 10.1038/s41586-021-03695-w (2021)
-
[6]
Dottori, F.et al.Increased human and economic losses from river flooding with anthropogenic warming.Nat. Clim. Chang. 8, 781–786 (2018)
work page 2018
-
[7]
Rentschler, J., Salhab, M. & Jafino, B. A. Flood exposure and poverty in 188 countries.Nat. Commun.13, 3527, 10.1038/s41467-022-30727-4 (2022)
-
[8]
Amitrano, D., Di Martino, G., Di Simone, A. & Imperatore, P. Flood detection with sar: A review of techniques and datasets.Remote. Sens.16, 656, 10.3390/rs16040656 (2024)
-
[9]
Brown, K. M., Hambidge, C. H. & Brownett, J. M. Progress in operational flood mapping using satellite synthetic aperture radar (sar) and airborne light detection and ranging (lidar) data.Prog. Phys. Geogr.40, 196–214 (2016)
work page 2016
-
[10]
Munawar, H. S., Hammad, A. W. & Waller, S. T. Remote sensing methods for flood prediction: A review.Sensors22, 960 (2022)
work page 2022
-
[11]
Schumann, G. J.-P. Breakthroughs in satellite remote sensing of floods.Front. Remote. Sens.4, 10.3389/frsen.2023.1280654 (2024). Publisher: Frontiers
-
[12]
Mason, D. C., Dance, S. L. & Cloke, H. L. Floodwater detection in urban areas using Sentinel-1 and WorldDEM data.J. Appl. Remote. Sens.15, 032003, 10.1117/1.JRS.15.032003 (2021)
-
[13]
Bentivoglio, R., Isufi, E., Jonkman, S. N. & Taormina, R. Deep learning methods for flood mapping: a review of existing applications and future research directions.Hydrol. Earth Syst. Sci.26, 4345–4378, 10.5194/hess-26-4345-2022 (2022)
-
[14]
V o, T. T., Hu, L., Xue, L., Li, Q. & Chen, S. Urban effects on local cloud patterns.Proc. Natl. Acad. Sci.120, e2216765120 (2023)
work page 2023
-
[15]
Geophys.10.1007/s10712-026-09935-w (2026)
Tarpanelli, A., Massari, C., Revilla-Romero, B.et al.The potential of eo data for enhanced flood monitoring and forecasting: A consortium assessment.Surv. Geophys.10.1007/s10712-026-09935-w (2026)
-
[16]
Olthof, I. & Svacina, N. Testing urban flood mapping approaches from satellite and in-situ data collected during 2017 and 2019 events in eastern canada.Remote. Sens.12, 3141, 10.3390/rs12193141 (2020)
-
[17]
Ardila, J. P., Laurila, P., Kourkouli, P. & Strong, S. Persistent monitoring and mapping of floods globally based on the iceye sar imaging constellation. InIGARSS 2022 – 2022 IEEE International Geoscience and Remote Sensing Symposium, 6296–6299, 10.1109/IGARSS46834.2022.9883587 (2022)
-
[18]
Within-Camera Multilayer Perceptron DVS Denoising,
Giezendanner, J.et al.Inferring the Past: A Combined CNN-LSTM Deep Learning Framework To Fuse Satellites for Historical Inundation Mapping. In2023 IEEE/CVF Conference on Computer Vision and Pattern Recognition Workshops (CVPRW), 2155–2165, 10.1109/CVPRW59228.2023.00209 (2023)
-
[19]
Peng, B., Meng, Z., Huang, Q. & Wang, C. Patch similarity convolutional neural network for urban flood extent mapping using bi-temporal satellite multispectral imagery.Remote. Sens.11, 2492, 10.3390/rs11212492 (2019)
-
[20]
Zhao, J.et al.Urban-aware U-Net for large-scale urban flood mapping using multitemporal Sentinel-1 intensity and interferometric coherence.IEEE Transactions on Geosci. Remote. Sens.60, 1–14, 10.1109/TGRS.2022.3199036 (2022)
-
[21]
Bonafilia, D., Tellman, B., Anderson, T. & Issenberg, E. Sen1Floods11: A Georeferenced Dataset to Train and Test Deep Learning Flood Algorithms for Sentinel-1. In2020 IEEE/CVF Conference on Computer Vision and Pattern Recognition Workshops (CVPRW), 835–845, 10.1109/CVPRW50498.2020.00113 (IEEE, Seattle, W A, USA, 2020)
-
[22]
a global multi-temporal satellite dataset for rapid flood mapping
Bountos, N. I.et al.Kuro siwo: 33 billion m2 under the water. a global multi-temporal satellite dataset for rapid flood mapping (2023). ArXiv:2311.12056
-
[23]
Notarangelo, N., Wirion, C. & van Winsen, F. Sturm-flood: a curated dataset for deep learning-based flood extent mapping leveraging sentinel-1 and sentinel-2 imagery.Big Earth Data9, 412–438, 10.1080/20964471.2025.2458714 (2025)
-
[24]
Matosak, B. M., Gella, G. W. & Lang, S. Senforflood: A new global dataset for flooded area detection.Int. Arch. Pho- togramm. Remote. Sens. Spatial Inf. Sci.XLVIII-M-7-2025, 97–102, 10.5194/isprs-archives-XLVIII-M-7-2025-97-2025 (2025)
work page doi:10.5194/isprs-archives-xlviii-m-7-2025-97-2025 2025
- [25]
-
[26]
Reports11, 7249, 10.1038/s41598-021-86650-z (2021)
Mateo-Garcia, G.et al.Towards global flood mapping onboard low cost satellites with machine learning.Sci. Reports11, 7249, 10.1038/s41598-021-86650-z (2021). 13/15
-
[27]
Montello, F., Arnaudo, E. & Rossi, C. MMFlood: a multimodal dataset for flood delineation from satellite imagery.IEEE Access10, 122753–122762, 10.1109/ACCESS.2022.3205419 (2022)
-
[28]
Wieland, M. & Martinis, S. S1S2-water: a satellite-based dataset for water mapping using Sentinel-1 and Sentinel-2. ISPRS J. Photogramm. Remote. Sens.184, 13–28, 10.1016/j.isprsjprs.2022.01.021 (2024)
-
[29]
Chen, W.et al.Sen2gf3floods: A benchmark multi-source flood dataset with dual-temporal and active learning annotation. Sci. Data13, 540, 10.1038/s41597-026-06929-6 (2026)
-
[30]
Gahlot, S., Gurung, I., Molthan, A., Maskey, M. & Ramasubramanian, M. Flood extent data for machine learning, 10.34911/rdnt.ebk43x (2021)
-
[31]
Hansch, R.et al.SpaceNet 8-The detection of flooded roads and buildings. InProceedings of the IEEE/CVF Conference on Computer Vision and Pattern Recognition Workshops, 1400–1405, 10.1109/CVPRW56347.2022.00153 (2022)
-
[32]
Rahnemoonfar, M.et al.Floodnet: A high resolution aerial imagery dataset for post flood scene understanding.IEEE Access9, 89644–89654, 10.1109/ACCESS.2021.3090981 (2021)
-
[33]
Zhang, Y .et al.A new multi-source remote sensing image sample dataset with high resolution for flood area extraction: Gf-floodnet.Int. J. Digit. Earth16, 2522–2554, 10.1080/17538947.2023.2230978 (2023)
-
[34]
Fawakherji, M., Blay, J., Anokye, M., Hashemi-Beni, L. & Dorton, J. DeepFlood for inundated vegetation high-resolution dataset for accurate flood mapping and segmentation.Sci. Data12, 271, 10.1038/s41597-025-04554-3 (2025)
-
[35]
Zhang, Z.et al.Assessing inundation semantic segmentation models trained on high- versus low-resolution labels using FloodPlanet, a manually labeled multi-sourced high-resolution flood dataset.J. Remote. Sens.5, 0575, 10.34133/ remotesensing.0575 (2025)
work page 2025
-
[36]
Mukherjee, R.et al.Urban Flood Observations (UFO): A hand-labeled training and validation dataset of post-flood inundation, 10.5281/zenodo.15238469 (2025). Dataset. 37.Floodlist – floods and flooding news from around the world (2024)
-
[37]
Rajib, A.et al.A call for consistency and integration in global surface water estimates.Environ. Res. Lett.19, 021002, 10.1088/1748-9326/ad1722 (2024). Publisher: IOP Publishing
-
[38]
Venter, Z. S., Barton, D. N., Chakraborty, T., Simensen, T. & Singh, G. Global 10 m land use land cover datasets: A comparison of dynamic world, worldcover and esri land cover.Remote. Sens.14, 4101 (2022)
work page 2022
-
[39]
Pekel, J.-F., Cottam, A., Gorelick, N. & Belward, A. S. High-resolution mapping of global surface water and its long-term changes.Nature540, 418–422, 10.1038/nature20584 (2016). 41.Zanaga, D.et al.ESA WorldCover 10 m 2020 v100, 10.5281/zenodo.5571936 (2021). 42.Labelbox. Labelbox (2025). Online; accessed 20 May 2025. 43.Brown, C. F.et al.Dynamic World, Ne...
-
[40]
Karra, K.et al.Global Land Use/Land Cover with Sentinel 2 and Deep Learning. In2021 IEEE International Geoscience and Remote Sensing Symposium (IGARSS), 4704–4707, 10.1109/IGARSS47720.2021.9553499 (IEEE, 2021)
-
[41]
Frazier, A. E. & Hemingway, B. L. A Technical Review of Planet Smallsat Data: Practical Considerations for Processing and Using PlanetScope Imagery.Remote. Sens.13, 3930, 10.3390/rs13193930 (2021)
-
[42]
InAdvances in Neural Information Processing Systems, 12077–12090 (2021)
Xie, E.et al.SegFormer: Simple and Efficient Design for Semantic Segmentation with Transformers. InAdvances in Neural Information Processing Systems, 12077–12090 (2021)
work page 2021
-
[43]
Hydrol.639, 10.1016/j.jhydrol.2024.131609 (2024)
Jiang, H.et al.Cropland inundation mapping in a mountain dominated region based on multi-resolution remotely sensed imagery and active learning for semantic segmentation.J. Hydrol.639, 10.1016/j.jhydrol.2024.131609 (2024)
-
[44]
Paul, S. & Ganju, S. Flood segmentation on sentinel-1 SAR imagery with semi-supervised learning.arXiv preprint arXiv:2107.08369(2021). Acknowledgments We would like to thank Simone Holliday, Patrick Hellmann, Natasha Rapp, and Linn Ji for their assistance with labeling. The creation of the UFO dataset was supported by a NASA Terrestrial Hydrology Program ...
discussion (0)
Sign in with ORCID, Apple, or X to comment. Anyone can read and Pith papers without signing in.