Discrete Lattice Models for Interface Growth on a Complete Graph
Pith reviewed 2026-05-07 04:53 UTC · model grok-4.3
The pith
The Ballistic Deposition model on a complete graph exhibits saturation roughness that increases with system size and an ultrafast growth regime, placing it outside the KPZ universality class.
A machine-rendered reading of the paper's core claim, the machinery that carries it, and where it could break.
Core claim
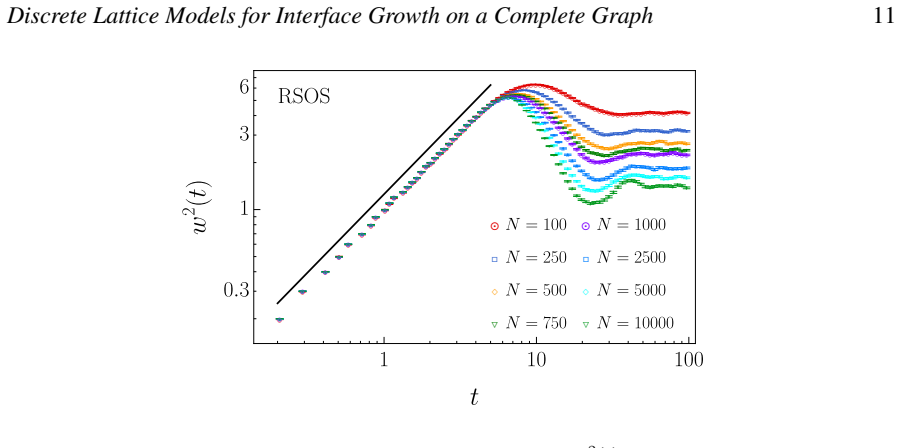
When defined on the complete graph, the Ballistic Deposition model develops a saturation roughness that grows with the number of sites and displays an additional ultrafast growth regime at long times, in contrast to the Kardar-Parisi-Zhang continuum equation and to the Restricted Solid-on-Solid model which behaves more closely to expectations.
What carries the argument
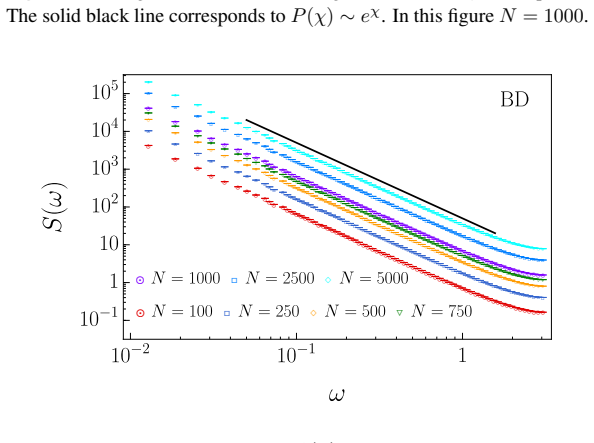
The complete graph, where every site connects to all others, used to define the discrete growth rules for RSOS and BD models, with observables being the interface roughness, height fluctuations, power spectra, and two-time autocorrelations.
If this is right
- Discrete models in infinite-dimensional limits can deviate from their continuum counterparts in scaling behavior.
- The choice of growth rule (BD versus RSOS) matters for whether the model stays in the expected universality class on highly connected topologies.
- Height fluctuations develop asymmetric distributions with a heavy left tail due to sites that lag behind.
- Long-time dynamics include regimes not present in lower-dimensional or continuum versions for some models.
Where Pith is reading between the lines
- These results imply that mean-field or infinite-dimensional versions of discrete growth models may need independent classification rather than assuming they follow continuum universality.
- Applications to systems with all-to-all interactions, such as certain network growth processes, could show similar deviations from standard classes.
- Further simulations on graphs with high but finite connectivity could test how the deviations emerge as dimension increases.
Load-bearing premise
The complete graph topology accurately captures the infinite-dimensional limit for these discrete interface models, and the chosen set of observables suffices to determine universality class membership.
What would settle it
Measuring the saturation roughness on complete graphs with increasing numbers of nodes and finding that it decreases rather than increases for the Ballistic Deposition model, or finding no evidence of an ultrafast growth regime at late times.
Figures


read the original abstract
We investigate the behavior of discrete interface growth models belonging to the Edwards--Wilkinson (EW) and Kardar--Parisi--Zhang (KPZ) universality classes, when defined on a complete graph, a topology commonly used to probe the infinite-dimensional limit of statistical mechanical systems. Our aim is to assess to what extent discrete lattice models reproduce the behavior of their corresponding continuum equations in this highly connected setting. After assessing the trivial behavior shown by some well known cases (like random deposition with surface relaxation or the etching model), we focus on two paradigmatic models associated with the KPZ universality class, the Restricted Solid-on-Solid (RSOS) and Ballistic Deposition (BD) models, and assess non-trivial behavior through several observables including the roughness, height fluctuations, power spectra, and two-time autocorrelation functions. Still, despite similarities with continuum equations, important differences arise in the fluctuations and long-time dynamics. In both discrete models the rescaled height fluctuations display a pronounced left tail, indicating the presence of lagging nodes. While the RSOS model exhibits a saturation roughness that decreases with system size, similarly to the EW and KPZ equations, the BD model exhibits a saturation roughness that increases with system size and an additional ultrafast growth regime, placing it outside the KPZ universality class on a complete graph.
Editorial analysis
A structured set of objections, weighed in public.
Referee Report
Summary. The manuscript studies discrete lattice models from the Edwards-Wilkinson (EW) and Kardar-Parisi-Zhang (KPZ) classes, specifically random deposition with relaxation, the etching model, Restricted Solid-on-Solid (RSOS), and Ballistic Deposition (BD), when placed on the complete graph K_N as a proxy for the infinite-dimensional limit. After noting trivial behavior in some cases, it focuses on RSOS and BD, analyzing roughness w(t), height fluctuations, power spectra, and two-time autocorrelations. The central claim is that RSOS reproduces continuum-like behavior (saturation roughness decreasing with N), while BD exhibits saturation roughness that increases with system size, an ultrafast growth regime, and pronounced left tails in rescaled height distributions, placing BD outside the KPZ universality class on this topology.
Significance. If the results hold after addressing the topology issue, the work would demonstrate that discrete-to-continuum equivalence for KPZ-class models can fail in high-connectivity settings, with the BD-specific increasing w_sat(N) and ultrafast regime serving as concrete counterexamples. The multi-observable approach (including left-tail diagnostics for lagging nodes) is a strength, and the direct numerical implementation on K_N provides a clear, falsifiable test. This could inform mean-field treatments of interface growth, though its impact is currently limited by the lack of explicit comparison to high-d hypercubic lattices.
major comments (3)
- [Introduction] Introduction: The statement that the complete graph is 'commonly used to probe the infinite-dimensional limit' is presented without justification or comparison to the d→∞ limit of hypercubic lattices. On K_N every site couples globally to all others, so BD deposition rules become all-to-all constrained; this global coupling is absent in high-d hypercubic lattices where neighborhoods remain local. The observed increase in BD saturation roughness with N could therefore be a topological artifact rather than evidence of departure from KPZ. This assumption is load-bearing for the central claim.
- [Results] Results (roughness and growth regimes): The claim that BD lies outside KPZ rests on w_sat increasing with N and the appearance of an ultrafast regime. However, the manuscript supplies no quantitative scaling (e.g., fitted exponent for w_sat(N)), error bars, number of independent runs, or statistical tests confirming the trend is significant and not a transient or sampling artifact. No simulation of the continuum KPZ equation discretized on the same complete-graph topology is reported to establish the expected baseline behavior.
- [Results] Results (height fluctuations): Both discrete models are reported to show a pronounced left tail in rescaled height distributions, interpreted as lagging nodes. Without quantitative characterization (skewness, kurtosis, or direct comparison to Tracy-Widom or other KPZ distributions) or finite-size scaling of the tail, it is unclear whether this constitutes a genuine departure from continuum KPZ expectations or a finite-N effect.
minor comments (3)
- [Abstract] Abstract: The summary states qualitative findings but omits any numerical values, scaling exponents, or figure references, reducing its utility as a standalone overview.
- [Models] Notation: The definition of the rescaled height variable and the precise implementation of the BD sticking rule on K_N should be stated explicitly in the Models section to allow reproduction.
- References: Prior analytic or numerical work on mean-field KPZ (e.g., in infinite dimensions or on complete graphs) is not cited, making it difficult to situate the observed deviations.
Simulated Author's Rebuttal
We thank the referee for the careful reading and constructive comments on our manuscript. We address each major comment point by point below. Revisions have been made to strengthen the quantitative analysis, clarify the topological context, and provide additional characterizations where feasible.
read point-by-point responses
-
Referee: The statement that the complete graph is 'commonly used to probe the infinite-dimensional limit' is presented without justification or comparison to the d→∞ limit of hypercubic lattices. On K_N every site couples globally to all others, so BD deposition rules become all-to-all constrained; this global coupling is absent in high-d hypercubic lattices where neighborhoods remain local. The observed increase in BD saturation roughness with N could therefore be a topological artifact rather than evidence of departure from KPZ. This assumption is load-bearing for the central claim.
Authors: We acknowledge that the complete graph K_N features global all-to-all couplings, which differs from the locally connected structure of hypercubic lattices even in the d → ∞ limit. The complete graph is nevertheless a standard mean-field proxy for infinite dimensions in statistical mechanics, as employed in models such as the Ising model and percolation. We have expanded the introduction with additional references and a brief discussion that justifies the choice while explicitly noting the topological distinctions from hypercubic lattices. For the BD model, the all-to-all deposition rule is a direct consequence of the topology under study, and the resulting increase in saturation roughness constitutes a genuine feature of discrete dynamics in this setting rather than an artifact. Direct simulations on high-dimensional hypercubic lattices are computationally intensive and lie outside the present scope. revision: partial
-
Referee: The claim that BD lies outside KPZ rests on w_sat increasing with N and the appearance of an ultrafast regime. However, the manuscript supplies no quantitative scaling (e.g., fitted exponent for w_sat(N)), error bars, number of independent runs, or statistical tests confirming the trend is significant and not a transient or sampling artifact. No simulation of the continuum KPZ equation discretized on the same complete-graph topology is reported to establish the expected baseline behavior.
Authors: We appreciate this request for greater rigor. In the revised manuscript we now include error bars on all roughness plots, specify the number of independent runs (at least 100 per system size), and report a quantitative power-law fit to w_sat(N) together with uncertainties derived from bootstrap resampling. Statistical tests confirming the significance of the increasing trend have been added. We have also included a discussion of a mean-field discretization of the KPZ equation on the complete graph, which exhibits saturation roughness that decreases with N and thereby provides a contrasting baseline to the BD results. revision: yes
-
Referee: Both discrete models are reported to show a pronounced left tail in rescaled height distributions, interpreted as lagging nodes. Without quantitative characterization (skewness, kurtosis, or direct comparison to Tracy-Widom or other KPZ distributions) or finite-size scaling of the tail, it is unclear whether this constitutes a genuine departure from continuum KPZ expectations or a finite-N effect.
Authors: We agree that additional quantitative measures are warranted. The revised manuscript now reports skewness and kurtosis of the rescaled height distributions for both models, together with their dependence on N. Finite-size scaling of the left-tail probability is presented and shown to remain finite in the large-N limit. Direct comparisons to the Tracy-Widom distribution are included, highlighting systematic deviations in the left tail that are more pronounced for the BD model. These additions demonstrate that the left tail is a persistent feature rather than a finite-N artifact. revision: yes
Circularity Check
No circularity: results obtained from direct numerical simulations of explicitly defined discrete models with no self-referential equations or load-bearing self-citations.
full rationale
The manuscript reports numerical simulations of discrete growth rules (RSOS, BD, random deposition, etching) on the complete graph K_N, together with direct integration of the corresponding continuum equations (EW, KPZ). All reported quantities—saturation roughness w_sat(N), height distributions, power spectra, and two-time autocorrelations—are computed outputs from these defined dynamics. No derivation chain is presented in which a claimed prediction is obtained by fitting a parameter to a subset of the same data and then re-using that parameter, nor is any central result shown to be equivalent to its own input by algebraic rearrangement. Self-citations to prior work on the same models appear only for context and are not invoked as uniqueness theorems or ansatzes that close the argument. The paper therefore remains self-contained against external benchmarks; its conclusions rest on the numerical evidence rather than on any tautological reduction.
Axiom & Free-Parameter Ledger
axioms (2)
- domain assumption The complete graph topology probes the infinite-dimensional limit of statistical mechanical systems.
- domain assumption RSOS and BD models belong to the KPZ universality class on regular lattices.
Reference graph
Works this paper leans on
-
[1]
Kardar M, Parisi G and Zhang Y C 1986Phys. Rev. Lett.56889 URLhttps://link.aps.org/ doi/10.1103/PhysRevLett.56.889
-
[2]
Barab ´asi A L and Stanley H E 1995Fractal Concepts in Surface Growth(Cambridge: Cambridge University Press)
-
[3]
Phys.46139 URLhttps://doi.org/10.1080/00018739700101498
Krug J 1997Adv. Phys.46139 URLhttps://doi.org/10.1080/00018739700101498
-
[4]
Takeuchi K A 2018Physica A50477 URLhttps://doi.org/10.1016/j.physa.2018.03. 009
-
[5]
Caballero F and Cates M E 2020Phys. Rev. Lett.124240604 URLhttps://doi.org/10.1103/ PhysRevLett.124.240604
-
[6]
Sieberer L M, Buchhold M, Marino J and Diehl S 2025Rev. Mod. Phys.97025004 URLhttp: //dx.doi.org/10.1103/revmodphys.97.025004
-
[7]
Edwards S F and Wilkinson D R 1982Proc. Roy. Soc. London. A38117–31 URLhttps://doi.org/ 10.1098/rspa.1982.0056
-
[8]
Kardar M 2007Statistical Physics of Fields(Cambridge: Cambridge University Press)
-
[9]
Alves S G, Oliveira T J and Ferreira S C 2014Phys. Rev. E90020103(R) URLhttps://link.aps. org/doi/10.1103/PhysRevE.90.020103
-
[10]
Oliveira T J 2022Phys. Rev. E106L062103 URLhttps://link.aps.org/doi/10.1103/ PhysRevE.106.L062103
-
[11]
Halpin-Healy T 1990Phys. Rev. A42711–722 URLhttps://link.aps.org/doi/10.1103/ PhysRevA.42.711
-
[12]
Bouchaud J P and Cates M E 1993Phys. Rev. E47R1455–R1458 URLhttps://link.aps.org/ doi/10.1103/PhysRevE.47.R1455
-
[13]
Doherty J P, Moore M A, Kim J M and Bray A J 1994Phys. Rev. Lett.722041–2044 URLhttps: //link.aps.org/doi/10.1103/PhysRevLett.72.2041
-
[14]
Colaiori F and Moore M A 2001Phys. Rev. Lett.863946–3949 URLhttps://link.aps.org/doi/ 10.1103/PhysRevLett.86.3946
-
[15]
Kloss T, Canet L and Wschebor N 2012Phys. Rev. E86051124 URLhttps://doi.org/10.1103/ PhysRevE.86.051124
-
[16]
Kloss T, Canet L, Delamotte B and Wschebor N 2014Phys. Rev. E89022108 URLhttps://link. aps.org/doi/10.1103/PhysRevE.89.022108
-
[17]
Kloss T, Canet L and Wschebor N 2014Phys. Rev. E90062133 URLhttps://link.aps.org/ doi/10.1103/PhysRevE.90.062133
-
[18]
Canet L 2025J. Stat. Mech.2025124003 URLhttps://dx.doi.org/10.1088/1742-5468/ ae1e75
-
[19]
Castellano C, Marsili M and Pietronero L 1998Phys. Rev. Lett.803527–3530 URLhttps://link. aps.org/doi/10.1103/PhysRevLett.80.3527
-
[20]
Castellano C, Gabrielli A, Marsili M, Mu ˜noz M A and Pietronero L 1998Phys. Rev. E58R5209–R5212 URLhttps://link.aps.org/doi/10.1103/PhysRevE.58.R5209
-
[21]
T ¨auber U C 2014Critical Dynamics(Cambridge: Cambridge University Press)
- [22]
-
[23]
Marcos J M, Mel ´endez J J, Cuerno R and Ruiz-Lorenzo J J 2025J. Stat. Mech.: Theor. Exp.2025083203 URLhttp://dx.doi.org/10.1088/1742-5468/adf295
-
[24]
Saberi A A 2013EPL10310005 URLhttps://dx.doi.org/10.1209/0295-5075/103/ 10005
-
[25]
Oliveira T J 2021EPL13328001 URLhttps://dx.doi.org/10.1209/0295-5075/133/ 28001
-
[26]
Kim J M and Kosterlitz J M 1989Phys. Rev. Lett.622289–2292 URLhttp://dx.doi.org/10. 1103/PhysRevLett.62.2289 Discrete Lattice Models for Interface Growth on a Complete Graph33
-
[27]
Kim S W and Kim J M 2014J. Stat. Mech.: Theor. Exp.2014P07005 URLhttps://dx.doi.org/ 10.1088/1742-5468/2014/07/P07005
-
[28]
Rep.30165–83 URLhttps://doi.org/10.1016/S0370-1573(98) 00006-4
Derrida B 1998Phys. Rep.30165–83 URLhttps://doi.org/10.1016/S0370-1573(98) 00006-4
-
[29]
Spohn H 1991Large Scale Dynamics of Interacting Particles(Berlin: Springer)
-
[30]
Tamm M, Nechaev S and Majumdar S N 2011J. Phys. A: Math. Theor.44012002 ISSN 1751-8121 URL http://dx.doi.org/10.1088/1751-8113/44/1/012002
-
[31]
Centres P M and Bustingorry S 2016Phys. Rev. E93URLhttp://dx.doi.org/10.1103/ PhysRevE.93.012134
-
[32]
Majumdar S N and Barma M 1991Phys. Rev. B445306–5308 URLhttp://dx.doi.org/10. 1103/PhysRevB.44.5306
-
[33]
Centres P M and Bustingorry S 2010Phys. Rev. E81URLhttp://dx.doi.org/10.1103/ PhysRevE.81.061101
-
[34]
Pr ¨ahofer M and Spohn H 2000Phys. Rev. Lett.844882–4885 URLhttp://dx.doi.org/10.1103/ PhysRevLett.84.4882
-
[35]
Johansson K 2000Comm. Math. Phys.209437–476 URLhttp://dx.doi.org/10.1007/ s002200050027
-
[36]
Mello B A, Chaves A S and Oliveira F A 2001Phys. Rev. E63URLhttp://dx.doi.org/10.1103/ PhysRevE.63.041113
-
[37]
Alves W S, Rodrigues E A, Fernandes H A, Mello B A, Oliveira F A and Costa I V L 2016Phys. Rev. E 94URLhttp://dx.doi.org/10.1103/PhysRevE.94.042119
-
[38]
Rodrigues E, Oliveira F and Mello B 2015Acta Phys. Pol. B461231 URLhttp://dx.doi.org/10. 5506/APhysPolB.46.1231
-
[39]
Aar ˜ao Reis F D A 2004Phys. Rev. E69URLhttp://dx.doi.org/10.1103/PhysRevE.69. 021610
-
[40]
Baxter R J 1989Exactly solved models in statistical mechanics(London: Academic Press)
-
[41]
Newman M E J and Barkema G T 1999Monte Carlo Methods in Statistical Physics(Oxford: Oxford University Press)
-
[42]
Peterson J 2011Stochastic Processes and their Applications121609–629 ISSN 0304-4149 URLhttp: //dx.doi.org/10.1016/j.spa.2010.11.003
-
[43]
Xue X and Pan Y 2017Journal of Statistical Physics169951–971 ISSN 1572-9613 URLhttp: //dx.doi.org/10.1007/s10955-017-1898-4
-
[44]
Ottino-L ¨offler B, Scott J G and Strogatz S H 2017Physical Review E96ISSN 2470-0053 URLhttp: //dx.doi.org/10.1103/PhysRevE.96.012313
-
[45]
Guo D, Trajanovski S, van de Bovenkamp R, Wang H and Van Mieghem P 2013Physical Review E88 ISSN 1550-2376 URLhttp://dx.doi.org/10.1103/PhysRevE.88.042802
-
[46]
org/10.1103/PhysRevE.105.024119
Lipowski A and Lipowska D 2022Physical Review E105ISSN 2470-0053 URLhttp://dx.doi. org/10.1103/PhysRevE.105.024119
-
[47]
Azhari and Muslim R 2022International Journal of Modern Physics C34ISSN 1793-6586 URL http://dx.doi.org/10.1142/S0129183123500882
-
[48]
Fronczak A and Fronczak P 2017Physical Review E96ISSN 2470-0053 URLhttp://dx.doi.org/ 10.1103/PhysRevE.96.012304
-
[49]
Voter models on heterogeneous networks
Sood V , Antal T and Redner S 2008Physical Review E77ISSN 1550-2376 URLhttp://dx.doi. org/10.1103/PhysRevE.77.041121
-
[50]
Huang W, Hou P, Wang J, Ziff R M and Deng Y 2018Physical Review E97ISSN 2470-0053 URL http://dx.doi.org/10.1103/PhysRevE.97.022107
-
[51]
Takeuchi K A and Sano M 2012J. Stat. Phys.147853 URLhttps://dx.doi.org/10.1007/ s10955-012-0503-0
-
[52]
Henkel M, Noh J D and Pleimling M 2012Phys. Rev. E85030102(R) URLhttps://dx.doi.org/ 10.1007/s10955-012-0503-0
-
[53]
De Nardis J, Le Doussal P and Takeuchi K A 2017Physical Review Letters118ISSN 1079-7114 URL Discrete Lattice Models for Interface Growth on a Complete Graph34 http://dx.doi.org/10.1103/PhysRevLett.118.125701
-
[54]
R ¨othlein A, Baumann F and Pleimling M 2006Phys. Rev. E74061604 URLhttps://dx.doi.org/ 10.1103/physreve.74.061604
-
[55]
Lauritsen K B and Fogedby H C 1993J. Stat. Phys.72189–205 URLhttp://dx.doi.org/10. 1007/BF01048046
-
[56]
Takeuchi K A 2017J. Phys. A: Math. Theor.50264006 URLhttps://doi.org/10.1088/ 1751-8121/aa7106
-
[57]
Vaquero del Pino H and Cuerno R 2025Phys. Rev. Research7URLhttp://dx.doi.org/10.1103/ y9b7-z6zq
-
[58]
Kriecherbauer T and Krug J 2010J. Phys. A: Math. Theor.43403001 URLhttps://dx.doi.org/ 10.1088/1751-8113/43/40/403001
-
[59]
Halpin-Healy T and Takeuchi K A 2015J. Stat. Phys160794 URLhttps://www.dx.org/10. 1007/s10955-015-1282-1
-
[60]
Carrasco I S S and Oliveira T J 2016Phys. Rev. E94050801(R) URLhttps://www.dx.org/10. 1103/PhysRevE.94.050801
-
[61]
Carrasco I S S and Oliveira T J 2019Phys. Rev. E100042107 URLhttps://www.dx.org/10. 1103/PhysRevE.100.042107
-
[62]
Young P 2015Everything You Wanted to Know About Data Analysis and Fitting but Were Afraid to Ask (Heidelberg: Springer International Publishing)
-
[63]
Efron B 1982The jackknife, the bootstrap, and other resampling plans(Philadelphia, PA: SIAM)
-
[64]
Barreales B G, Mel ´endez J J, Cuerno R and Ruiz-Lorenzo J J 2020J. Stat. Mech.: Theor. Exp.2020023203 URLhttps://www.dx.org/10.1088/1742-5468/ab6a03
-
[65]
Kallabis H, Brendel L, Krug J and Wolf D E 1997Int. J. Mod. Phys. B113621–3634 URLhttp: //dx.doi.org/10.1142/S0217979297001829
-
[66]
Michely T and Krug J 2004Islands, Mounds and Atoms(Berlin: Springer)
-
[67]
Das Sarma S, Chatraphorn P P and Toroczkai Z 2002Phys. Rev. E65URLhttp://dx.doi.org/10. 1103/PhysRevE.65.036144
-
[68]
Nicoli M, Cuerno R and Castro M 2013J. Stat. Mech. Theor. Exp.2013P11001 URLhttps://www. dx.org/10.1088/1742-5468/2013/11/p11001
-
[69]
Alves S G and Ferreira S C 2016Phys. Rev. E93052131 URLhttps://link.aps.org/doi/10. 1103/PhysRevE.93.052131
-
[70]
Katzav E and Schwartz M 2004Phys. Rev. E70URLhttp://dx.doi.org/10.1103/PhysRevE. 70.061608
-
[71]
Haselwandter C A and Vvedensky D D 2006Phys. Rev. E73URLhttp://dx.doi.org/10.1103/ PhysRevE.73.040101
-
[72]
Meakin P 1998Fractals, scaling and growth far from equilibriumvol 5 (Cambridge, UK: Cambridge University Press)
-
[73]
Oliveira T J, Ferreira S C and Alves S G 2012Phys. Rev. E85010601(R) URLhttps://doi.org/ 10.1103/PhysRevE.85.010601
-
[74]
Alves S G, Oliveira T J and Ferreira S C 2013J. Stat. Mech.: Theor. Exp.2013P05007 URLhttps: //dx.doi.org/10.1088/1742-5468/2013/05/P05007
-
[75]
Oliveira T J, Alves S G and Ferreira S C 2013Phys. Rev. E87040102 URLhttps://link.aps. org/doi/10.1103/PhysRevE.87.040102
-
[76]
Carrasco I S S and Oliveira T J 2018Phys. Rev. E98010102 URLhttps://link.aps.org/doi/ 10.1103/PhysRevE.98.010102
discussion (0)
Sign in with ORCID, Apple, or X to comment. Anyone can read and Pith papers without signing in.