Agent-Based Modeling of Low-Emission Fertilizer Adoption for Dairy Farm Decarbonisation using Empirical Farm Data
Pith reviewed 2026-05-07 16:27 UTC · model grok-4.3
The pith
An agent-based model of 295 Irish dairy farms reproduces observed low-emission fertilizer adoption trajectories with R² of 0.979.
A machine-rendered reading of the paper's core claim, the machinery that carries it, and where it could break.
Core claim
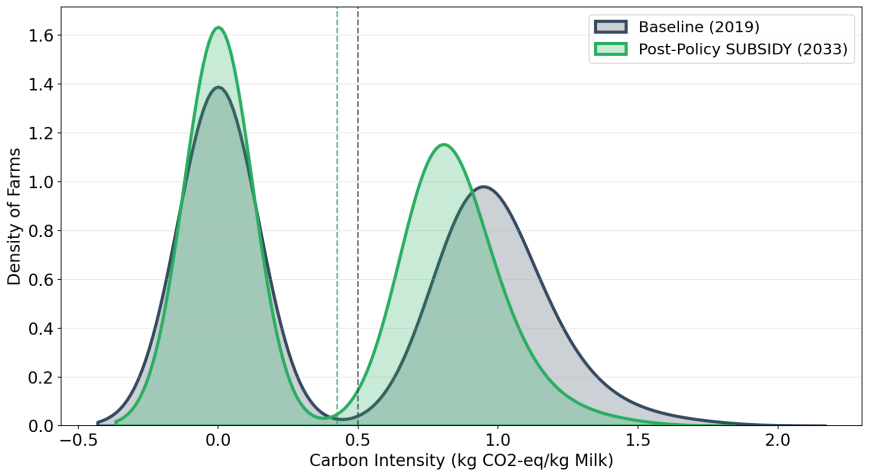
The agent-based model, built on empirical data from 295 Irish dairy farms, represents farm communication via a social network and sets adoption probabilities from social contagion, farm-scale traits, and policy interventions. It reproduces observed adoption trajectories with R² = 0.979 and RMSE = 0.0274, and passes a Kolmogorov-Smirnov test against empirical data (D = 0.2407, p < 0.001). Adoption follows a logistic curve consistent with Rogers' diffusion theory and saturates near 91 percent. The framework then estimates sectoral emissions abatement and private-social cost trade-offs by treating decarbonization as a socio-technical diffusion process.
What carries the argument
The agent-based model with an explicit social network for peer influence and discussion groups, where each farm's adoption probability is driven by social contagion, farm characteristics, and policy inputs such as subsidies and carbon taxes.
If this is right
- Subsidies and carbon taxes can be varied inside the model to quantify their separate effects on adoption speed and total emissions abatement.
- The logistic diffusion pattern implies that early policy support can shift the whole sector toward saturation within roughly 15 years.
- Monte Carlo runs allow planners to bound uncertainty in cumulative abatement and cost trade-offs before any real policy is launched.
- The in silico laboratory can test the robustness of mitigation strategies to changes in network density or farm heterogeneity.
Where Pith is reading between the lines
- The same social-contagion structure could be reused for modeling uptake of other farm practices such as methane inhibitors or cover cropping.
- Strengthening discussion groups might substitute for part of the financial incentive needed to reach high adoption.
- Adding external shocks such as feed-price spikes or new regulations would make the 15-year projections more realistic for real policy use.
Load-bearing premise
The social network structure, peer-influence strengths, and policy-response rules fitted to the 295-farm dataset will keep representing real decision-making across the full 15-year horizon without large unobserved changes or external shocks.
What would settle it
Long-term tracking of actual low-emission fertilizer adoption rates on Irish dairy farms over the next decade or more, checked against the model's projected cumulative curve and 91 percent saturation level.
Figures


read the original abstract
To understand complex system dynamics in dairy farming, it is essential to use modeling tools that capture farm heterogeneity, social interactions, and cumulative environmental impacts. This study proposes an agent-based modeling (ABM) framework to simulate nitrogen management and the adoption of low-emission fertilizer across 295 Irish dairy farms over a 15-year period. Using empirical data, the model represents farm communication through a social network, capturing peer influence and discussion group dynamics, where adoption probabilities are driven by social contagion, farm-scale characteristics, and policy interventions such as subsidies and carbon taxes. The framework estimates sectoral greenhouse gas emissions, cumulative abatement, and private-social cost trade-offs, using Monte Carlo simulation and sensitivity analysis to quantify uncertainty. The model shows strong agreement with observed adoption trajectories ($R^2 = 0.979$, RMSE = 0.0274) and is validated against empirical data using a Kolmogorov-Smirnov test (D = 0.2407, p < 0.001), indicating its ability to reproduce structural patterns in adoption behavior. Adoption dynamics are further characterized using a logistic diffusion model consistent with Rogers' innovation diffusion theory, capturing progression from early adoption to a saturation level of approximately 91%. By framing decarbonization as a socio-technical diffusion process rather than a purely economic optimization problem, this study provides an in silico policy laboratory for evaluating the robustness and diffusion speed of climate mitigation strategies prior to implementation.
Editorial analysis
A structured set of objections, weighed in public.
Referee Report
Summary. The manuscript develops an agent-based model (ABM) of low-emission fertilizer adoption across 295 Irish dairy farms over a 15-year horizon. Farms are heterogeneous agents connected via an empirically derived social network; adoption probabilities depend on social contagion, farm-scale covariates, and policy levers (subsidies, carbon taxes). The model is calibrated to observed adoption trajectories, reports R² = 0.979 and RMSE = 0.0274, applies a Kolmogorov-Smirnov test (D = 0.2407, p < 0.001) for validation, fits a logistic diffusion curve, and uses Monte Carlo simulation to project sectoral GHG abatement and cost trade-offs.
Significance. If the validation evidence can be made internally consistent, the work supplies a policy-relevant in silico laboratory that couples empirical network data with diffusion dynamics and uncertainty quantification. The use of real farm-level data and explicit Monte Carlo propagation are strengths; the framing as a socio-technical diffusion process rather than pure optimization is a useful conceptual contribution.
major comments (2)
- [Abstract and §4] Abstract and §4 (validation): The reported two-sample Kolmogorov-Smirnov statistic (D = 0.2407, p < 0.001) with n ≈ 295 rejects the null of distributional equivalence at conventional significance levels (critical value ≈ 0.079 for α = 0.05). This directly contradicts the claim that the test “indicates its ability to reproduce structural patterns.” The manuscript must either (a) specify an alternative test quantity (e.g., residuals of the logistic fit or a one-sample procedure) or (b) revise the validation language and interpretation.
- [§3.2 and §4] §3.2 and §4: Adoption probabilities and the logistic diffusion parameters appear to be calibrated on the same 295-farm trajectories later used for the R² and KS comparisons. The manuscript should report an explicit out-of-sample or cross-validation protocol (or justify why the reported R² and KS constitute genuine predictive validation rather than in-sample fit).
minor comments (2)
- [§2.3] Notation for the social-contagion strength parameter and the policy-response coefficients should be defined once in a table or equation block rather than re-introduced in multiple sections.
- [Figures 3–5] Figure captions for the adoption trajectories and KS plots should state the exact sample sizes and whether the plotted distributions are cumulative or density.
Simulated Author's Rebuttal
We thank the referee for their thorough review and insightful comments on our manuscript. We address each of the major comments below and indicate the revisions we will make to strengthen the paper.
read point-by-point responses
-
Referee: [Abstract and §4] Abstract and §4 (validation): The reported two-sample Kolmogorov-Smirnov statistic (D = 0.2407, p < 0.001) with n ≈ 295 rejects the null of distributional equivalence at conventional significance levels (critical value ≈ 0.079 for α = 0.05). This directly contradicts the claim that the test “indicates its ability to reproduce structural patterns.” The manuscript must either (a) specify an alternative test quantity (e.g., residuals of the logistic fit or a one-sample procedure) or (b) revise the validation language and interpretation.
Authors: We agree with the referee that the interpretation of the Kolmogorov-Smirnov test requires revision. The low p-value indicates a statistically significant difference between the simulated and observed distributions, which does not support the claim of reproducing structural patterns. We will revise the language in the abstract and Section 4 to remove this claim and instead emphasize the high R² = 0.979 and low RMSE = 0.0274 as evidence of good agreement with observed trajectories. We will also consider adding a one-sample KS test against the fitted logistic curve or residual analysis as an alternative validation metric. This change will be incorporated in the revised manuscript. revision: yes
-
Referee: [§3.2 and §4] §3.2 and §4: Adoption probabilities and the logistic diffusion parameters appear to be calibrated on the same 295-farm trajectories later used for the R² and KS comparisons. The manuscript should report an explicit out-of-sample or cross-validation protocol (or justify why the reported R² and KS constitute genuine predictive validation rather than in-sample fit).
Authors: We acknowledge that the model parameters, including adoption probabilities and logistic diffusion parameters, were calibrated using the full set of 295 observed farm trajectories, making the R² and KS metrics in-sample goodness-of-fit measures rather than out-of-sample predictions. This is typical for agent-based models that integrate empirical data for network structure and covariates. To address this, we will add a clear statement in Section 4 explaining the calibration-validation approach and justify that the reproduction of observed adoption trajectories serves as validation for the socio-technical diffusion process. Additionally, we will explore implementing a cross-validation protocol by partitioning the farms (e.g., by region or size) or using Monte Carlo cross-validation to assess robustness, and report this in the revised version if feasible. If data limitations prevent a full out-of-sample test, we will discuss this as a limitation of the study. revision: partial
Circularity Check
R² agreement and KS validation reduce to fit on the same empirical trajectories used for calibration
specific steps
-
fitted input called prediction
[Abstract]
"The model shows strong agreement with observed adoption trajectories (R² = 0.979, RMSE = 0.0274) and is validated against empirical data using a Kolmogorov-Smirnov test (D = 0.2407, p < 0.001), indicating its ability to reproduce structural patterns in adoption behavior. Adoption dynamics are further characterized using a logistic diffusion model consistent with Rogers' innovation diffusion theory, capturing progression from early adoption to a saturation level of approximately 91%."
Adoption probabilities and diffusion parameters are set using the 295-farm empirical dataset; the R² fit, KS comparison, and logistic characterization are then evaluated against the observed adoption trajectories from that same dataset, rendering the reported agreement a calibration diagnostic rather than an independent test.
full rationale
The ABM parameters for peer influence, social contagion, and adoption probabilities are derived directly from the 295-farm empirical dataset. The reported R²=0.979 agreement with observed adoption trajectories and the KS test are then performed against adoption patterns from that identical dataset. This makes the 'strong agreement' and 'reproduce structural patterns' claims measures of in-sample fit quality rather than out-of-sample prediction or independent validation. The logistic diffusion characterization is likewise fitted to the same trajectories. While the model structure itself (network + policy rules) adds content, the central quantitative validation claim reduces to a fitted-input-called-prediction pattern.
Axiom & Free-Parameter Ledger
free parameters (2)
- social contagion strength
- policy response coefficients
axioms (2)
- domain assumption Farmers' adoption decisions follow a logistic diffusion process consistent with Rogers' innovation diffusion theory.
- domain assumption Social network structure derived from discussion groups accurately captures peer influence.
Reference graph
Works this paper leans on
-
[1]
[EPA(2025)] EPA. (2025). Dairy farming is a major contributor to greenhouse gas emissions in Ireland. Environmental Protection Agency, Ireland. [Online]. Available: https://www.epa.ie/ [Teagasc(2024)] Teagasc. (2024). National Farm Survey 2023: Sustainability and Efficiency Indi- cators for Irish Dairy Farms. Teagasc, Athenry, Ireland. [Teagasc (2024)] Te...
work page 2025
-
[2]
https://doi.org/10.1186/s40100-024-00306- w [Ferrer et al.(2023)] Ferrer, A. J. G., Thanh, L. H., & Chuong, P. H. (2023). Farming household adoption of climate-smart agricultural technologies: evidence from North-Central Vietnam.Cli- mate and Development, 7(2), 641–663. https://doi.org/10.1007/s41685-023-00296-5 27 [Jameson et al.(2024)] Jameson, J., McDo...
-
[3]
https://doi.org/10.3390/su16041419 [Eastwood & Renwick(2020)] Eastwood, C. R., & Renwick, A. (2020). Innovation uncertainty im- pacts the adoption of smarter farming approaches.Frontiers in Sustainable Food Systems,
-
[4]
https://doi.org/10.3389/fsufs.2020.00024 [Chapman et al.(2022)] Chapman, M., Wiltshire, S., Baur, P., et al. (2022). Social-ecological feedbacks drive tipping points in farming system diversification. arXiv. https://arxiv.org/abs/2205.04425 [Alotibi(2025)] Alotibi, Y. S. (2025). A socio-technical agent-based simulation model for predicting smart agricultu...
-
[5]
[Sinnott et al.(2025)] Sinnott, U., Hanrahan, K., & Wallace, M. (2025). Identifying farmer ty- pologies based on attitudes towards greenhouse gas mitigation in Irish agriculture.Journal of Agricultural Education and Extension. [Palma-Molina et al.(2023)] Palma-Molina, P., Shalloo, M., & Horan, B. (2023). Factors associated with the intensity of technology...
work page 2025
-
[6]
[Serebrennikov et al.(2020)] Serebrennikov, D., Thorne, F., Kallas, Z., & McCarthy, S. N. (2020). Factors influencing adoption of sustainable farming practices in Europe: A systemic review of empirical literature.Sustainability, 12(22),
work page 2020
-
[7]
https://doi.org/10.3390/su12229719 [Feng et al.(2023)] Feng, J., Li, H., Cannon, N., Chang, X., & Chu, Q. (2023). A simulation study of how Chinese farmer cooperatives can drive effective low-carbon production systems through a carbon transaction incentive. [Marvuglia et al.(2021)] Marvuglia, A., Bayram, A., Baustert, P., Navarrete Guti´ errez, T., & Igos...
-
[8]
https://doi.org/10.18564/jasss.4714 [Bayram et al.(2024)] Bayram, A., Marvuglia, A., Navarrete Guti´ errez, T., & Soyeurt, H. (2024). Balancing environmental sustainability and economic viability in Luxembourgish farms: An agent-based model with multi-objective optimization.Sustainability, 16,
-
[9]
https://doi.org/10.3390/su16198536 [Bayram (2023)] Bayram, A., Marvuglia, A., Navarrete Gutierrez, T., Weis, J.-P., Conter, G., & Zimmer, S. (2023). Sustainable farming strategies for mixed crop-livestock farms in Luxem- bourg simulated with a hybrid agent-based and life-cycle assessment model.Journal of Cleaner Production, 386, 135759. https://doi.org/10...
-
[10]
[Online]. Available: https://teagasc.ie/wp-content/uploads/media/website/publications/2024/National-Farm- Survey-2023.pdf [Citizens Information (2026)] Citizens Information (2026). Carbon tax. Available at:https: //www.citizensinformation.ie/en/money-and-tax/tax/motor-carbon-other-taxes/ carbon-tax/ [Teagasc (2023)] Teagasc (2023). Protected urea: Reducin...
-
[11]
[Online]. Available:https://www.teagasc.ie/news/ protected-urea-performance/. [Accessed: Jan. 8, 2026]. [Williams (2025)] Williams, T. G., Brown, C., Diogo, V., Magliocca, N. R., Molla, N., Rounsevell, M. D. A., Zagaria, C., & Verburg, P. H. (2025). Power dynamics shape sustainability transitions in a modeled food system.One Earth, 8(1), 101158. https://d...
-
[12]
[Javansalehi(2024)] M. Javansalehi and M. Shourian, “Assessing the impacts of climate change on agriculture and water systems via coupled human-hydrological modeling,”Agricultural Water Management,
work page 2024
-
[13]
The uptake of European soy production: Insights from a partic- ipatory agent-based model,
[Farahbakhsh(2025)] S. Farahbakhsh, K. Peeters, J. Pannecoucque, G. Tavernier, B. Vanden Berghen, and J. van Meensel, “The uptake of European soy production: Insights from a partic- ipatory agent-based model,”Agricultural Systems,
work page 2025
-
[14]
[Tarruella (2025)] Tarruella, M., Huber, R., El-Benni, N., Mack, G., Sch¨ afer, D., & Finger, R. (2025). Understanding farmer behaviour for successful climate change mitigation in voluntary initiatives.Australian Journal of Agricultural and Resource Economics. 29
work page 2025
discussion (0)
Sign in with ORCID, Apple, or X to comment. Anyone can read and Pith papers without signing in.