Recognition: 2 theorem links
· Lean TheoremRadio Continuum and Water Maser Monitoring of the Outburst in HOPS 373: Free-Free Emission Does Not Respond to the Outburst
Pith reviewed 2026-05-11 00:47 UTC · model grok-4.3
The pith
Free-free radio emission from the protostar HOPS-373 shows no detectable change during its luminosity outburst.
A machine-rendered reading of the paper's core claim, the machinery that carries it, and where it could break.
Core claim
We do not find evidence for a change in the free-free emission traced by VLA 5 cm continuum during the peak of its outburst or during the decline. The lack of correlation between outburst and free-free emission from HOPS-373 indicates that the free-free emission may not directly respond to increases in the accretion rate and subsequently the outflow rate. The lack of a link could be due to the outflow mostly being neutral, or there may be offsets in the timescale for the free-free response.
What carries the argument
VLA C-band (5 cm) continuum monitoring combined with K-band (1.3 cm) continuum and 22 GHz water maser observations of HOPS-373 over two years.
If this is right
- Free-free emission may not respond directly to accretion-rate increases that drive the outburst.
- The protostellar outflow may remain mostly neutral rather than ionized.
- A time offset could exist between the luminosity burst and any eventual free-free response.
- Multi-frequency radio monitoring of other outbursting protostars can test whether this decoupling is typical.
Where Pith is reading between the lines
- If free-free emission is insensitive on these timescales, radio surveys may miss short-term accretion events in embedded sources.
- Longer baseline observations could distinguish between a neutral outflow and a delayed ionization response.
- Models of jet launching in Class 0 objects may need to incorporate a neutral component that does not produce immediate radio signatures.
Load-bearing premise
Any response in free-free emission to the outburst would be detectable within the monitoring period, sensitivity, and frequency coverage of the VLA observations.
What would settle it
A statistically significant rise in 5 cm continuum flux from HOPS-373 measured in a later VLA epoch after the current monitoring window.
Figures


read the original abstract
We present VLA C-band (5~cm) continuum, K-band (1.3~cm) continuum, and water maser (22.235 GHz) monitoring of the protostar HOPS-373. We additionally present the contemporaneous monitoring for 95 sources within the 5~cm field of view for over two years during the peak of the HOPS-373 outburst and an additional epoch in 2026. HOPS-373 is a binary Class 0 protostar located in the Orion star forming region that was found to have a $\sim$4$\times$ luminosity burst from the JCMT Transient Survey and NEOWISE monitoring. We do not find evidence for a change in the free-free emission traced by VLA 5~cm continuum during the peak of its outburst or during the decline. Moreover, the 1.3~cm continuum does not show significant variability between the NE and SW components of the HOPS-373 binary. The water maser emission is highly variable toward HOPS-373, multiple velocity components are detected at different (or the same) times and the maser spots are located close to the 1.3~cm continuum source of HOPS-373-SW. There is tentative evidence for the water maser spots to be propagating away from the source, but there is not a robust connection between the outburst and the observed maser activity. The lack of correlation between outburst and free-free emission from HOPS-373 indicates that the free-free emission may not directly respond to increases in the accretion rate and subsequently the outflow rate. The lack of a link could be due to the outflow mostly being neutral, or there may be offsets in the timescale for the free-free response.
Editorial analysis
A structured set of objections, weighed in public.
Referee Report
Summary. The manuscript reports VLA C-band (5 cm) continuum, K-band (1.3 cm) continuum, and 22 GHz water maser monitoring of the binary Class 0 protostar HOPS-373 during its ~4× luminosity outburst, plus contemporaneous monitoring of 95 field sources over two years plus one later epoch. The central result is a non-detection of variability in the 5 cm free-free emission during outburst peak and decline; the 1.3 cm data show no significant difference between the NE and SW components; water masers are highly variable with tentative evidence of outward motion but no robust link to the outburst. The authors conclude that free-free emission may not directly trace accretion-rate changes, possibly because the outflow is mostly neutral or because of timescale offsets.
Significance. If the non-detection holds after quantitative assessment, the result would constrain the accretion-ejection connection in Class 0 sources by showing that free-free tracers can remain stable even during large luminosity jumps. The multi-epoch, multi-source design and the inclusion of water-maser data are clear strengths that allow systematic effects to be checked. The work is observational rather than theoretical, with no machine-checked proofs or parameter-free derivations, but the consistent non-detection across wavelengths and comparison sources adds weight to the empirical claim.
major comments (2)
- [Discussion] The non-detection claim (abstract and Discussion) is load-bearing for the physical interpretation, yet the manuscript provides no forward-modelled prediction of the expected ΔS_5cm based on the observed ~4× luminosity increase, standard jet free-free scaling relations (S ∝ Ṁ^α with α ≈ 0.6–1.0), source distance, and known outflow properties. Without this, it is impossible to distinguish a true lack of physical response from a signal that lies below the VLA rms or is missed by the epoch spacing.
- [Results] The 1.3 cm continuum data are used solely to compare the NE and SW binary components but are not employed to derive a spectral index between 5 cm and 1.3 cm or to construct a time-series upper limit at the second frequency. Adding either would strengthen the free-free identification and the robustness of the non-variability conclusion.
minor comments (2)
- [Abstract] The abstract states that an additional epoch was obtained 'in 2026'; if this is a future observation relative to the main campaign, the timing relative to the outburst decline should be clarified in the text.
- Several long sentences in the abstract and introduction could be split to improve readability.
Simulated Author's Rebuttal
We thank the referee for the detailed and constructive report. The comments highlight opportunities to strengthen the quantitative support for our non-detection result and the free-free identification. We address each major comment below and have revised the manuscript accordingly.
read point-by-point responses
-
Referee: [Discussion] The non-detection claim (abstract and Discussion) is load-bearing for the physical interpretation, yet the manuscript provides no forward-modelled prediction of the expected ΔS_5cm based on the observed ~4× luminosity increase, standard jet free-free scaling relations (S ∝ Ṁ^α with α ≈ 0.6–1.0), source distance, and known outflow properties. Without this, it is impossible to distinguish a true lack of physical response from a signal that lies below the VLA rms or is missed by the epoch spacing.
Authors: We agree that an explicit estimate of the expected flux density change would improve the robustness of the interpretation. While the precise scaling between accretion luminosity and mass-loss rate remains uncertain for Class 0 sources (particularly if the outflow is largely neutral), we have added a new subsection in the Discussion that provides order-of-magnitude forward estimates. Using the observed 4× luminosity increase, adopting α = 0.6 and α = 1.0, the known distance to Orion, and the measured outflow properties from the literature, the predicted ΔS_5cm ranges from ~15–60% depending on the assumed exponent. Given our typical rms noise of ~0.02 mJy beam⁻¹ and the measured quiescent flux, such a change would have been detectable at >3σ in multiple epochs. The revised text also discusses the adequacy of the epoch sampling relative to the known outburst timescale. These additions directly address the concern while acknowledging the remaining uncertainties in the scaling relations. revision: yes
-
Referee: [Results] The 1.3 cm continuum data are used solely to compare the NE and SW binary components but are not employed to derive a spectral index between 5 cm and 1.3 cm or to construct a time-series upper limit at the second frequency. Adding either would strengthen the free-free identification and the robustness of the non-variability conclusion.
Authors: We appreciate this suggestion. The K-band data were obtained primarily to separate the binary components, but the observations include epochs with sufficient overlap in time and sensitivity to permit a spectral-index analysis. We have added a new paragraph in the Results section reporting the spectral index derived from the 5 cm and 1.3 cm measurements (α ≈ −0.05 ± 0.15, consistent with optically thin free-free emission). We have also constructed a time series of the total 1.3 cm flux and placed 3σ upper limits on any variability, finding no significant change during the outburst peak or decline. These new analyses are now presented alongside the existing NE/SW comparison and are referenced in the Discussion to reinforce the free-free nature of the emission and the lack of response. revision: yes
Circularity Check
Purely observational non-detection with no derivation or self-referential steps
full rationale
The paper reports direct VLA C-band and K-band continuum plus water maser monitoring of HOPS-373 across the known ~4x luminosity outburst. The central claim (no change in 5 cm free-free flux during peak or decline) is obtained by comparing measured flux densities between epochs; no equations, forward models, fitted parameters, or predictions are introduced that could reduce to the inputs by construction. No self-citations support load-bearing uniqueness theorems, ansatzes, or redefinitions. The result is therefore self-contained against external benchmarks and exhibits none of the enumerated circularity patterns.
Axiom & Free-Parameter Ledger
Lean theorems connected to this paper
-
IndisputableMonolith/Cost/FunctionalEquation.leanwashburn_uniqueness_aczel unclear?
unclearRelation between the paper passage and the cited Recognition theorem.
We do not find evidence for a change in the free-free emission traced by VLA 5 cm continuum during the peak of its outburst or during the decline.
-
IndisputableMonolith/Foundation/RealityFromDistinction.leanreality_from_one_distinction unclear?
unclearRelation between the paper passage and the cited Recognition theorem.
The lack of correlation between outburst and free-free emission from HOPS-373 indicates that the free-free emission may not directly respond to increases in the accretion rate and subsequently the outflow rate.
What do these tags mean?
- matches
- The paper's claim is directly supported by a theorem in the formal canon.
- supports
- The theorem supports part of the paper's argument, but the paper may add assumptions or extra steps.
- extends
- The paper goes beyond the formal theorem; the theorem is a base layer rather than the whole result.
- uses
- The paper appears to rely on the theorem as machinery.
- contradicts
- The paper's claim conflicts with a theorem or certificate in the canon.
- unclear
- Pith found a possible connection, but the passage is too broad, indirect, or ambiguous to say the theorem truly supports the claim.
Reference graph
Works this paper leans on
-
[1]
Anglada, G., Rodr´ ıguez, L. F., & Carrasco-Gonz´ alez, C. 2018, A&A Rv, 26, 3, doi: 10.1007/s00159-018-0107-z Anglada, G., Villuendas, E., Estalella, R., et al. 1998, AJ, 116, 2953, doi: 10.1086/300637 Astropy Collaboration, Price-Whelan, A. M., Sip˝ ocz, B. M., et al. 2018, The Astropy Project: Building an Open-science Project and Status of the v2.0 Cor...
-
[2]
30" 40" 50
′′9. This is a ‘flat noise’ image where the response of the primary beam has not been corrected. 22Tobin et al. -0°02'20" 30" 40" 50" Dec (J2000) HOPS-373 D-conf 2021 Mar - May 5.0" (2140 au) 0 1 2 3 41e 5 C-conf 2021 Jul - Sep 5.0" (2140 au) 0.0 0.5 1.0 1.5 2.0 2.5 3.01e 5 B-conf 2021/2 Oct - Jan 5.0" (2140 au) 0.0 0.5 1.0 1.5 2.01e 5 A-conf 2022 Mar - J...
2021
-
[3]
′′0 scalebar is drawn in each panel. HOPS 373 Monitoring23 57300 57400 Date (MJD) 0 10 20 30 40 50Flux Density ( Jy) D-config 59200 59400 59600 59800 60000 60200 Date (MJD) D-config D-config D-config C-config C-config B-config B-config A-config A-config A-config HOPS-373 C-band Flux Density 61000 61100 0 10 20 30 40 50 A-config 57300 57400 Date (MJD) 0 10...
2026
-
[4]
HOPS 373 Monitoring25 57300 57400 Date (MJD) 0 10 20 30 40 50 60Flux Density ( Jy) D-config 59200 59400 59600 59800 60000 60200 Date (MJD) D-config D-config D-config C-config C-config B-config B-config A-config A-config A-config HOPS-403 C-band Flux Density 61000 61100 0 10 20 30 40 50 60 A-config 57300 57400 Date (MJD) 0 25 50 75 100 125 150 175Flux Dens...
2022
-
[5]
50" 01'00
26Tobin et al. -0°00'40" 50" 01'00" 10" Dec (J2000) HOPS-403 D-conf 2021 Mar - May 5.0" (2140 au) 0 1 2 3 4 51e 5 C-conf 2021 Jul - Sep 5.0" (2140 au) 0 1 2 3 4 51e 5 B-conf 2021/2 Oct - Jan 5.0" (2140 au) 0 1 2 3 4 51e 5 A-conf 2022 Mar - Jun 5" (2140 au) 0 1 2 3 4 5 Surface Brightness (Jy/beam) 1e 5 5h46m28.7s 28.0s 27.3s 26.7s -0°00'40" 50" 01'00" 10" ...
2021
-
[6]
35.1" 35.2
Then in 2022 the sources appear equally bright in D-configuration again. The comparison of source flux densities and their ratios are consistent with no variability within their uncertainties (Figure 10). 30Tobin et al. 57300 57400 Date (MJD) 0 50 100 150 200 250Flux Density ( Jy) D-config HOPS-373-SW K-band Flux Density 59200 59400 59600 59800 60000 6020...
2022
-
[7]
32Tobin et al
We only overlay the masers on a single continuum image so that the motion relative to the same continuum position is more apparent and the masers are detected with much higher S/N than the continuum. 32Tobin et al. 0.005 0.000 0.005 D 2015-10-17 0.00 0.01 D 2015-11-21 0.00 0.05 D 2021-04-05 0.0 0.2 A 2022-02-18 0.00 0.05 A 2022-03-18 0.000 0.025 A 2022-04...
2015
-
[8]
34Tobin et al
HOPS 373 Monitoring33 0.005 0.000 0.005 C 2022-12-01 0.005 0.000 0.005 C 2022-12-27 0.00 0.01 B 2023-02-07 0.00 0.01 B 2023-03-05 0.00 0.01 B 2023-04-06 0.0 0.1 B 2023-05-20 0.00 0.05 B 2023-05-29 0.000 0.025 A 2023-07-24 0.00 0.05 A 2023-08-19 0.00 0.05 A 2023-09-09 30 20 10 0 10 20 30Velocity (km/s) 0.01 0.00 0.01 Flux Density (Jy) A 2026-02-02 Figure 1...
2022
-
[9]
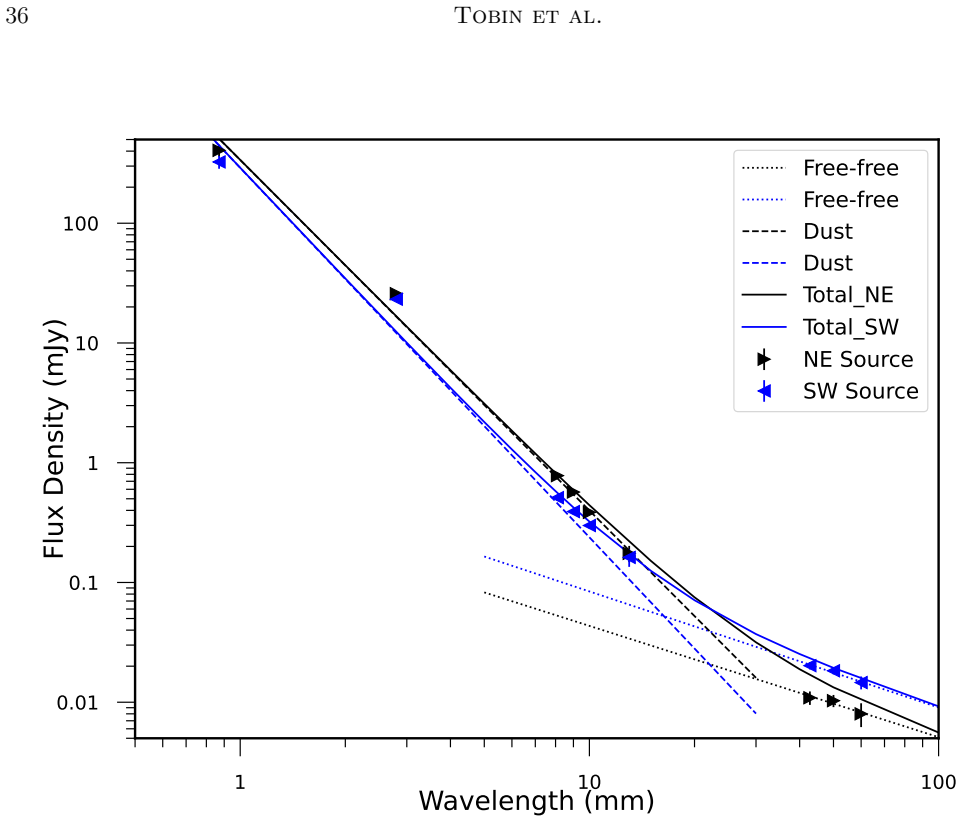
The total spectrum for NE clearly overshoots at the longest wavelengths, resulting from the shallower slope of the shorter wavelength data. HOPS 373 Monitoring37 57300 57400 0 20 40 60 80 100Flux Density ( Jy) D-config 59200 59400 59600 59800 60000 60200 Date (MJD) D-config D-config D-config C-config C-config B-config B-config A-config A-config A-config N...
2068
-
[10]
T able 1.VLA C-band Observation Log Proposal Code Date Date EBs Config
Time Series Plots for All Sources 38Tobin et al. T able 1.VLA C-band Observation Log Proposal Code Date Date EBs Config. Duration Samplers Calibrators Scale Factor Selfcal? (YYYY-MM-DD) (MJD) (hr) (Complex Gain, Bandpass, Flux) 15A-369 2015-10-06 57301 2 A→D a 1.0 3-bit J0541–0541, 3C147, 3C147· · ·Yes 21A-409 2021-03-24 59297 1 D 1.2 3-bit J0552+0313, 3C...
2015
-
[11]
Federman et al
S. Federman et al. (2023),
2023
-
[12]
J. J. Tobin et al. (2020),
2020
-
[13]
Lee et al
J.-E. Lee et al. (2023), and
2023
-
[14]
J. J. Tobin et al. (2015). When both this work and another reference is provided, the flux density was measured as part of this work, but the data were originally presented in the referenced work. HOPS 373 Monitoring45 T able
2015
-
[15]
Primary Source Catalog Source RA DEC Flux Density Peak Intensity Blended Sources a Other Names (ICRS) (ICRS) (µJy) (µJy bm −1) NGC-2068-B-VLA-1 05:46:31.846±0.15 +00:02:03.08±0.23 44.0±14.1 29.1±6.1 – None NGC-2068-B-VLA-2 05:46:28.188±0.13 +00:01:57.58±0.14 62.7±13.2 38.9±5.4 – None NGC-2068-B-VLA-3 05:46:44.142±0.02 +00:01:40.81±0.02 921.2±31.2 626.9±13...
2068
-
[16]
For example 2-D, means that the source in that row will be blended with source 2 when observed in D-configuration
a The source number and VLA configuration where it is blended with another source is listed. For example 2-D, means that the source in that row will be blended with source 2 when observed in D-configuration. HOPS 373 Monitoring47 T able 9.Per-Epoch Flux Densities Date Julian Date VLA-14 VLA-14 VLA-15 VLA-15 VLA-48 VLA-48 VLA-88 VLA-88 Flux Density N comps...
2015
discussion (0)
Sign in with ORCID, Apple, or X to comment. Anyone can read and Pith papers without signing in.