Recognition: 2 theorem links
· Lean TheoremThe Internal Nebular Attenuation Curve of Three-Dimensional Turbulent HII regions
Pith reviewed 2026-05-13 02:28 UTC · model grok-4.3
The pith
Clumpy turbulent structures inside HII regions leave the internal nebular attenuation curve slope unchanged.
A machine-rendered reading of the paper's core claim, the machinery that carries it, and where it could break.
Core claim
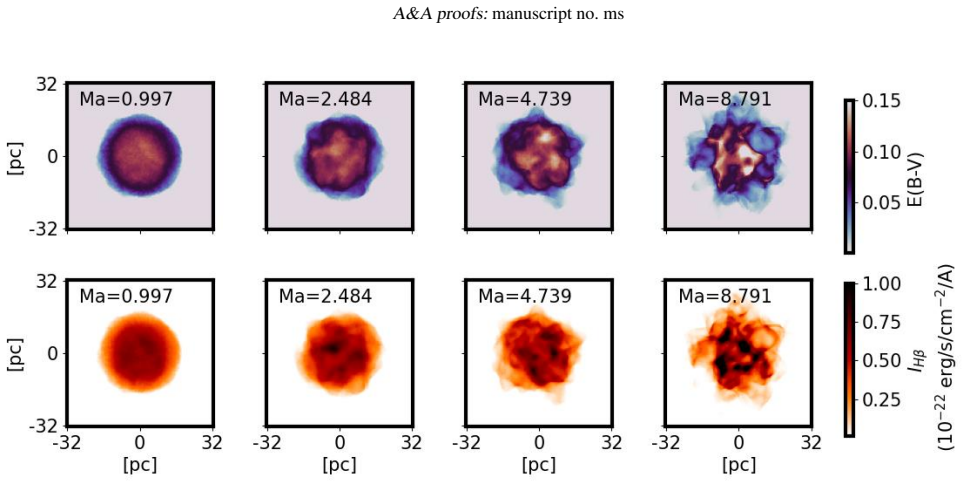
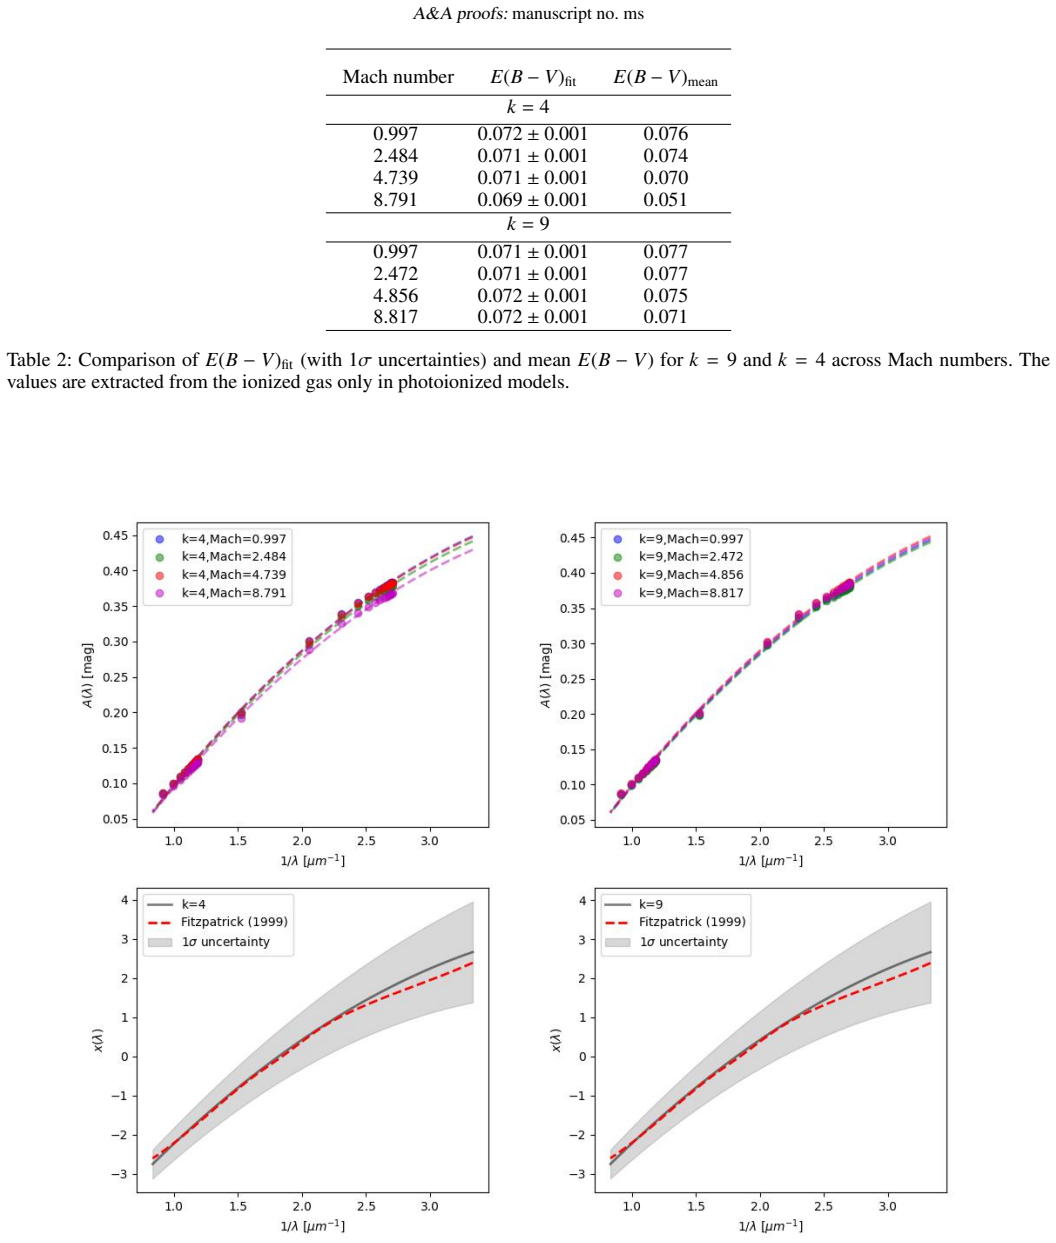
The internal density and temperature fluctuations of HII regions make the radiative transfer of hydrogen lines neither Case A nor Case B conditions, resulting in the global Hα to Hβ ratio of approximately 3.02-3.03. The clumpy structures within HII regions do not change the slope of the internal attenuation curve because the heavy dust obscuration of dense clumps is canceled out by the high in-situ production of emission-line intensities.
What carries the argument
Three-dimensional turbulent density and temperature fields from M3D simulations with Monte Carlo dust radiative transfer, which generate attenuated emission-line maps and allow derivation of the internal nebular attenuation curve from hydrogen lines.
If this is right
- The slope of the internal attenuation curve can be extracted from hydrogen lines without resolving individual clumps.
- Emission-line ratio corrections for HII regions should adopt a value near 3.02-3.03 rather than 2.86 when temperatures are below 10,000 K.
- Varying Mach numbers in the turbulence do not alter the fundamental slope of the nebular attenuation curve.
- Internal dust corrections remain robust even when the medium is highly structured.
Where Pith is reading between the lines
- Simpler attenuation corrections for extragalactic HII regions may be possible without full 3D hydrodynamic modeling.
- High-resolution maps of nearby HII regions could directly test the predicted Hα/Hβ deviation.
- Similar cancellation between obscuration and local production may appear in other turbulent ionized media.
Load-bearing premise
The chosen 3D turbulent fields, dust properties, and Mach numbers in the simulations represent the actual conditions inside real HII regions.
What would settle it
High-resolution spectroscopy of individual HII regions that measures the slope of the internal attenuation curve from multiple hydrogen lines and finds a value different from the simulated slope.
Figures


read the original abstract
The internal dust attenuation of the Hii region reduces the observed emission-line fluxes. Turbulent density fields within each Hii region change the degree of the line-of-the-sight obscuration of the emission-line fluxes. In this paper, we implement the dust Monte-Carlo radiative transfer in the latest M3D code, creating the emission-line maps attenuated by the internal turbulent dust obscuration with the varying Mach numbers. The internal density and temperature fluctuations of Hii regions make the radiative transfer of hydrogen lines neither Case A nor Case B conditions, resulting in the global H{\alpha} to H\b{eta} ratio of approximately 3.02-3.03, differing from the widely-used value of 2.86. This deviation from Case B is because the temperature of these Hii regions is cooler than 10,000 K. We further derive the internal nebular attenuation curve from the attenuated Hydrogen lines, finding that the clumpy structures within Hii regions do not change the slope of the internal attenuation curve. This is because the heavy dust obscuration of dense clumps is canceled out by the high in-situ production of emission-line intensities.
Editorial analysis
A structured set of objections, weighed in public.
Referee Report
Summary. The paper implements Monte-Carlo dust radiative transfer within the M3D code to generate emission-line maps from three-dimensional turbulent HII regions characterized by varying Mach numbers. It reports that the resulting global Hα/Hβ ratio is 3.02–3.03 (instead of the Case B value 2.86) because the simulated temperatures lie below 10,000 K, and concludes that the slope of the internal nebular attenuation curve is unaffected by clumpy structures because the increased line-of-sight obscuration in dense clumps is precisely offset by locally enhanced in-situ emission-line production.
Significance. If the reported cancellation between clump obscuration and local emission enhancement is shown to be robust, the result would imply that standard attenuation curves can be applied to integrated spectra of turbulent HII regions without additional corrections for internal clumping. The forward-modeling approach with explicit 3D density and temperature fields is a methodological strength that could be extended to other nebular diagnostics.
major comments (3)
- [Results] The central claim that clumpy turbulent structures leave the attenuation-curve slope unchanged rests on a single set of M3D runs with fixed dust properties, temperature distribution, and Mach-number range; no tests varying Mach number, dust-to-gas ratio, or the amplitude of temperature fluctuations are reported, so it is unclear whether the exact cancellation is general or an artifact of the chosen inputs (Results section).
- [Results] The simulated global Hα/Hβ ratios (3.02–3.03) and density contrasts are not compared against empirical constraints from observed HII regions, leaving the representativeness of the M3D fields unverified and weakening the applicability of the cancellation result to real nebulae (Abstract and Results).
- [Methods] Implementation details of the dust Monte-Carlo radiative transfer module added to M3D, including how the 3D temperature and density fields are mapped to local emissivities and how convergence with respect to photon packet number or grid resolution is assessed, are not provided, preventing assessment of numerical robustness (Methods section).
minor comments (2)
- [Abstract] The abstract contains LaTeX artifacts (H{b}eta) and the temperature explanation for the Hα/Hβ shift is stated without a supporting figure or table showing the temperature PDF.
- [Results] Notation for the derived internal attenuation curve (e.g., definition of the reference wavelength or normalization) is not introduced before the results are presented.
Simulated Author's Rebuttal
We thank the referee for the constructive and detailed comments. We address each major point below and outline the revisions we will make.
read point-by-point responses
-
Referee: The central claim that clumpy turbulent structures leave the attenuation-curve slope unchanged rests on a single set of M3D runs with fixed dust properties, temperature distribution, and Mach-number range; no tests varying Mach number, dust-to-gas ratio, or the amplitude of temperature fluctuations are reported, so it is unclear whether the exact cancellation is general or an artifact of the chosen inputs (Results section).
Authors: Our simulations already vary Mach number over a representative range (as stated in the abstract and Results), which tests the effect of different turbulence levels. We agree that exploring dust-to-gas ratio and temperature fluctuation amplitude would further demonstrate the robustness of the cancellation. In the revised manuscript we will add these parameter variations and show that the attenuation-curve slope remains unchanged. revision: yes
-
Referee: The simulated global Hα/Hβ ratios (3.02–3.03) and density contrasts are not compared against empirical constraints from observed HII regions, leaving the representativeness of the M3D fields unverified and weakening the applicability of the cancellation result to real nebulae (Abstract and Results).
Authors: The M3D density fields use Mach numbers and contrasts consistent with observed supersonic turbulence in HII regions, and the elevated Hα/Hβ arises from T < 10,000 K, which occurs in some observed cooler nebulae. We will add a comparison subsection in Results that places our global ratios and density contrasts against literature values from integral-field observations of nearby HII regions. revision: yes
-
Referee: Implementation details of the dust Monte-Carlo radiative transfer module added to M3D, including how the 3D temperature and density fields are mapped to local emissivities and how convergence with respect to photon packet number or grid resolution is assessed, are not provided, preventing assessment of numerical robustness (Methods section).
Authors: We agree these details are required for reproducibility. Local emissivities are computed from the 3D density and temperature fields using standard recombination coefficients adjusted for local conditions; the Monte-Carlo module propagates photon packets with dust absorption and scattering. The revised Methods section will describe the mapping procedure in full and report convergence tests for photon packet number and grid resolution. revision: yes
Circularity Check
Forward Monte-Carlo radiative transfer on M3D turbulent fields produces independent attenuation-curve result
full rationale
The paper constructs 3D turbulent density and temperature fields inside the M3D code, performs dust Monte-Carlo radiative transfer to generate attenuated emission-line maps across a range of Mach numbers, computes global Hα/Hβ ratios (reported as 3.02–3.03), and extracts the internal nebular attenuation curve directly from those maps. The central statement that clumpy structures leave the slope unchanged because dense-clump obscuration is offset by locally enhanced line production is an output of the radiative-transfer calculation rather than an algebraic identity, a fitted parameter renamed as a prediction, or a premise justified solely by self-citation. No load-bearing step reduces the claimed cancellation to a redefinition of the input density PDF, temperature distribution, or dust model; the derivation therefore remains self-contained against external benchmarks.
Axiom & Free-Parameter Ledger
free parameters (1)
- Mach number
axioms (2)
- domain assumption Monte Carlo radiative transfer accurately captures absorption and scattering of emission lines in 3D dusty turbulent media
- domain assumption Temperature fluctuations below 10,000 K produce the observed deviation from Case B recombination
Lean theorems connected to this paper
-
IndisputableMonolith/Cost/FunctionalEquation.leanwashburn_uniqueness_aczel unclear?
unclearRelation between the paper passage and the cited Recognition theorem.
the heavy dust obscuration of dense clumps is canceled out by the high in-situ production of emission-line intensities
-
IndisputableMonolith/Foundation/AlexanderDuality.leanalexander_duality_circle_linking unclear?
unclearRelation between the paper passage and the cited Recognition theorem.
derive the internal nebular attenuation curve from the attenuated Hydrogen lines
What do these tags mean?
- matches
- The paper's claim is directly supported by a theorem in the formal canon.
- supports
- The theorem supports part of the paper's argument, but the paper may add assumptions or extra steps.
- extends
- The paper goes beyond the formal theorem; the theorem is a base layer rather than the whole result.
- uses
- The paper appears to rely on the theorem as machinery.
- contradicts
- The paper's claim conflicts with a theorem or certificate in the canon.
- unclear
- Pith found a possible connection, but the passage is too broad, indirect, or ambiguous to say the theorem truly supports the claim.
Reference graph
Works this paper leans on
-
[1]
Asplund, M., Grevesse, N., Sauval, A. J., & Scott, P . 2009, ARA&A, 47, 481
work page 2009
- [2]
- [3]
-
[4]
Caplan, J. & Deharveng, L. 1986, A&A, 155, 297 Del Zanna, G., Dere, K. P ., Y oung, P . R., Landi, E., & Mason, H. E. 2015, A&A, 582, A56
work page 1986
-
[5]
Dopita, M. A. 1976, ApJ, 209, 395
work page 1976
-
[6]
Dopita, M. A., Groves, B. A., Sutherland, R. S., & Kewley, L. J. 2003, ApJ, 583, 727
work page 2003
-
[7]
Dopita, M. A., Kewley, L. J., Heisler, C. A., & Sutherland, R. S. 2000, ApJ, 542, 224
work page 2000
-
[8]
Dopita, M. A. & Sutherland, R. S. 2003, Astrophysics of the di ffuse universe
work page 2003
-
[9]
Draine, B. T. 2009, in Astronomical Society of the Pacific Conference Se- ries, V ol. 414, Cosmic Dust - Near and Far, ed. T. Henning, E. Grün, & J. Steinacker, 453
work page 2009
-
[10]
Draine, B. T. 2011, ApJ, 732, 100
work page 2011
-
[11]
Edenhofer, G., Zucker, C., Frank, P ., et al. 2024, A&A, 685, A82
work page 2024
-
[12]
Elmegreen, B. G. & Scalo, J. 2004, ARA&A, 42, 211
work page 2004
- [13]
-
[14]
Fitzpatrick, E. L. 1999, PASP , 111, 63
work page 1999
- [15]
- [16]
-
[17]
Jenkins, E. B. 2009, ApJ, 700, 1299
work page 2009
- [18]
-
[19]
Kaasinen, M., Bian, F., Groves, B., Kewley, L. J., & Gupta, A. 2017, MNRAS, 465, 3220
work page 2017
- [20]
-
[21]
Mathis, J. S., Rumpl, W., & Nordsieck, K. H. 1977, ApJ, 217, 425
work page 1977
-
[22]
Mellema, G., Arthur, S. J., Henney, W. J., Iliev, I. T., & Shapiro, P . R. 2006, ApJ, 647, 397
work page 2006
-
[23]
Molina, F. Z., Glover, S. C. O., Federrath, C., & Klessen, R. S. 2012, MNRAS, 423, 2680
work page 2012
-
[24]
Narayanan, D., Conroy, C., Davé, R., Johnson, B. D., & Popping, G. 2018, ApJ, 869, 70
work page 2018
-
[25]
Oey, M. S. & Kennicutt, Jr., R. C. 1997, MNRAS, 291, 827 O’Neill, T. J., Zucker, C., Goodman, A. A., & Edenhofer, G. 2024, ApJ, 973, 136
work page 1997
- [26]
-
[27]
Petrosian, V ., Silk, J., & Field, G. B. 1972, ApJ, 177, L69
work page 1972
-
[28]
Pillepich, A., Nelson, D., Springel, V ., et al. 2019, MNRAS, 490, 3196
work page 2019
- [29]
-
[30]
Reddy, N. A., Shapley, A. E., Sanders, R. L., et al. 2025, arXiv e-prints, arXiv:2506.17396
work page internal anchor Pith review arXiv 2025
- [31]
-
[32]
Salpeter, E. E. 1955, ApJ, 121, 161
work page 1955
- [33]
-
[34]
Savage, B. D. & Sembach, K. R. 1996, ARA&A, 34, 279
work page 1996
-
[35]
Schmutz, W., Leitherer, C., & Gruenwald, R. 1992, PASP , 104, 1164
work page 1992
- [36]
-
[37]
Shapley, A. E., Sanders, R. L., Topping, M. W., et al. 2025, ApJ, 980, 242
work page 2025
-
[38]
Sparre, M., Whittingham, J., Damle, M., et al. 2022, MNRAS, 509, 2720
work page 2022
-
[39]
Stone, J. M., Tomida, K., White, C. J., & Felker, K. G. 2020, The Astrophysical Journal Supplement Series, 249, 4
work page 2020
-
[40]
Storey, P . J. & Hummer, D. G. 1995, MNRAS, 272, 41
work page 1995
-
[41]
Sutherland, R., Dopita, M., Binette, L., & Groves, B. 2018, MAPPINGS V: As- trophysical plasma modeling code, Astrophysics Source Code Library, record ascl:1807.005
work page 2018
-
[42]
Sutherland, R. S. & Dopita, M. A. 1993, ApJS, 88, 253 V eilleux, S. & Osterbrock, D. E. 1987, ApJS, 63, 295
work page 1993
- [43]
-
[44]
Wild, V ., Charlot, S., Brinchmann, J., et al. 2011, MNRAS, 417, 1760
work page 2011
-
[45]
Wisnioski, E., Förster Schreiber, N. M., Wuyts, S., et al. 2015, ApJ, 799, 209
work page 2015
-
[46]
Witt, A. N. & Gordon, K. D. 2000, ApJ, 528, 799
work page 2000
-
[47]
Wood, D. O. S. & Churchwell, E. 1989, ApJS, 69, 831 Zamora-Avilés, M., Vázquez-Semadeni, E., González, R. F., et al. 2019, MN- RAS, 487, 2200
work page 1989
-
[48]
2021, ApJ, 919, 35 Article number, page 9
Zucker, C., Goodman, A., Alves, J., et al. 2021, ApJ, 919, 35 Article number, page 9
work page 2021
discussion (0)
Sign in with ORCID, Apple, or X to comment. Anyone can read and Pith papers without signing in.