Recognition: unknown
The P behind Q: Empirical Evidence from Physical Drift in Put-Call Parity
Pith reviewed 2026-05-14 20:36 UTC · model grok-4.3
The pith
Physical drift improves the fit of put-call parity carry gaps in index options.
A machine-rendered reading of the paper's core claim, the machinery that carries it, and where it could break.
Core claim
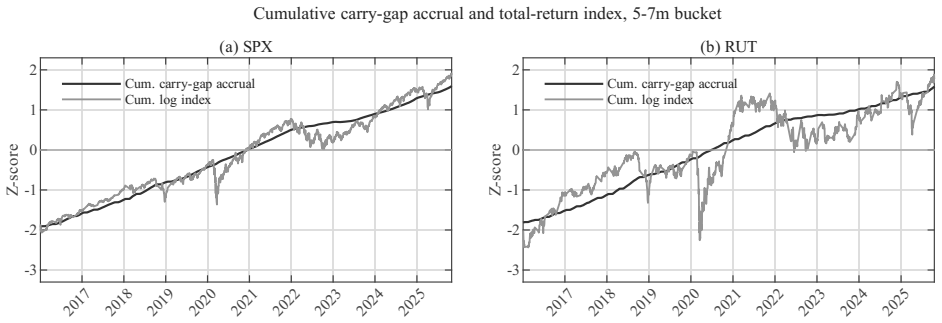
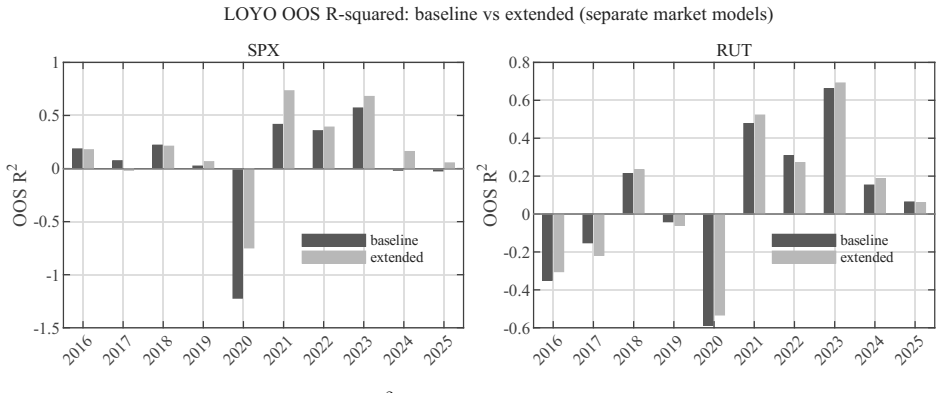
The central claim is that a drift-preserving extension of the geometric Brownian motion implementation-risk term, which adds an (r μ τ) component where μ is the physical drift estimated via lagged rolling OLS, better explains the annualized wedge between option-implied and OIS-implied discounting rates. This holds empirically for European index options on SPX and RUT, with stronger results for SPX, supporting the view that parity is enforced with costs sensitive to the physical measure drift.
What carries the argument
The drift-augmented implementation-risk term in the put-call parity carry gap model, specifically the addition of (r μ τ) to the path-risk component (r σ √τ).
Load-bearing premise
The lagged rolling OLS trend serves as an accurate proxy for the physical drift component that affects margin burdens in enforcing put-call parity.
What would settle it
Observing no improvement in fit when the drift term is added to the model on new data periods or alternative indices would falsify the central claim.
Figures


read the original abstract
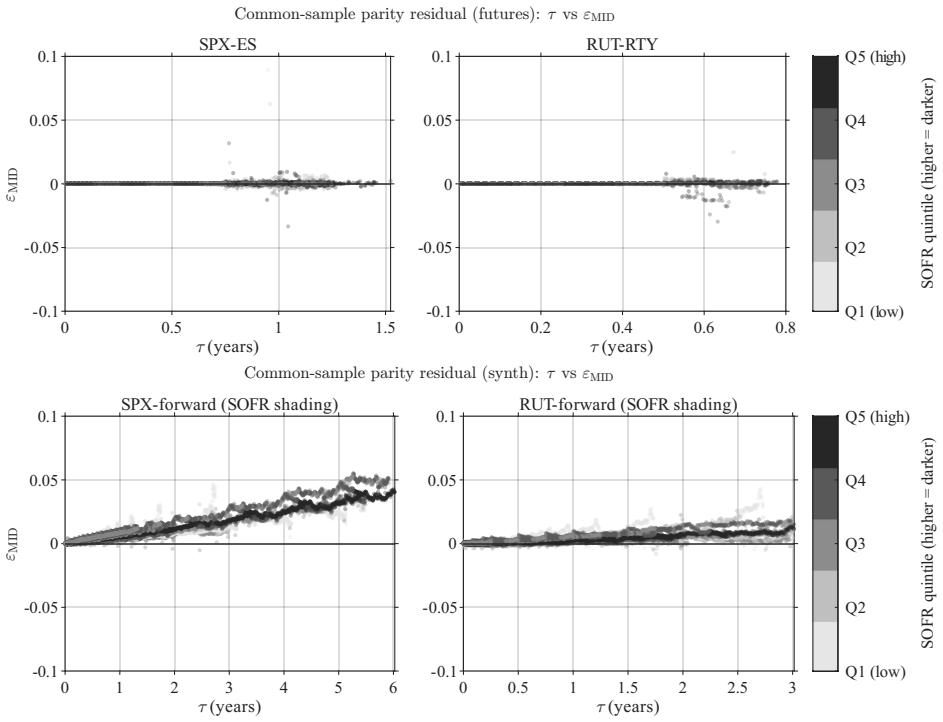
Put-call parity is exact as a terminal-payoff identity, yet its market enforcement is path-dependent and capital-using. This paper examines whether physical-measure drift is reflected in the carry gap, defined as the annualized wedge between option-implied and OIS-implied discounting, using SPX and RUT European index options. I derive a drift-preserving extension of the GBM implementation-risk term that adds an (r\mu\tau) component to the standard (r\sigma\sqrt{\tau}) path-risk component. The drift input (\mu) is measured by a lagged rolling-OLS trend proxy and should not be interpreted as an observed expected return. Empirically, the drift term improves both in-sample and leave-one-year-out fit, especially for SPX, consistent with drift-sensitive margin burden in parity enforcement rather than a failure of no-arbitrage.
Editorial analysis
A structured set of objections, weighed in public.
Referee Report
Summary. The paper claims that put-call parity enforcement in SPX and RUT European index options incorporates physical-measure drift through a margin-burden channel. It derives a drift-preserving extension to the standard GBM implementation-risk term that augments the usual (rσ√τ) path-risk component with an additional (rμτ) term. Using a lagged rolling-OLS trend proxy for the physical drift μ (explicitly not to be read as an observed expected return), the author reports that inclusion of this term improves both in-sample and leave-one-year-out fit to the carry gap—the annualized wedge between option-implied and OIS-implied discounting—especially for SPX, and interprets the result as evidence of drift-sensitive parity enforcement rather than a no-arbitrage violation.
Significance. If the central empirical result survives scrutiny, the paper would supply concrete evidence that capital costs tied to physical drift affect the path-dependent enforcement of a terminal identity, thereby linking the P-measure to observed Q-measure discrepancies in a specific, testable way. The leave-one-year-out validation and focus on index options are constructive features. The work sits at the intersection of limits-to-arbitrage and implementation-risk literatures and could inform models of margin requirements in derivatives markets.
major comments (3)
- [Empirical results] Empirical results section: the lagged rolling-OLS proxy for μ is estimated from the same underlying series that generates the carry-gap observations and is then inserted into the regression to demonstrate improved fit. This construction risks capturing persistent autocorrelation or omitted factors in the gap itself rather than isolating a drift-sensitive margin burden; an explicit horse-race against a simple AR(1) benchmark on the gap or a placebo using shuffled μ would be required to support the mechanism.
- [Model derivation] Derivation of the extended implementation-risk term (the (rμτ) addition): the paper states that the extension is drift-preserving, yet provides no step-by-step derivation showing how margin costs map onto the rμτ coefficient under the maintained GBM assumptions. Without this, it is unclear whether the functional form is uniquely implied by the margin-burden story or is one of several possible extensions that could fit the data.
- [Abstract and results] Abstract and results: the claim of improved fit is presented without reported R² values, RMSE reductions, coefficient standard errors, or economic magnitudes for the (rμτ) term. These statistics are load-bearing for assessing whether the documented gains are statistically and economically meaningful or merely artifacts of the proxy construction.
minor comments (2)
- [Model] Notation: the carry gap is defined as an annualized wedge, but the precise scaling (e.g., whether τ is in years or trading days) should be stated explicitly when the (rμτ) term is introduced.
- [Introduction] The statement that μ 'should not be interpreted as an observed expected return' is helpful but would benefit from a short footnote clarifying what economic object the rolling-OLS trend is intended to proxy.
Simulated Author's Rebuttal
We thank the referee for the thoughtful and constructive comments on our manuscript. We have carefully considered each point and will make revisions to address the concerns raised. Below we provide point-by-point responses.
read point-by-point responses
-
Referee: Empirical results section: the lagged rolling-OLS proxy for μ is estimated from the same underlying series that generates the carry-gap observations and is then inserted into the regression to demonstrate improved fit. This construction risks capturing persistent autocorrelation or omitted factors in the gap itself rather than isolating a drift-sensitive margin burden; an explicit horse-race against a simple AR(1) benchmark on the gap or a placebo using shuffled μ would be required to support the mechanism.
Authors: We appreciate the referee's caution regarding the potential for the lagged rolling-OLS proxy to capture autocorrelation or omitted variables. In the revised version, we will conduct an explicit horse-race against a simple AR(1) model on the carry gap and include a placebo test with shuffled μ values. These additional analyses will help isolate the contribution of the drift term and support the proposed mechanism. revision: yes
-
Referee: Derivation of the extended implementation-risk term (the (rμτ) addition): the paper states that the extension is drift-preserving, yet provides no step-by-step derivation showing how margin costs map onto the rμτ coefficient under the maintained GBM assumptions. Without this, it is unclear whether the functional form is uniquely implied by the margin-burden story or is one of several possible extensions that could fit the data.
Authors: We agree that a clear step-by-step derivation is essential for transparency. We will expand the model section to include a detailed derivation demonstrating how the margin costs under the GBM framework map to the additional (rμτ) term. This will show that the functional form follows directly from the margin-burden channel. revision: yes
-
Referee: Abstract and results: the claim of improved fit is presented without reported R² values, RMSE reductions, coefficient standard errors, or economic magnitudes for the (rμτ) term. These statistics are load-bearing for assessing whether the documented gains are statistically and economically meaningful or merely artifacts of the proxy construction.
Authors: We will update the abstract and the results section to report the R² values, RMSE reductions, coefficient standard errors, and economic magnitudes associated with the (rμτ) term. These statistics will provide a more complete assessment of the fit improvement and its significance. revision: yes
Circularity Check
No significant circularity in derivation or empirical test
full rationale
The paper derives a drift-preserving extension to the GBM implementation-risk term by adding an (rμτ) component to the standard path-risk term, then measures μ separately via a lagged rolling-OLS trend proxy on physical data (explicitly cautioning against interpreting it as an observed expected return). It reports that including this term improves in-sample and leave-one-year-out fit to the carry gap. This is a standard empirical test of an independently derived functional form; the μ proxy is constructed from underlying returns rather than from the carry-gap series itself, so the reported fit improvement does not reduce to the inputs by construction. No self-citation load-bearing steps, uniqueness theorems, or ansatz smuggling appear in the provided text.
Axiom & Free-Parameter Ledger
free parameters (1)
- μ (physical drift)
axioms (2)
- standard math Put-call parity holds exactly as a terminal-payoff identity
- domain assumption Underlying follows geometric Brownian motion (GBM)
Reference graph
Works this paper leans on
-
[1]
Stoll, H. R. (1969). The Relationship between Put and Call Option Prices.The Journal of Finance, 24(5), 801–824.https://doi.org/10.1111/j.1540-6261.1969.tb01694.x
-
[2]
Black, F., & Scholes, M. (1973). The Pricing of Options and Corporate Liabilities.Journal of Political Economy, 81(3), 637–654.https://doi.org/10.1086/260062
-
[3]
Merton, R. C. (1973). Theory of Rational Option Pricing.The Bell Journal of Economics and Management Science, 4(1), 141–183.https://doi.org/10.2307/3003143
-
[4]
Gould, J. P., & Galai, D. (1974). Transaction Costs and the Relationship between Put and Call Prices.Journal of Financial Economics, 1(2), 105–129.https://doi.org/10.1016/ 0304-405X(74)90001-4
work page 1974
-
[5]
Klemkosky, R. C., & Resnick, B. G. (1979). Put–Call Parity and Market Efficiency.The Journal of Finance, 34(5), 1141–1155.https://doi.org/10.1111/j.1540-6261.1979. tb00061.x
-
[6]
Shleifer, A., & Vishny, R. W. (1997). The Limits of Arbitrage.The Journal of Finance, 52(1), 35–55.https://doi.org/10.1111/j.1540-6261.1997.tb03807.x
-
[7]
Ackert, L. F., & Tian, Y. S. (2001). Efficiency in Index Options Markets and Trading in Stock Baskets.Journal of Banking & Finance, 25(9), 1607–1634.https://doi.org/10. 1016/S0378-4266(00)00145-X
work page 2001
-
[8]
Gromb, D., & Vayanos, D. (2002). Equilibrium and Welfare in Markets with Financially Constrained Arbitrageurs.Journal of Financial Economics, 66(2–3), 361–407.https:// doi.org/10.1016/S0304-405X(02)00228-3
-
[9]
Ofek, E., Richardson, M., & Whitelaw, R. F. (2004). Limited arbitrage and short sales restrictions: evidence from the options markets.Journal of Financial Economics, 74(2), 305–342.https://doi.org/10.1016/j.jfineco.2003.05.008
-
[10]
Bollerslev, T., Tauchen, G., & Zhou, H. (2009). Expected Stock Returns and Variance Risk Premia.The Review of Financial Studies, 22(11), 4463–4492.https://doi.org/10.1093/ rfs/hhp008
work page 2009
-
[11]
Brunnermeier, M. K., & Pedersen, L. H. (2009). Market Liquidity and Funding Liquidity.The Review of Financial Studies, 22(6), 2201–2238.https://doi.org/10.1093/rfs/hhn098 39
-
[12]
Mitchell, M., & Pulvino, T. (2012). Arbitrage Crashes and the Speed of Capital.Journal of Financial Economics, 104(3), 469–490.https://doi.org/10.1016/j.jfineco.2011. 09.002
-
[13]
Ross, S. (2015). The Recovery Theorem.The Journal of Finance, 70(2), 615–648.https: //doi.org/10.1111/jofi.12092
-
[14]
Martin, I. (2017). What Is the Expected Return on the Market?The Quarterly Journal of Economics, 132(1), 367–433.https://doi.org/10.1093/qje/qjw034
-
[15]
Du, W., Tepper, A., & Verdelhan, A. (2018). Deviations from Covered Interest Rate Parity. The Journal of Finance, 73(3), 915–957.https://doi.org/10.1111/jofi.12620
-
[16]
Azzone, M., & Baviera, R. (2021). Synthetic Forwards and Cost of Funding in the Equity Derivative Market.Finance Research Letters, 41, 101841.https://doi.org/10.1016/j. frl.2020.101841
work page doi:10.1016/j 2021
-
[17]
Muravyev, D., Pearson, N. D., & Pollet, J. M. (2025). Why does options market information predict stock returns?Journal of Financial Economics, 172, 104153.https://doi.org/ 10.1016/j.jfineco.2025.104153
-
[18]
Shin, U. (2026). The Cost of a Free Lunch.SSRN Working Paper, No. 6407379.https: //dx.doi.org/10.2139/ssrn.6407379 Board of Governors of the Federal Reserve System (US). (2026). Federal Reserve Bank of Chicago, Chicago Fed National Financial Conditions Index [NFCI], retrieved from
-
[19]
Louis, April 3, 2026.https://fred.stlouisfed
FRED, Federal Reserve Bank of St. Louis, April 3, 2026.https://fred.stlouisfed. org/series/NFCI ThetaData. (2026). Historical SPX and RUT option NBBO data. Retrieved April 3, 2026, fromhttps://www.thetadata.net 40 A Implementation Details of the Pipeline This appendix summarizes the implementation procedure used to identify option-implied discount factors...
work page 2026
discussion (0)
Sign in with ORCID, Apple, or X to comment. Anyone can read and Pith papers without signing in.