ChronoEarth-492K: A Large Scale and Long Horizon Spatiotemporal Hyperspectral Earth Observation Dataset and Benchmark
Pith reviewed 2026-05-20 18:21 UTC · model grok-4.3
The pith
ChronoEarth-492K introduces the first large-scale temporally calibrated hyperspectral dataset spanning 17 years of Earth observations.
A machine-rendered reading of the paper's core claim, the machinery that carries it, and where it could break.
Core claim
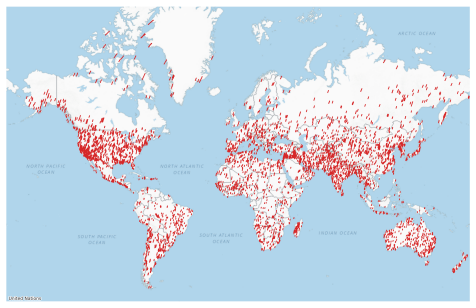
ChronoEarth-492K comprises 492,354 radiometrically harmonized patches across 185,398 global locations over 17 years, with 28,786 sites containing multi-temporal sequences of at least three observations that enable both short- and long-horizon temporal analysis in hyperspectral self-supervised learning.
What carries the argument
ChronoEarth-492K, the collection of radiometrically harmonized hyperspectral patches with multi-temporal sequences from the EO-1 Hyperion mission, which provides the temporally consistent data for spatiotemporal modeling.
If this is right
- Developers can now train hyperspectral models on long-horizon sequences to better understand land cover changes over years.
- The benchmark enables standardized comparisons of models on static, short-term, and long-term Earth observation tasks.
- Baseline results show how current foundation models perform on this new temporal dataset.
- Researchers gain access to a platform for systematic spatiotemporal hyperspectral representation learning.
Where Pith is reading between the lines
- Models trained on this data might reveal patterns in ecosystem responses to climate variations that shorter datasets miss.
- Future work could combine these spectral sequences with climate models to forecast environmental shifts.
- This approach could be extended to other satellite archives to create even longer temporal records.
Load-bearing premise
The radiometric harmonization ensures that spectral values from different years can be compared directly without leftover calibration differences.
What would settle it
Comparing spectral signatures from repeated observations of the same stable location across different years and finding large unexplained variations would indicate that the harmonization does not fully remove temporal inconsistencies.
Figures


read the original abstract
Hyperspectral imaging (HSI) provides dense spectral information for the Earth's surface, enabling material-level understanding of land cover and ecosystem dynamics. Despite recent progress in hyperspectral self-supervised learning (SSL), existing datasets remain temporally shallow, limiting the development of long-horizon spatiotemporal modeling. To address this gap, we introduce ChronoEarth-492K, the first large-scale, temporally calibrated hyperspectral SSL dataset built upon NASA's EO-1 Hyperion mission, the world's longest continuous hyperspectral archive up to date (2001-2017). ChronoEarth-492K comprises 492,354 radiometrically harmonized patches across 185,398 global locations over 17 years, with 28,786 sites containing multi-temporal sequences ($\geq 3$ observations) that enable both short- and long-horizon temporal analysis. Building on this foundation, we establish the ChronoEarth-Benchmark, a unified evaluation suite spanning static, short-horizon, and long-horizon temporal tasks, constructed from six open-source geospatial products covering land cover, crop type, forest dynamics, and soil properties. We further introduce a standardized evaluation protocol and report extensive baseline results across state-of-the-art hyperspectral foundation models. Together, ChronoEarth and benchmark provide the first large-scale, temporally grounded platform for systematic spatiotemporal hyperspectral representation learning.
Editorial analysis
A structured set of objections, weighed in public.
Referee Report
Summary. The paper introduces ChronoEarth-492K, a large-scale hyperspectral Earth observation dataset derived from the NASA EO-1 Hyperion archive (2001-2017). It comprises 492,354 radiometrically harmonized patches across 185,398 global locations, with 28,786 sites providing multi-temporal sequences of at least three observations. The work also establishes the ChronoEarth-Benchmark, a unified evaluation suite for static, short-horizon, and long-horizon tasks drawn from six open geospatial products (land cover, crop type, forest dynamics, soil properties), along with a standardized protocol and baseline results on state-of-the-art hyperspectral foundation models.
Significance. If the radiometric harmonization is shown to produce temporally stable spectral values, the dataset would provide a valuable new resource for developing and evaluating long-horizon spatiotemporal models in hyperspectral self-supervised learning, addressing the current limitation of temporally shallow HSI datasets. The scale, global coverage, and inclusion of a multi-task benchmark with baselines represent a concrete contribution to the field.
major comments (1)
- [Dataset construction and harmonization process] The dataset construction description states that patches are 'radiometrically harmonized' to support direct temporal comparison across the 17-year span, yet no quantitative validation is provided (e.g., inter-annual variance reduction on pseudo-invariant sites, spectral angle mapper scores between same-location observations separated by multiple years, or residual calibration error metrics). This validation is load-bearing for the central claim that the 28,786 multi-temporal sites enable reliable long-horizon analysis without residual artifacts biasing SSL pretraining or benchmark evaluations.
minor comments (1)
- [Dataset statistics and site selection] Clarify the exact criteria used for site selection and the definition of 'multi-temporal sequences' (e.g., minimum temporal spacing) to allow reproducibility of the 28,786-site subset.
Simulated Author's Rebuttal
We thank the referee for their thorough review and positive evaluation of our work. We appreciate the recognition of the dataset's potential contribution to long-horizon spatiotemporal modeling in hyperspectral self-supervised learning. Below, we address the major comment point by point.
read point-by-point responses
-
Referee: The dataset construction description states that patches are 'radiometrically harmonized' to support direct temporal comparison across the 17-year span, yet no quantitative validation is provided (e.g., inter-annual variance reduction on pseudo-invariant sites, spectral angle mapper scores between same-location observations separated by multiple years, or residual calibration error metrics). This validation is load-bearing for the central claim that the 28,786 multi-temporal sites enable reliable long-horizon analysis without residual artifacts biasing SSL pretraining or benchmark evaluations.
Authors: We acknowledge that providing quantitative validation for the radiometric harmonization process is crucial to substantiate the reliability of the multi-temporal sequences for long-horizon analysis. While the manuscript describes the harmonization procedure in detail (Section 3.2), we agree that empirical validation metrics were not included. In the revised version, we will add a new subsection with quantitative assessments, including inter-annual variance reduction on pseudo-invariant sites, spectral angle mapper (SAM) scores for same-location observations over multiple years, and residual calibration error metrics. These will be computed using the available data and reported with corresponding figures and tables to demonstrate temporal stability. revision: yes
Circularity Check
No significant circularity: dataset curation paper with external grounding
full rationale
This is a data resource and benchmark paper whose central contribution is the assembly of 492k patches from the external NASA EO-1 Hyperion archive plus six open geospatial products. No equations, fitted parameters, self-referential predictions, or derivation chains appear in the provided text. The radiometric harmonization step is presented as a preprocessing choice applied to the external archive rather than a result derived from the paper's own outputs or self-citations. The evaluation suite is likewise constructed from independent open-source labels. The paper is therefore self-contained against external benchmarks with no load-bearing internal reductions.
Axiom & Free-Parameter Ledger
axioms (1)
- domain assumption NASA EO-1 Hyperion mission data from 2001-2017 constitutes a reliable, continuous hyperspectral archive suitable for multi-year analysis after harmonization.
Reference graph
Works this paper leans on
-
[1]
URL https: //arxiv.org/abs/2507.22291. Eya Cherif, Arthur Ouaknine, Luke A Brown, Phuong D Dao, Kyle R Kovach, Bing Lu, Daniel Mederer, Hannes Feilhauer, Teja Kattenborn, and David Rolnick. Greenhyperspectra: A multi- source hyperspectral dataset for global vegetation trait prediction.arXiv preprint arXiv:2507.06806,
work page internal anchor Pith review Pith/arXiv arXiv
-
[2]
doi: 10.1109/TGRS.2003.813206. Jon Dewitz. National land cover database (nlcd) 2019 products (ver. 3.0, february 2024).US Geological Survey (USGS) Data Release, page 624,
-
[3]
Corine land cover (clc) 2018, version 2020_20u1
European Environment Agency. Corine land cover (clc) 2018, version 2020_20u1. https://land. copernicus.eu/pan-european/corine-land-cover ,
work page 2018
-
[4]
Martin Hermann Paul Fuchs and Begüm Demir
Copernicus Land Monitoring Service, European Environment Agency. Martin Hermann Paul Fuchs and Begüm Demir. Hyspecnet-11k: A large-scale hyperspectral dataset for benchmarking learning-based hyperspectral image compression methods. InIGARSS 2023- 2023 IEEE International Geoscience and Remote Sensing Symposium, pages 1779–1782. IEEE,
work page 2023
-
[5]
URLhttps://www.mdpi.com/2072-4292/7/7/8830
ISSN 2072-4292. doi: 10.3390/rs70708830. URLhttps://www.mdpi.com/2072-4292/7/7/8830. Matthew C. Hansen, Peter V . Potapov, Rebecca Moore, Matt Hancher, Svetlana A. Turubanova, Alexandra Tyukavina, David Thau, Stephen V . Stehman, Scott J. Goetz, Thomas R. Love- land, Aruna Kommareddy, Alexey Egorov, Laura Chini, Christopher O. Justice, and John R. G. Town...
-
[6]
High-Resolution Global Maps of 21st-Century Forest Cover Change,
doi: 10.1126/science.1244693. Data available online at https://glad.earthengine.app/view/global-forest-change. Kaiming He, Xinlei Chen, Saining Xie, Yanghao Li, Piotr Dollár, and Ross Girshick. Masked autoencoders are scalable vision learners. InProceedings of the IEEE/CVF conference on computer vision and pattern recognition, pages 16000–16009,
-
[7]
URL https://arxiv.org/abs/2306.03831. Yin-Nian Liu, De-Xin Sun, Xiao-Ning Hu, Xiang Ye, Yun-Duan Li, Shu-Feng Liu, Kai-Qin Cao, Meng-Yang Chai, Wei-Yi-Nuo Zhou, Jing Zhang, Ying Zhang, Wei-Wei Sun, and Lei-Lei Jiao. The advanced hyperspectral imager: Aboard china’s gaofen-5 satellite.IEEE Geoscience and Remote Sensing Magazine, 7(4):23–32,
-
[8]
doi: 10.1109/MGRS.2019.2927687. R. Loizzo, R. Guarini, F. Longo, T. Scopa, R. Formaro, C. Facchinetti, and G. Varacalli. Prisma: The italian hyperspectral mission. InIGARSS 2018 - 2018 IEEE International Geoscience and Remote Sensing Symposium, pages 175–178,
-
[9]
Ilya Loshchilov and Frank Hutter
doi: 10.1109/IGARSS.2018.8518512. Ilya Loshchilov and Frank Hutter. Decoupled weight decay regularization.arXiv preprint arXiv:1711.05101,
-
[10]
doi: 10.1109/TGRS.2003.815018. 11 Linus Scheibenreif, Michael Mommert, and Damian Borth. Masked vision transformers for hyper- spectral image classification. InProceedings of the IEEE/CVF conference on computer vision and pattern recognition, pages 2166–2176,
- [11]
-
[12]
Gencer Sumbul, Marcela Charfuelan, Begüm Demir, and V olker Markl
URLhttps://api.semanticscholar.org/CorpusID:277066511. Gencer Sumbul, Marcela Charfuelan, Begüm Demir, and V olker Markl. Bigearthnet: A large- scale benchmark archive for remote sensing image understanding. InIGARSS 2019-2019 IEEE International Geoscience and Remote Sensing Symposium, pages 5901–5904. IEEE,
work page 2019
-
[13]
URL https://arxiv.org/abs/ 2412.02732. Romain Thoreau, Laurent Risser, Véronique Achard, Béatrice Berthelot, and Xavier Briottet. Toulouse hyperspectral data set: a benchmark data set to assess semi-supervised spectral rep- resentation learning and pixel-wise classification techniques.arXiv preprint arXiv:2311.08863,
-
[14]
Accessed: 2025-10-17. Di Wang, Meiqi Hu, Yao Jin, Yuchun Miao, Jiaqi Yang, Yichu Xu, Xiaolei Qin, Jiaqi Ma, Lingyu Sun, Chenxing Li, et al. Hypersigma: Hyperspectral intelligence comprehension foundation model. IEEE Transactions on Pattern Analysis and Machine Intelligence,
work page 2025
- [15]
-
[16]
J. Yang and X. Huang. The 30 m annual land cover dataset and its dynamics in china from 1990 to 2019.Earth System Science Data, 13(8):3907–3925,
work page 1990
-
[17]
URLhttps://essd.copernicus.org/articles/13/3907/2021/
doi: 10.5194/essd-13-3907-2021. URLhttps://essd.copernicus.org/articles/13/3907/2021/. Naoto Yokoya, Pedram Ghamisi, Ronny Hänsch, and Michael Schmitt. 2020 ieee grss data fusion con- test: Global land cover mapping with weak supervision [technical committees].IEEE Geoscience and Remote Sensing Magazine, 8(1):154–157,
-
[18]
13 A Additional Related Works Remote Sensing Representations.Most multispectral geospatial foundation models build upon Vision Transformers (ViT) with modified patch embedding layers to accommodate multi-band inputs [Manas et al., 2021, Hong et al., 2024, Fuller et al., 2024]. While effective for MSI with around 10 bands, directly projecting high-dimensio...
work page 2021
-
[19]
University of Maryland / Google Earth Engine7 CC-BY 4.0 B.1.2 Benchmark labels For each dataset under our benchmark, task-specific metadata files are provided at benchmark_labels/<dataset>/<dataset>_<task_type>.parquet where task_type denotes the evaluation protocol and can be static, sh (short-horizon), or lh (long-horizon). These metadata tables record ...
work page 2003
-
[20]
ChronoEarth contains no personally identifiable information, as all data originates from satellite-based Earth observation products. ChronoEarth-492K and the ChronoEarth- Benchmark will be released under an open academic license permitting non-commercial research use. B.3 Long-Term Reproducibility. To facilitate verification and future extensions, we rele...
-
[21]
D.1 CDL: Crop Type Segmentation The Cropland Data Layer (CDL) [Boryan et al., 2011] is an annual 30m crop classification product published by the USDA National Agricultural Statistics Service since
work page 2011
-
[22]
It defines up to 254 land-cover and crop categories, including cultivated crops and non-agricultural surfaces. According to USDA validation reports, CDL achieves 85–95% accuracy for major crops, with reduced reliability for minor or region-specific classes. For this work, we use CDL maps from 2008 to 2017 and align them with EO-1 Hyperion acquisitions acc...
work page 2008
-
[23]
This spatial distribution shift makes CDL a particularly challenging task in our benchmark
The figure reveals a substantial geographic separation between the trainval and test sets, which results in noticeable differences in their label distributions. This spatial distribution shift makes CDL a particularly challenging task in our benchmark. D.2 CLCD: Land Cover Segmentation The China Land-Cover Dataset (CLCD) [Yang and Huang, 2021] is an annua...
work page 2021
-
[24]
Although the label distribution shift is less pronounced than in CDL, noticeable differences remain. Spatially, the test set contains more samples from western China, whereas the trainval set is more concentrated in eastern China. 5 Figure 7: Label and spatial distribution per split for static NLCD-S dataset. D.3 NLCD: Land Cover Segmentation The Annual N...
work page 2021
-
[25]
Compared with CDL and CLCD, the label distributions between the trainval and test splits are relatively well matched. The spatial distributions are also more balanced, with both splits covering similar geographic regions. D.4 ISDASoil: Soil Texture Fraction Prediction. The ISDASoil Africa v1 soil texture map [Hengl et al., 2021] provides topsoil (0–20cm) ...
work page 2021
-
[26]
Because the CORINE map has a coarser spatial resolution than the 30m EO-1 Hyperion imagery, we construct a multi-label land-cover classification benchmark in which each Hyperion patch is annotated with the set of CLC classes intersecting its footprint. To ensure temporal consistency, Hyperion acquisitions are aligned to the nearest available CLC epoch: 20...
work page 2001
-
[27]
The resulting dataset comprises 19,774 spatially aligned and temporally associated image–label pairs from 9,706 unique locations and 10,905 unique labels. Following prior work [Braham et al., 2025], we map the original 44 CLC classes to 19 aggregated categories according to the BigEarthNet taxonomy [Sumbul et al., 2019]. This dataset extends our benchmark...
work page 2025
-
[28]
We utilize this annual forest loss layer to construct a change detection benchmark
The product includes an annual forest loss layer, where each pixel indicates the year that deforestation happened. We utilize this annual forest loss layer to construct a change detection benchmark. For each location with multiple EO-1 Hyperion observations across different years, we examine the corresponding GFC loss-year labels to determine whether a fo...
work page 2021
discussion (0)
Sign in with ORCID, Apple, or X to comment. Anyone can read and Pith papers without signing in.