Evaluating the skill of a geometric early warning for tipping in a rapidly forced nonlinear system
Pith reviewed 2026-05-19 18:40 UTC · model grok-4.3
The pith
A geometric early warning based on signed distance to an approximate R-tipping threshold predicts future states in rapidly forced systems better than simple thresholds.
A machine-rendered reading of the paper's core claim, the machinery that carries it, and where it could break.
Core claim
In a 3-box model of the AMOC subject to specified rapid forcing, the geometric early warning given by the signed distance to an approximate R-tipping threshold that embeds the system dynamics and future forcing profile compares favourably in skill with simple thresholds for predicting the future state of the system.
What carries the argument
The R-tipping indicator, defined as the signed distance to an approximate R-tipping threshold constructed from the system dynamics and the specified future forcing profile.
If this is right
- The indicator can flag sensitive intervals when forcing changes most rapidly and the system is near a basin boundary.
- It supplies a forecast that accounts for the planned future forcing rather than reacting only to current state.
- The approach remains useful precisely in regimes where bifurcation-based early warnings based on slow parameter drift are uninformative.
- Direct comparison on the same model trajectories shows the geometric method has higher skill than threshold-based alternatives.
Where Pith is reading between the lines
- The same distance-to-threshold construction could be applied to observational time series of the real AMOC if a plausible future forcing scenario is assumed.
- Combining the indicator with ensemble forecasts of forcing uncertainty would test how sensitive the warning is to errors in the future profile.
- The method might extend naturally to other rate-dependent tipping problems in ecology or engineered systems where the forcing trajectory is known in advance.
Load-bearing premise
An approximate R-tipping threshold built from the system dynamics and the given future forcing profile can be computed accurately enough to serve as a reliable early-warning distance without exhaustive sampling of natural fluctuations.
What would settle it
Numerical experiments in the 3-box AMOC model across several rapid forcing profiles in which the geometric indicator does not achieve higher prediction skill than simple thresholds for the final state.
Figures


read the original abstract
The future behavioural fate of a forced nonlinear system can depend sensitively on the forcing profile as well as natural fluctuations within the system. This is especially the case for rate-induced tipping, where the forcing pushes the system to a basin boundary of a future behaviour and small changes in the forcing can lead to drastically different eventual behaviours. This sensitivity may be present only for a limited period of time, for example when the forcing is most rapidly changing. Moreover, critical slowing down based methods fail to be informative in such cases. We investigate a geometric early warning to evaluate when a system is in such a sensitive state. This involves computing the R-tipping indicator, namely the signed distance to an approximate R-tipping threshold. The latter is a dynamic state that embeds knowledge of the system and future behaviour of the forcing. We contrast this with early warnings of bifurcation-induced tipping, where tipping is associated with passing a threshold on slow variation of forcing. As an example, we consider methods of early prediction of the future state for a 3-box model of the Atlantic Meridional Overturning Circulation (AMOC) with specified rapid forcing. We show that the skill of the geometric early warning compares favourably with simple thresholds.
Editorial analysis
A structured set of objections, weighed in public.
Referee Report
Summary. The manuscript proposes a geometric early warning indicator for rate-induced tipping (R-tipping) in rapidly forced nonlinear systems. The indicator is the signed distance to an approximate R-tipping threshold constructed from the vector field and the prescribed future forcing profile. In a 3-box AMOC model with specified rapid forcing, the paper claims this geometric indicator exhibits better predictive skill for the eventual system state than simple thresholds, particularly where critical slowing down methods fail due to the short sensitive window.
Significance. If the central claim holds under stochastic perturbations, the geometric approach could fill an important gap in early-warning methods for R-tipping events, where traditional bifurcation-based indicators are uninformative. The explicit comparison against simple thresholds supplies a useful baseline, and the embedding of future forcing knowledge is a deliberate modeling choice that enables the signed-distance construction. However, the practical value hinges on the unquantified robustness of the threshold approximation.
major comments (2)
- [Methods] Methods section on threshold construction: the approximate R-tipping threshold is defined to incorporate the exact future forcing profile, but no error bound, sensitivity analysis, or Monte-Carlo sampling is reported that quantifies how often the sign of the signed-distance indicator flips under realistic levels of natural fluctuations. This directly affects whether the claimed skill advantage over simple thresholds survives in the presence of noise.
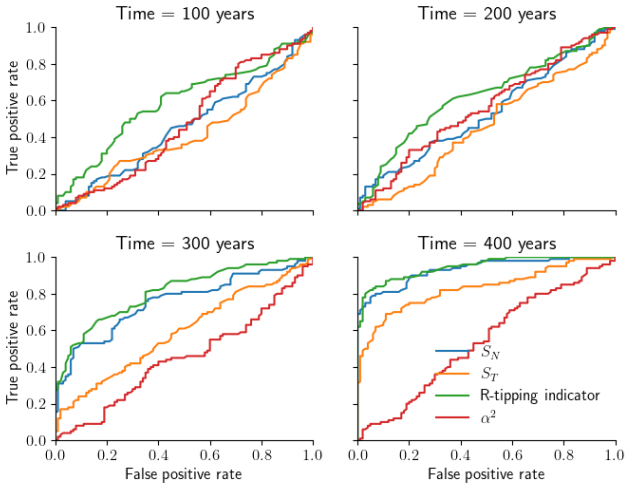
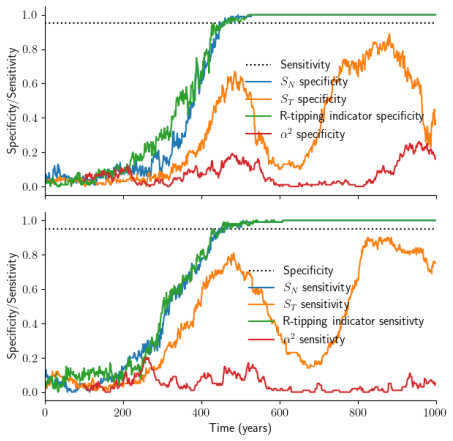
- [Results] Results section on skill comparison: the abstract and results assert that the geometric early warning 'compares favourably' with simple thresholds, yet the manuscript provides no quantitative skill scores (e.g., ROC-AUC, hit rates with error bars, or cross-validation metrics) or details on how the approximate threshold is validated against the true basin boundary.
minor comments (2)
- [Introduction] Notation for the signed distance and the R-tipping threshold should be introduced with an explicit equation number and a short derivation sketch to improve readability for readers unfamiliar with geometric methods in dynamical systems.
- [Figures] Figure captions for the AMOC model trajectories should specify the exact functional form and parameter values of the rapid forcing profile used in each panel.
Simulated Author's Rebuttal
We thank the referee for their constructive and detailed review. We address the major comments point by point below.
read point-by-point responses
-
Referee: [Methods] Methods section on threshold construction: the approximate R-tipping threshold is defined to incorporate the exact future forcing profile, but no error bound, sensitivity analysis, or Monte-Carlo sampling is reported that quantifies how often the sign of the signed-distance indicator flips under realistic levels of natural fluctuations. This directly affects whether the claimed skill advantage over simple thresholds survives in the presence of noise.
Authors: The present manuscript examines the deterministic 3-box AMOC model with a fully prescribed rapid forcing profile, as described in the methods and results sections. The geometric indicator is constructed using this known future forcing, and its skill is assessed in the noise-free setting. We agree that quantifying robustness under stochastic perturbations would require additional analysis (e.g., Monte-Carlo sampling of sign flips), but such an extension lies beyond the scope of the current deterministic study. We have added a paragraph in the discussion section acknowledging this limitation and identifying stochastic robustness as a direction for future work. revision: partial
-
Referee: [Results] Results section on skill comparison: the abstract and results assert that the geometric early warning 'compares favourably' with simple thresholds, yet the manuscript provides no quantitative skill scores (e.g., ROC-AUC, hit rates with error bars, or cross-validation metrics) or details on how the approximate threshold is validated against the true basin boundary.
Authors: We thank the referee for highlighting this point. The original manuscript relies on visual trajectory comparisons and qualitative statements of favourable performance. In the revised version we have added a new subsection to the results that reports quantitative skill metrics, including ROC-AUC values computed across an ensemble of initial conditions together with bootstrapped error bars. We have also included an explicit description of the validation procedure, in which the approximate R-tipping threshold is compared against the true basin boundary obtained by long forward integrations that classify eventual system states. revision: yes
Circularity Check
No significant circularity; derivation self-contained via explicit model-based definition and external benchmark comparison
full rationale
The paper defines the geometric early warning explicitly as the signed distance to an approximate R-tipping threshold constructed from the system vector field and prescribed future forcing profile. This construction is presented as an intentional modeling choice for rate-induced tipping scenarios where critical slowing down fails. The central claim evaluates the indicator's skill by direct comparison to simple thresholds in simulations of the 3-box AMOC model. No load-bearing step reduces by construction to its own inputs, no parameter is fitted to a data subset and then renamed as a prediction, and no uniqueness theorem or ansatz is imported via self-citation. The comparison supplies an independent reference, rendering the result self-contained against external benchmarks within the model.
Axiom & Free-Parameter Ledger
Reference graph
Works this paper leans on
-
[1]
Jackson, Courtney Quinn, and Richard A
Hassan Alkhayuon, Peter Ashwin, Laura C. Jackson, Courtney Quinn, and Richard A. Wood. Basin bifurcations, oscillatory instability and rate-induced thresholds for atlantic meridional overturning circulation in a global oceanic box model.Proceedings of the Royal Society A: Mathematical, Physical and Engineering Sciences, 475(2225):20190051, 2019
work page 2019
-
[2]
Hassan M Alkhayuon and Peter Ashwin. Rate-induced tipping from periodic attractors: Partial tipping and connecting orbits.Chaos: An Interdisciplinary Journal of Nonlinear Science, 28(3), 2018
work page 2018
-
[3]
Peter Ashwin, Robbin Bastiaansen, Anna S. von der Heydt, and Paul D.L. Ritchie. Early warning skill, extrapolation and tipping for accelerating cascades.Proceedings of the Royal Society A: Mathematical, Physical and Engineering Sciences, 481(2321), 2025
work page 2025
-
[4]
Peter Ashwin and Julian Newman. Physical invariant measures and tipping probabilities for chaotic attractors of asymptotically autonomous systems.The European Physical Journal Special Topics, 230(16):3235–3248, 2021
work page 2021
-
[5]
Peter Ashwin, Julian Newman, and Raphael R¨ omer. Contrasting chaotic and stochastic forcing: Tipping windows and attractor crises.SIAM Journal on Applied Dynamical Systems, 24(1):277–316, 2025
work page 2025
-
[6]
Peter Ashwin, Clare Perryman, and Sebastian Wieczorek. Parameter shifts for nonau- tonomous systems in low dimension: bifurcation-and rate-induced tipping.Nonlinearity, 30(6):2185, 2017
work page 2017
-
[7]
Peter Ashwin, Sebastian Wieczorek, Renato Vitolo, and Peter Cox. Tipping points in open systems: bifurcation, noise-induced and rate-dependent examples in the climate system.Philosophical Transactions of the Royal Society A: Mathematical, Physical and Engineering Sciences, 370(1962):1166–1184, 2012
work page 1962
- [8]
-
[9]
Chapman, Peter Ashwin, Jonathan Baker, and Richard A
Ruth R. Chapman, Peter Ashwin, Jonathan Baker, and Richard A. Wood. Quanti- fying risk of a noise-induced amoc collapse from northern and tropical atlantic ocean variability.Environmental Research Communications, 6(11):111003, 2024
work page 2024
-
[10]
Chapman, Peter Ashwin, and Richard A
Ruth R. Chapman, Peter Ashwin, and Richard A. Wood. Quantifying tipping behavior: Geometric early warnings and quasipotentials for a box model of amoc.Chaos: An Interdisciplinary Journal of Nonlinear Science, 35(2):023164, 02 2025. 25
work page 2025
-
[11]
Joseph Clarke, Chris Huntingford, Paul Ritchie, and Peter Cox. The compost bomb instability in the continuum limit.The European Physical Journal Special Topics, 230(16):3335–3341, 2021
work page 2021
-
[12]
Joseph Clarke, Chris Huntingford, Paul D.L. Ritchie, and Peter Cox. Conditions for skilful spatial and temporal tipping point early warning signals. (submitted), 2026
work page 2026
-
[13]
Boulton, Joshua E Buxton, Jesse F
Vasilis Dakos, Chris A. Boulton, Joshua E Buxton, Jesse F. Abrams, Beatriz Arellano- Nava, David I. Armstrong McKay, Sebastian Bathiany, Lana Blaschke, Niklas Boers, Daniel Dylewsky, et al. Tipping point detection and early warnings in climate, ecological, and human systems.Earth System Dynamics, 15(4):1117–1135, 2024
work page 2024
-
[14]
Ecosystem tipping points in an evolving world.Nature ecology & evolution, 3(3):355–362, 2019
Vasilis Dakos, Blake Matthews, Andrew P Hendry, Jonathan Levine, Nicolas Loeuille, Jon Norberg, Patrik Nosil, Marten Scheffer, and Luc De Meester. Ecosystem tipping points in an evolving world.Nature ecology & evolution, 3(3):355–362, 2019
work page 2019
-
[15]
Van Nes, Victor Brovkin, Vladimir Petoukhov, and Hermann Held
Vasilis Dakos, Marten Scheffer, Egbert H. Van Nes, Victor Brovkin, Vladimir Petoukhov, and Hermann Held. Slowing down as an early warning signal for abrupt climate change.Proceedings of the National Academy of Sciences, 105(38):14308–14312, 2008
work page 2008
-
[16]
Jes´ us Due˜ nas, Iacopo P. Longo, and Rafael Obaya. Rate-induced tracking for concave or d-concave transitions in a time-dependent environment with application in ecology. Chaos: An Interdisciplinary Journal of Nonlinear Science, 33(12), 2023
work page 2023
-
[17]
An introduction to ROC analysis.Pattern recognition letters, 27(8):861– 874, 2006
Tom Fawcett. An introduction to ROC analysis.Pattern recognition letters, 27(8):861– 874, 2006
work page 2006
-
[18]
Ulrike Feudel. Rate-induced tipping in ecosystems and climate: the role of unstable states, basin boundaries and transient dynamics.Nonlinear Processes in Geophysics, 30(4):481–502, 2023
work page 2023
-
[19]
Deep learning for predicting rate-induced tipping.Nature Machine Intelligence, 6:1556–1565, 2024
Yu Huang, Sebastian Bathiany, Peter Ashwin, and Niklas Boers. Deep learning for predicting rate-induced tipping.Nature Machine Intelligence, 6:1556–1565, 2024
work page 2024
-
[20]
Laura C. Jackson, Eduardo Alastru´ e de Asenjo, Katinka Bellomo, Gokhan Danabasoglu, Helmuth Haak, Aixue Hu, Johann Jungclaus, Warren Lee, Virna L Meccia, Oleg Saenko, et al. Understanding amoc stability: The North Atlantic hosing model intercomparison project.Geoscientific Model Development, 16(7):1975–1995, 2023
work page 1975
-
[21]
Timothy M. Lenton. Early warning of climate tipping points.Nature climate change, 1(4):201–209, 2011
work page 2011
-
[22]
Lenton, Hermann Held, Elmar Kriegler, Jim W
Timothy M. Lenton, Hermann Held, Elmar Kriegler, Jim W. Hall, Wolfgang Lucht, Stefan Rahmstorf, and Hans Joachim Schellnhuber. Tipping elements in the Earth’s climate system.Proceedings of the National Academy of Sciences, 105(6):1786–1793, 2008. 26
work page 2008
-
[23]
Hansen, Alessandro Lovo, Ruth Chapman, Freddy Bouchet, and Valerio Lucarini
Johannes Lohmann, Alfred B. Hansen, Alessandro Lovo, Ruth Chapman, Freddy Bouchet, and Valerio Lucarini. The role of edge states for early warning of tipping points.Proceedings of the Royal Society A: Mathematical, Physical and Engineering Sciences, 481(2312), 2025
work page 2025
-
[24]
Johannes Lohmann, Bert Wuyts, Peter D. Ditlevsen, and Peter Ashwin. On the pre- dictability of possible storylines for forced complex systems.Journal of Physics: Com- plexity, 5(3):035015, sep 2024
work page 2024
-
[25]
Armstrong McKay, Arie Staal, Jesse F
David I. Armstrong McKay, Arie Staal, Jesse F. Abrams, Ricarda Winkelmann, Boris Sakschewski, Sina Loriani, Ingo Fetzer, Sarah E. Cornell, Johan Rockstr¨ om, and Tim- othy M. Lenton. Exceeding 1.5°c global warming could trigger multiple climate tipping points.Science, 377(6611):eabn7950, 2022
work page 2022
-
[26]
Paul Ritchie, ¨Ozkan Karabacak, and Jan Sieber. Inverse-square law between time and amplitude for crossing tipping thresholds.Proceedings of the Royal Society A: Mathe- matical, Physical and Engineering Sciences, 475(2222), 2019
work page 2019
-
[27]
Paul Ritchie and Jan Sieber. Early-warning indicators for rate-induced tipping.Chaos: An Interdisciplinary Journal of Nonlinear Science, 26(9):093116, 2016
work page 2016
-
[28]
Paul. Ritchie and Jan Sieber. Probability of noise- and rate-induced tipping.Phys. Rev. E, 95:052209, 2017
work page 2017
-
[29]
Ritchie, Hassan Alkhayuon, Peter M
Paul D.L. Ritchie, Hassan Alkhayuon, Peter M. Cox, and Sebastian Wieczorek. Rate- induced tipping in natural and human systems.Earth System Dynamics, 14(3):669–683, 2023
work page 2023
-
[30]
Paul D.L. Ritchie, Joseph J. Clarke, Peter M. Cox, and Chris Huntingford. Overshooting tipping point thresholds in a changing climate.Nature, 592(7855):517–523, 2021
work page 2021
-
[31]
Anastasia Romanou, David Rind, Jeff Jonas, Ron Miller, Maxwell Kelley, Gary Russell, Clara Orbe, Larissa Nazarenko, Rebecca Latto, and Gavin A. Schmidt. Stochastic bifurcation of the North Atlantic circulation under a midrange future climate scenario with the NASA-GISS ModelE.Journal of Climate, 36(18):6141 – 6161, 2023
work page 2023
-
[32]
Marten Scheffer, Stephen R. Carpenter, Timothy M. Lenton, Jordi Bascompte, William Brock, Vasilis Dakos, Johan Van de Koppel, Ingrid A. Van de Leemput, Simon A. Levin, Egbert H. Van Nes, et al. Anticipating critical transitions.science, 338(6105):344–348, 2012
work page 2012
-
[33]
Van Nes, Milena Holmgren, and Terry Hughes
Marten Scheffer, Egbert H. Van Nes, Milena Holmgren, and Terry Hughes. Pulse-driven loss of top-down control: the critical-rate hypothesis.Ecosystems, 11(2):226–237, 2008
work page 2008
-
[34]
Katherine Slyman and Christopher K. Jones. Rate and noise-induced tipping working in concert.Chaos: An Interdisciplinary Journal of Nonlinear Science, 33(1):013119, 01 2023. 27
work page 2023
-
[35]
Robin S. Smith. The FAMOUS climate model (versions XFXWB and XFHCC): de- scription update to version XDBUA.Geoscientific Model Development, 5(1):269–276, 2012
work page 2012
-
[36]
An adaptive dynam- ical model of default contagion.Quantitative Finance, 22(7):1217–1227, 2022
Damian Smug, Julian Ashwin, Peter Ashwin, and Didier Sornette. An adaptive dynam- ical model of default contagion.Quantitative Finance, 22(7):1217–1227, 2022
work page 2022
-
[37]
On brain stimulation in epilepsy.Brain, 148(3):746–752, 2025
Andrew J Trevelyan, Victoria S Marks, Robert T Graham, Timothy Denison, Andrew Jackson, and Elliot H Smith. On brain stimulation in epilepsy.Brain, 148(3):746–752, 2025
work page 2025
-
[38]
Bregje van der Bolt, Egbert H. van Nes, and Marten Scheffer. No warning for slow transitions.Journal of the Royal Society Interface, 18(176), 2021
work page 2021
-
[39]
Rate-induced tipping: Thresholds, edge states and connecting orbits.Nonlinearlity, 36(6), 2023
Sebastian Wieczorek, Chun Xie, and Peter Ashwin. Rate-induced tipping: Thresholds, edge states and connecting orbits.Nonlinearlity, 36(6), 2023
work page 2023
-
[40]
Richard A. Wood, Jos´ e M. Rodr´ ıguez, Robin S. Smith, Laura C. Jackson, and Ed Hawkin. Observable, low-order dynamical controls on thresholds of the atlantic meridional overturning circulation.Climate Dynamics, 53:6815–6834, 2019. 28 A Numerical approximation of the R-tipping thresh- old We briefly outline the process for calculating the time evolution ...
work page 2019
-
[41]
correspond to doubledCO 2, based on FAMOUSB runs [35] 30 Parameter Meaning Value Units H0 Initial freshwater hosing level 0 - Hmax Maximum freshwater hosing level 0.38 - Trise Linear ramp up duration of freshwater hosing 100 yr Tf all Linear ramp down duration of freshwater hosing 200 yr Tplat Duration of freshwater hosing at maximum level 300 yr σ Noise ...
discussion (0)
Sign in with ORCID, Apple, or X to comment. Anyone can read and Pith papers without signing in.