Bi-Level Chaotic Fusion Based Graph Convolutional Network for Stock Market Prediction Interval
Pith reviewed 2026-05-21 00:30 UTC · model grok-4.3
The pith
A bi-level chaotic fusion graph model produces tighter and better-calibrated prediction intervals for stock prices than standard LSTM, GRU, and GCN baselines.
A machine-rendered reading of the paper's core claim, the machinery that carries it, and where it could break.
Core claim
The central claim is that embedding stock relationships in a graph, fusing chaotic nonlinear transformations at two levels to set interval bounds, and gating the temporal updates by volatility produces prediction intervals that are simultaneously sharp and well-calibrated for financial time series.
What carries the argument
Bi-level chaotic fusion inside graph convolutional layers, which uses two distinct nonlinear transformation functions to estimate the center and width of each prediction interval together with a volatility-aware gating mechanism that conditions the recurrence on the prevailing market regime.
Where Pith is reading between the lines
- The same fusion-plus-gating pattern could be tested on other networked financial series such as commodity prices or currency pairs where assets also influence one another.
- Adding macroeconomic nodes to the graph might let the intervals reflect external shocks without changing the core training objective.
- Real-time deployment on live order-book data would reveal whether the interval widths remain useful for setting dynamic risk limits during intraday trading.
Load-bearing premise
That the graph of 43 selected stocks and the volatility patterns observed between 2016 and 2026 are representative enough for the fusion and gating steps to generalize without overfitting to that particular market slice.
What would settle it
Retraining the model on an earlier decade (for example 2005-2015) or on a different exchange and finding that the Winkler score and coverage advantages disappear or lose statistical significance would falsify the claim that the architecture reliably captures regime-dependent dependencies.
Figures



read the original abstract
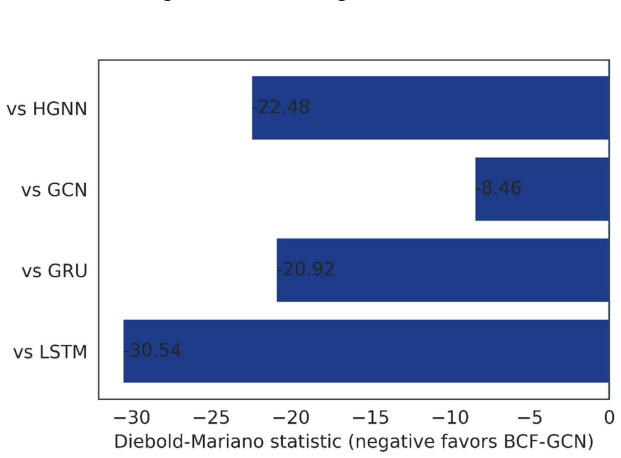
Financial market forecasting is inherently uncertain, yet most deep learning approaches rely on point predictions that provide only single-value estimates without quantifying uncertainty. Such predictions are insufficient for risk-aware decision-making, as they fail to capture the range of possible outcomes and the associated confidence of forecasts.The problem can be solved using prediction intervals, which allow obtaining an upper and lower bound for the prediction, thus enabling uncertainty representation in the model. Yet, the current methods tend to disregard relationships between assets or cannot simultaneously ensure good calibration and sharpness of the resulting intervals in dynamically changing market regimes. In our work, we propose a spatio-temporal graph-based approach with a bi-level chaotic fusion technique to solve this problem. Our model uses separate nonlinear transformation functions to estimate the interval center and width. Additionally, a volatility-aware gating mechanism is used to make predictions dependent on the regime in which the market operates. Temporal dependencies are considered by embedding graph structures and sequentially modeling them. Training is conducted according to a Lower-Upper Bound Estimation (LUBE) objective. Our experimental results show significant improvements compared to existing baselines (LSTM, GRU, GCN, HGNN) when applied to data from 2016 to 2026 with 43 leading companies in eight sectors of the NSE. It provides the lowest Winkler score (0.0778), tightest prediction intervals (PIAW = 0.1407), and highest coverage (PICP = 96.6%), with all differences statistically significant (p < 0.001) according to the Diebold-Mariano test.
Editorial analysis
A structured set of objections, weighed in public.
Referee Report
Summary. The manuscript presents a Bi-Level Chaotic Fusion Based Graph Convolutional Network for generating prediction intervals in stock market forecasting. The model incorporates graph structures to capture inter-asset relationships, uses nonlinear transformations for interval center and width, a volatility-aware gating mechanism for regime dependence, and is trained using the Lower-Upper Bound Estimation (LUBE) objective. Experiments on data from 43 leading companies in the NSE from 2016 to 2026 demonstrate improved performance over baselines like LSTM, GRU, GCN, and HGNN, with the lowest Winkler score of 0.0778, PIAW of 0.1407, PICP of 96.6%, and statistically significant differences (p < 0.001) per the Diebold-Mariano test.
Significance. If the empirical results are robust to proper temporal validation and graph construction without lookahead bias, this work could contribute to better uncertainty quantification in financial time series by integrating spatio-temporal modeling with chaotic fusion and regime-aware gating. The approach addresses a relevant problem in risk-aware decision making.
major comments (3)
- [Experimental Setup] The paper does not specify how the graph adjacency matrix is constructed. If it is based on correlations computed over the full 2016-2026 period, this would introduce lookahead bias, as future data informs the graph used for earlier time steps, potentially inflating the reported PICP and sharpness metrics.
- [Results] No error bars, standard deviations, or confidence intervals are provided for the reported metrics (Winkler score, PIAW, PICP). This makes it difficult to evaluate the practical significance of the improvements and the reliability of the Diebold-Mariano test results.
- [Methods] There is no discussion of data leakage prevention, such as using rolling window validation or ensuring the graph is constructed only on training data. This is critical for time series forecasting claims.
minor comments (2)
- [Abstract] The abstract mentions 'bi-level chaotic fusion technique' but does not provide a brief explanation of what this entails.
- [Notation] The definitions of interval center and width transformations could be clarified with equations for better reproducibility.
Simulated Author's Rebuttal
We thank the referee for their constructive and detailed feedback. The comments highlight important aspects of temporal integrity and reporting that we will address through revisions to strengthen the manuscript. We respond to each major comment below.
read point-by-point responses
-
Referee: [Experimental Setup] The paper does not specify how the graph adjacency matrix is constructed. If it is based on correlations computed over the full 2016-2026 period, this would introduce lookahead bias, as future data informs the graph used for earlier time steps, potentially inflating the reported PICP and sharpness metrics.
Authors: We agree that the manuscript should have explicitly described the adjacency matrix construction to preclude any concern of lookahead bias. In our experiments the graph was formed using Pearson correlations computed only on the training window data for each prediction step, with edges retained above a fixed threshold. We will revise the Methods section to provide the precise construction formula, the threshold value, and confirmation that the process is repeated independently for every training fold using exclusively in-sample observations. revision: yes
-
Referee: [Results] No error bars, standard deviations, or confidence intervals are provided for the reported metrics (Winkler score, PIAW, PICP). This makes it difficult to evaluate the practical significance of the improvements and the reliability of the Diebold-Mariano test results.
Authors: This observation is correct and we will remedy it. The original experiments were repeated across five independent random seeds; we will now report mean values accompanied by standard deviations for all metrics and will add these statistics to the result tables. We will also include a brief discussion of the observed variability to support interpretation of the Diebold-Mariano test outcomes. revision: yes
-
Referee: [Methods] There is no discussion of data leakage prevention, such as using rolling window validation or ensuring the graph is constructed only on training data. This is critical for time series forecasting claims.
Authors: We acknowledge that an explicit description of leakage-prevention measures was omitted. Our protocol uses a rolling-window scheme in which both the training set and the adjacency matrix are updated at each step using only data available up to the end of the current training window. We will add a dedicated subsection in Experimental Setup that details the window length, stride, and the per-window graph reconstruction procedure, thereby documenting that temporal ordering is strictly preserved. revision: yes
Circularity Check
No circularity: derivation chain self-contained against external benchmarks
full rationale
The abstract and described methods introduce a GCN-based model with bi-level chaotic fusion, volatility-aware gating, and LUBE training objective to produce prediction intervals. Standard evaluation metrics (Winkler score, PIAW, PICP) are applied post-training on held-out data from 2016-2026 NSE stocks, with comparisons to baselines. No equations or steps are visible that define a quantity in terms of itself, rename a fitted parameter as a prediction, or reduce the central claim to a self-citation chain. The graph construction and temporal modeling are presented as independent architectural choices whose performance is externally falsifiable via the reported statistical tests. This is the common honest finding for papers whose core contribution is an empirical architecture rather than a closed-form derivation.
Axiom & Free-Parameter Ledger
free parameters (2)
- nonlinear transformation functions for interval center and width
- volatility-aware gating parameters
axioms (1)
- domain assumption Graph structures derived from asset relationships capture relevant spatio-temporal dependencies in stock returns
invented entities (1)
-
bi-level chaotic fusion technique
no independent evidence
Lean theorems connected to this paper
-
IndisputableMonolith/Cost/FunctionalEquation.leanwashburn_uniqueness_aczel unclear?
unclearRelation between the paper passage and the cited Recognition theorem.
logistic chaotic transformation ... r ∈ [3.57,4.0] ... tent map ... volatility-aware gating mechanism ... LUBE loss
-
IndisputableMonolith/Foundation/AlexanderDuality.leanalexander_duality_circle_linking unclear?
unclearRelation between the paper passage and the cited Recognition theorem.
adjacency matrix Aij=1 if |Corr(ri,rj)|≥0.30 ... GCN layers ... LSTM on chaotic embeddings
What do these tags mean?
- matches
- The paper's claim is directly supported by a theorem in the formal canon.
- supports
- The theorem supports part of the paper's argument, but the paper may add assumptions or extra steps.
- extends
- The paper goes beyond the formal theorem; the theorem is a base layer rather than the whole result.
- uses
- The paper appears to rely on the theorem as machinery.
- contradicts
- The paper's claim conflicts with a theorem or certificate in the canon.
- unclear
- Pith found a possible connection, but the passage is too broad, indirect, or ambiguous to say the theorem truly supports the claim.
Reference graph
Works this paper leans on
-
[1]
Dewolf, N., Baets, B. D., & Waegeman, W. (2023). Valid prediction intervals for regression problems. Artificial Intelligence Review, 56(1), 577-613
work page 2023
-
[2]
Tian, Q., Nordman, D. J., & Meeker, W. Q. (2022). Methods to compute prediction intervals: A review and new results. Statistical Science, 37(4), 580-597
work page 2022
-
[3]
Yadav, N., Chakraborty, N., & Tewari, A. (2022). Interval prediction machine learning models for predicting experimental thermal conductivity of high entropy alloys. Computational Materials Science, 214, 111754
work page 2022
-
[4]
S., Chen, Y ., Wei, Z., & Pham, V
Borah, M., Gayan, A., Sharma, J. S., Chen, Y ., Wei, Z., & Pham, V . T. (2022). Is fractional-order chaos theory the new tool to model chaotic pandemics as Covid- 19?. Nonlinear dynamics, 109(2), 1187-1215
work page 2022
-
[5]
Liang, F., Qian, C., Yu, W., Griffith, D., & Golmie, N. (2022). Survey of graph neural networks and applications. Wireless Communications and Mobile Computing, 2022(1), 9261537
work page 2022
-
[6]
Borenstein, M. (2023). How to understand and report heterogeneity in a meta- analysis: the difference between I-squared and prediction intervals. Integrative Medicine Research, 12(4), 101014
work page 2023
-
[7]
Roy, M. H., & Larocque, D. (2020). Prediction intervals with random forests. Statistical Methods in Medical Research, 29(1), 205-229
work page 2020
-
[8]
Kivaranovic, D., Johnson, K. D., & Leeb, H. (2020, June). Adaptive, distribution-free prediction intervals for deep networks. In International Conference on Artificial Intelligence and Statistics (pp. 4346-4356). PMLR
work page 2020
-
[9]
Zhang, H., Zimmerman, J., Nettleton, D., & Nordman, D. J. (2020). Random forest prediction intervals. The American Statistician
work page 2020
-
[10]
Xie, R., Barber, R. F., & Candès, E. J. (2024). Boosted conformal prediction intervals. Advances in Neural Information Processing Systems, 37, 71868-71899
work page 2024
-
[11]
Grushka-Cockayne, Y ., & Jose, V . R. R. (2020). Combining prediction intervals in the M4 competition. International Journal of Forecasting, 36(1), 178-185
work page 2020
-
[12]
Elder, B., Arnold, M., Murthi, A., & Navrátil, J. (2021, May). Learning prediction intervals for model performance. In Proceedings of the AAAI Conference on Artificial Intelligence (V ol. 35, No. 8, pp. 7305-7313)
work page 2021
-
[13]
Gupta, V ., Jung, C., Noarov, G., Pai, M. M., & Roth, A. (2021). Online multivalid learning: Means, moments, and prediction intervals. arXiv preprint arXiv:2101.01739
-
[14]
Zhao, C., Wan, C., & Song, Y . (2021). Cost-oriented prediction intervals: On bridging the gap between forecasting and decision. IEEE Transactions on Power Systems, 37(4), 3048-3062
work page 2021
-
[15]
Zhou, M., Wang, B., Guo, S., & Watada, J. (2021). Multi-objective prediction intervals for wind power forecast based on deep neural networks. Information sciences, 550, 207-220
work page 2021
-
[16]
Chen, H., Huang, Z., Lam, H., Qian, H., & Zhang, H. (2021, March). Learning prediction intervals for regression: Generalization and calibration. In International Conference on Artificial Intelligence and Statistics (pp. 820-828). PMLR
work page 2021
-
[17]
S., Langseth, H., & Ramampiaro, H
Salem, T. S., Langseth, H., & Ramampiaro, H. (2020, August). Prediction intervals: Split normal mixture from quality-driven deep ensembles. In Conference on Uncertainty in Artificial Intelligence (pp. 1179-1187). PMLR
work page 2020
-
[18]
Lai, Y ., Shi, Y ., Han, Y ., Shao, Y ., Qi, M., & Li, B. (2022). Exploring uncertainty in regression neural networks for construction of prediction intervals. Neurocomputing, 481, 249-257
work page 2022
-
[19]
D., Akbari, M., Khosravi, A., Nahavandi, S., & Carmichael, D
Nasirzadeh, F., Kabir, H. D., Akbari, M., Khosravi, A., Nahavandi, S., & Carmichael, D. G. (2020). ANN-based prediction intervals to forecast labour productivity. Engineering, Construction and Architectural Management, 27(9), 2335- 2351
work page 2020
- [20]
-
[21]
Zhao, C., Wan, C., Song, Y ., & Cao, Z. (2020). Optimal nonparametric prediction intervals of electricity load. IEEE Transactions on Power Systems, 35(3), 2467-2470
work page 2020
-
[22]
Mathonsi, T., & Zyl, T. L. V . (2025). Multivariate anomaly detection based on prediction intervals constructed using deep learning. Neural Computing and Applications, 37(2), 707-721
work page 2025
-
[23]
Alcántara, A., Galván, I. M., & Aler, R. (2022). Direct estimation of prediction intervals for solar and wind regional energy forecasting with deep neural networks. Engineering Applications of Artificial Intelligence, 114, 105128
work page 2022
-
[24]
Thirumuruganathan, S., Shetiya, S., Koudas, N., & Das, G. (2022, May). Prediction intervals for learned cardinality estimation: an experimental evaluation. In 2022 IEEE 38th International Conference on Data Engineering (ICDE) (pp. 3051-3064). IEEE
work page 2022
-
[25]
Liu, F., Liu, Q., Tao, Q., Huang, Y ., Li, D., & Sidorov, D. (2023). Deep reinforcement learning based energy storage management strategy considering prediction intervals of wind power. International Journal of Electrical Power & Energy Systems, 145, 108608
work page 2023
-
[26]
Sarveswararao, V ., & Ravi, V . (2021). Prediction intervals for macroeconomic variables using LSTM based LUBE method. In Modern Approaches in Machine Learning and Cognitive Science: A Walkthrough: Latest Trends in AI, Volume 2 (pp. 267-275). Cham: Springer International Publishing
work page 2021
-
[27]
Sarveswararao, V ., Ravi, V ., & Huq, S. T. U. (2022). Optimal prediction intervals for macroeconomic time series using chaos and evolutionary multi-objective optimization algorithms. Swarm and Evolutionary Computation, 71, 101070
work page 2022
-
[28]
Michael, O., & Goldshtein, B. L. (2026, May). Semi-Supervised GNN for Sound Source Localization with Prediction Intervals. In ICASSP 2026-2026 IEEE International Conference on Acoustics, Speech and Signal Processing (ICASSP) (pp. 20881-20885). IEEE
work page 2026
-
[29]
Liao, W., Wang, S., Bak-Jensen, B., Pillai, J. R., Yang, Z., & Liu, K. (2023). Ultra- short-term interval prediction of wind power based on graph neural network and improved bootstrap technique. Journal of Modern Power Systems and Clean Energy, 11(4), 1100-1114
work page 2023
-
[30]
Huang, Z., Wang, D., Yin, Y ., & Cheng, T. C. E. (2025). A prediction interval framework-based spatial–temporal convolution block network for traffic demand prediction. Transportation Research Part E: Logistics and Transportation Review, 204, 104426
work page 2025
-
[31]
Nourani, V ., Zonouz, R. S., & Dini, M. (2023). Estimation of prediction intervals for uncertainty assessment of artificial neural network based wastewater treatment plant effluent modeling. Journal of Water Process Engineering, 55, 104145
work page 2023
-
[32]
Wang, L., Mao, M., Xie, J., Liao, Z., Zhang, H., & Li, H. (2023). Accurate solar PV power prediction interval method based on frequency-domain decomposition and LSTM model. Energy, 262, 125592
work page 2023
-
[33]
Dehghani, A., Moazam, H. M. Z. H., Mortazavizadeh, F., Ranjbar, V ., Mirzaei, M., Mortezavi, S., & Dehghani, A. (2023). Comparative evaluation of LSTM, CNN, and ConvLSTM for hourly short-term streamflow forecasting using deep learning approaches. Ecological Informatics, 75, 102119
work page 2023
-
[34]
Vivek, Y ., Vadlamani, S. K., Ravi, V ., & Krishna, P. R. (2026). Improved differential evolution based feature selection through chaos, quantum, and lasso logistic regression. Quantum Machine Intelligence, 8(1), 13
work page 2026
-
[35]
Vivek, Y ., Ravi, V ., & Krishna, P. R. (2025). Feature subset selection for big data via parallel chaotic binary differential evolution and feature-level elitism. Computers and Electrical Engineering, 123, 110232
work page 2025
-
[36]
Gangadhar, K. S. N. V . K., Kumar, B. A., Vivek, Y ., & Ravi, V . (2025, August). Chaotic variational auto encoder based one class classifier for insurance fraud detection. In 2025 International Conference on Emerging Techniques in Computational Intelligence (ICETCI) (pp. 1-8). IEEE
work page 2025
-
[37]
Reddy, D. P. V . S., Vivek, Y ., Pranay, G., & Ravi, V . (2025). Chaotic variational auto encoder-based adversarial machine learning. Computers and Electrical Engineering, 128, 110646
work page 2025
-
[39]
Vivek, Y ., Ravi, V ., & Krishna, P. R. (2025). Parallel Chaotic bi-objective evolutionary algorithms for scalable feature subset selection via migration strategy. Applied Soft Computing, 114009
work page 2025
-
[40]
Kandimalla, E. S., Korukonda, H. S., Bhimineni, S., Kankanala, S. C., & Vivek, Y. (2025). Spatio-temporal chaotic graph convolutional network for stock market forecasting. Accepted at the 10th International Conference on Data Management, Analytics and Innovation (ICDMAI 2026)
work page 2025
discussion (0)
Sign in with ORCID, Apple, or X to comment. Anyone can read and Pith papers without signing in.