CT-DegradBench: A Physics-Informed Benchmark for CT Degradation Detection and Severity Estimation
Pith reviewed 2026-05-20 20:13 UTC · model grok-4.3
The pith
SeSpeCT builds a training-free semantic quality axis from radiology text prompts and spectral cues to jointly detect CT artifact types and estimate their severity.
A machine-rendered reading of the paper's core claim, the machinery that carries it, and where it could break.
Core claim
By constructing a training-free semantic quality axis in the multimodal embedding space from radiology-informed text prompts and combining it with complementary spectral features that capture degradation-specific frequency patterns, SeSpeCT enables joint prediction of artifact type and severity level in CT images under controlled single- and mixed-artifact conditions, outperforming evaluated baselines.
What carries the argument
The semantic quality axis formed in the multimodal embedding space via radiology-informed text prompts, fused with spectral features for degradation-specific frequency analysis.
If this is right
- A single experimental framework now supports systematic comparison across multiple degradation families and severity levels.
- Joint type-and-severity prediction becomes possible without task-specific fine-tuning or additional labeled data.
- Spectral cues supply complementary information that improves performance on both single- and mixed-degradation test cases.
Where Pith is reading between the lines
- Pre-trained medical vision-language models may already encode perceptual quality dimensions useful for radiology even when used zero-shot.
- The same prompt-plus-spectrum recipe could be tested on other modalities that suffer from acquisition artifacts.
- Downstream adaptive restoration pipelines could condition their behavior on the detected degradation profile produced by this axis.
Load-bearing premise
Radiology-informed text prompts can produce a reliable semantic quality axis in the multimodal embedding space that tracks degradation type and severity without any fine-tuning or labeled data.
What would settle it
A test set where scores along the constructed semantic quality axis show no correlation with radiologist ratings of degradation severity, or where SeSpeCT accuracy falls below that of baselines on new mixed-degradation examples.
Figures




read the original abstract
Computed tomography (CT) images are frequently degraded by acquisition artifacts, including noise, blur, streaking, aliasing, and metal artifacts. Yet CT enhancement is still largely evaluated using image quality metrics with limited perceptual and clinical validity, while existing datasets remain focused on isolated restoration tasks, hindering unified benchmarking across diverse degradation types. We present CT-DegradBench, a dataset and benchmark for CT degradation detection and severity estimation under controlled single- and mixed-artifact settings. CT-DegradBench enables systematic evaluation across multiple degradation families and severity levels within a common experimental framework. We further propose SeSpeCT (Semantic-Spectral CT degradation estimation), a framework that combines semantic priors from medical vision-language models with complementary frequency-domain cues for artifact analysis. SeSpeCT constructs a training-free semantic quality axis in the multimodal embedding space using radiology-informed text prompts, without task-specific fine-tuning, and combines it with spectral features that capture degradation-specific frequency patterns. The resulting representation enables joint prediction of artifact type and severity. Experimental results show that SeSpeCT consistently outperforms the evaluated baselines under both single- and mixed-degradation settings. The framework is available at https://github.com/yousranb/CT-DEGRADBENCH.
Editorial analysis
A structured set of objections, weighed in public.
Referee Report
Summary. The manuscript introduces CT-DegradBench, a controlled dataset and benchmark for CT degradation detection and severity estimation covering single- and mixed-artifact scenarios (noise, blur, streaking, aliasing, metal). It proposes SeSpeCT, a training-free framework that constructs a semantic quality axis in a medical VLM embedding space using radiology-informed text prompts and fuses it with frequency-domain spectral features to jointly predict artifact type and continuous severity. Experiments report that SeSpeCT outperforms evaluated baselines under both single- and mixed-degradation conditions.
Significance. If the central claims hold, the work supplies a much-needed unified benchmark for CT artifact analysis that moves beyond isolated restoration tasks and limited perceptual metrics. The training-free semantic-spectral fusion approach could reduce reliance on task-specific labeled data in medical imaging pipelines. Credit is due for releasing the dataset and code at the provided GitHub link, which supports reproducibility.
major comments (3)
- [§4.3] §4.3 (Semantic Axis Construction): The manuscript does not report any direct validation (e.g., Pearson/Spearman correlation or embedding-space visualization) that the prompt-derived semantic quality axis correlates with ground-truth physical severity levels or artifact strength, particularly for mixed degradations. This alignment is load-bearing for the claim that the combined representation meaningfully encodes both type and severity beyond frequency features alone.
- [Table 3] Table 3 (Mixed-degradation results): The reported outperformance margins are presented without statistical significance tests, confidence intervals, or multiple-run variance; given the low number of baselines and the reliance on pre-trained VLMs, it is unclear whether the gains are robust or could be explained by prompt sensitivity.
- [§5.1] §5.1 (Baseline comparison): The abstract and experimental section claim consistent superiority, yet the exact set of baselines, their implementation details, and the precise metrics (beyond generic accuracy/MAE) are insufficiently specified to allow independent verification of the central experimental claim.
minor comments (2)
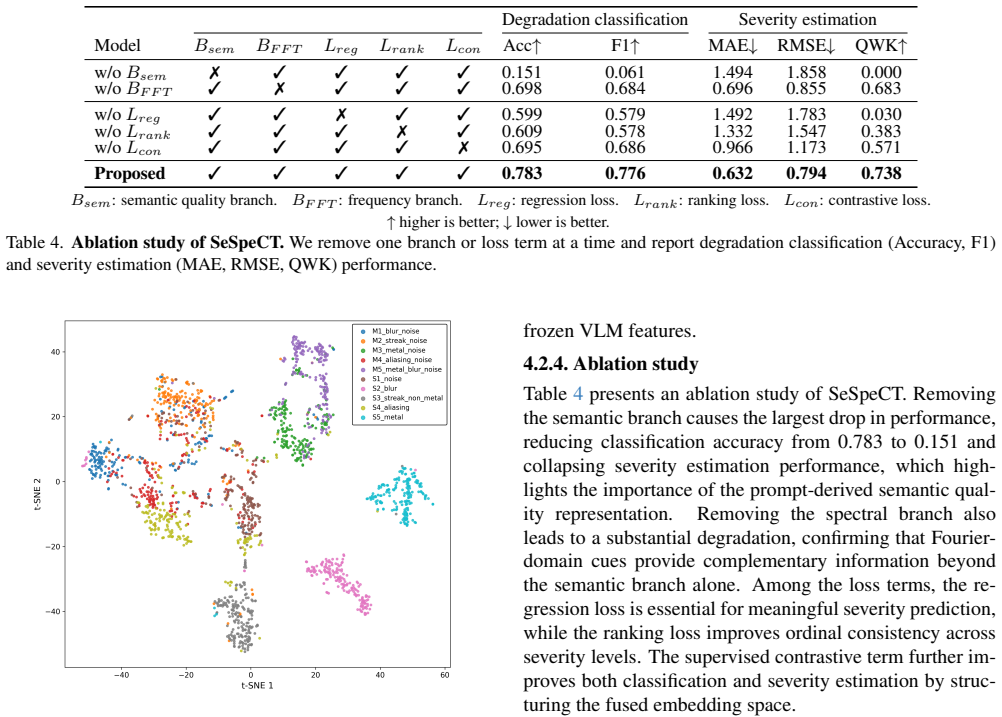
- [Figure 2] Figure 2: The frequency spectra plots would benefit from explicit axis labels indicating normalized frequency ranges and clearer annotation of which peaks correspond to which artifact types.
- [Eq. 7] Notation: The definition of the combined semantic-spectral feature vector (Eq. 7) uses an ambiguous weighting parameter α whose selection procedure is only described qualitatively; a short sensitivity analysis would improve clarity.
Simulated Author's Rebuttal
We thank the referee for their thoughtful and constructive comments on our manuscript. We address each of the major comments in detail below and outline the revisions we plan to make to improve the clarity and rigor of the work.
read point-by-point responses
-
Referee: [§4.3] The manuscript does not report any direct validation (e.g., Pearson/Spearman correlation or embedding-space visualization) that the prompt-derived semantic quality axis correlates with ground-truth physical severity levels or artifact strength, particularly for mixed degradations. This alignment is load-bearing for the claim that the combined representation meaningfully encodes both type and severity beyond frequency features alone.
Authors: We agree that explicit validation of the semantic axis would strengthen the interpretation of our results. While the overall performance of SeSpeCT in predicting severity suggests effective alignment, we did not include direct correlation metrics or visualizations in the original submission. In the revised manuscript, we will add Pearson and Spearman correlation analyses between the semantic quality scores and ground-truth severity levels for single- and mixed-degradation cases. We will also include 2D projections (e.g., PCA or t-SNE) of the embedding space colored by severity to visually demonstrate the correlation. This will be added to §4.3. revision: yes
-
Referee: [Table 3] The reported outperformance margins are presented without statistical significance tests, confidence intervals, or multiple-run variance; given the low number of baselines and the reliance on pre-trained VLMs, it is unclear whether the gains are robust or could be explained by prompt sensitivity.
Authors: We acknowledge the importance of statistical validation for the reported improvements. The original experiments were run with fixed seeds for reproducibility, but variance across runs was not reported. In the revision, we will conduct experiments over 5 independent runs with different seeds, report mean and standard deviation, and include 95% confidence intervals. We will also perform statistical significance tests (e.g., paired t-tests) against the baselines and report p-values. To address potential prompt sensitivity, we will include a sensitivity analysis by varying the radiology-informed prompts and showing that performance remains stable. These updates will be reflected in Table 3 and the experimental section. revision: yes
-
Referee: [§5.1] The abstract and experimental section claim consistent superiority, yet the exact set of baselines, their implementation details, and the precise metrics (beyond generic accuracy/MAE) are insufficiently specified to allow independent verification of the central experimental claim.
Authors: We appreciate this feedback on reproducibility. In the revised version, we will expand the description in §5.1 to explicitly list all baselines with their sources, implementation details (e.g., libraries used, hyperparameters), and the precise evaluation metrics used for each experiment (including per-class accuracy for artifact type, MAE for severity, and combined metrics for mixed degradations). We will also provide additional details on how the VLM embeddings were extracted to facilitate independent verification. revision: yes
Circularity Check
No significant circularity; method relies on external pre-trained models and empirical evaluation
full rationale
The paper proposes SeSpeCT by combining semantic priors from existing medical vision-language models (via radiology-informed text prompts in a multimodal embedding space) with standard frequency-domain spectral features. Neither the semantic quality axis construction nor the joint prediction of artifact type and severity reduces to a self-definition, fitted parameter renamed as prediction, or self-citation chain within the paper. The outperformance claim is presented as an empirical result on the introduced CT-DegradBench dataset under single- and mixed-degradation settings, not as a quantity derived by construction from quantities defined inside the paper. The framework is self-contained against external benchmarks and pre-trained models, with no load-bearing step that equates the claimed result to its own inputs.
Axiom & Free-Parameter Ledger
axioms (2)
- domain assumption Pre-trained medical vision-language models encode radiology-relevant semantic priors that can be queried via text prompts to form a quality axis.
- domain assumption Spectral features capture degradation-specific frequency patterns that complement semantic information.
Lean theorems connected to this paper
-
IndisputableMonolith/Cost/FunctionalEquation.leanwashburn_uniqueness_aczel unclear?
unclearRelation between the paper passage and the cited Recognition theorem.
SeSpeCT constructs a training-free semantic quality axis in the multimodal embedding space using radiology-informed text prompts... combines it with spectral features that capture degradation-specific frequency patterns.
-
IndisputableMonolith/Foundation/RealityFromDistinction.leanreality_from_one_distinction unclear?
unclearRelation between the paper passage and the cited Recognition theorem.
We introduce CT-DegradBench, a controlled benchmark for CT degradation detection and severity estimation, covering five common degradation types, calibrated severity levels...
What do these tags mean?
- matches
- The paper's claim is directly supported by a theorem in the formal canon.
- supports
- The theorem supports part of the paper's argument, but the paper may add assumptions or extra steps.
- extends
- The paper goes beyond the formal theorem; the theorem is a base layer rather than the whole result.
- uses
- The paper appears to rely on the theorem as machinery.
- contradicts
- The paper's claim conflicts with a theorem or certificate in the canon.
- unclear
- Pith found a possible connection, but the passage is too broad, indirect, or ambiguous to say the theorem truly supports the claim.
Reference graph
Works this paper leans on
-
[1]
Merlin: A vision language founda- tion model for 3d computed tomography.Research Square,
Louis Blankemeier et al. Merlin: A vision language founda- tion model for 3d computed tomography.Research Square,
-
[2]
David J. Brenner and Eric J. Hall. Computed tomography— an increasing source of radiation exposure.New England Journal of Medicine, 357(22):2277–2284, 2007. 2
work page 2007
-
[3]
Reproducible scaling laws for contrastive language-image learning
Mehdi Cherti et al. Reproducible scaling laws for contrastive language-image learning. InCVPR, pages 2818–2829, 2023. 6, 7, 5
work page 2023
-
[4]
Ai-driven advances in low- dose imaging and enhancement—a review.Diagnostics, 15 (6):689, 2025
Clement David-Olawade et al. Ai-driven advances in low- dose imaging and enhancement—a review.Diagnostics, 15 (6):689, 2025. 1, 6
work page 2025
-
[5]
Image quality assessment: Unifying struc- ture and texture similarity.IEEE TPAMI, 44(5):2567–2581,
Keyan Ding et al. Image quality assessment: Unifying struc- ture and texture similarity.IEEE TPAMI, 44(5):2567–2581,
-
[6]
Uclh stroke eit dataset - radiology data (ct), 2017
Nir Goren, Thomas Dowrick, James Avery, and David Holder. Uclh stroke eit dataset - radiology data (ct), 2017. 4
work page 2017
-
[7]
Bing Guan et al. Generative modeling in sinogram domain for sparse-view ct reconstruction.IEEE Transactions on Ra- diation and Plasma Medical Sciences, 8(2):195–207, 2023. 1, 3
work page 2023
-
[8]
Aapm ct metal artifact reduction grand challenge.Medical Physics, 52(10):e70050, 2025
Eri Haneda et al. Aapm ct metal artifact reduction grand challenge.Medical Physics, 52(10):e70050, 2025. 3, 4
work page 2025
-
[9]
J. H. Hubbell and S. M. Seltzer. Tables of x-ray mass atten- uation coefficients and mass energy-absorption coefficients,
-
[10]
Version 1.4, National Institute of Standards and Tech- nology, Gaithersburg, MD. 2
-
[11]
Wonjin Kim et al. A systematic review of deep learning- based denoising for low-dose computed tomography from a perceptual quality perspective.Biomedical Engineering Let- ters, 14(6):1153–1173, 2024. 1, 6
work page 2024
-
[12]
Yiming Lei et al. Ct image denoising and deblurring with deep learning: current status and perspectives.IEEE Trans- actions on Radiation and Plasma Medical Sciences, 8(2): 153–172, 2023. 1, 6
work page 2023
-
[13]
Johannes Leuschner, Maximilian Schmidt, Daniel Otero Ba- guer, and Peter Maass. Lodopab-ct, a benchmark dataset for low-dose computed tomography reconstruction.Scien- tific Data, 8(1):109, 2021. 4
work page 2021
-
[14]
Cynthia McCollough. Tu-fg-207a-04: overview of the low dose ct grand challenge.Medical physics, 43(6Part35):3759– 3760, 2016. 6, 4
work page 2016
-
[15]
Advances in ct technology and clinical applica- tions—introductory editorial, 2025
Cynthia H McCollough, Masahiro Jinzaki, and Hatem Alka- dhi. Advances in ct technology and clinical applica- tions—introductory editorial, 2025. 1
work page 2025
-
[16]
Low-dose ct image and projec- tion dataset.Medical physics, 48(2):902–911, 2021
Taylor R Moen, Baiyu Chen, David R Holmes III, Xinhui Duan, Zhicong Yu, Lifeng Yu, Shuai Leng, Joel G Fletcher, and Cynthia H McCollough. Low-dose ct image and projec- tion dataset.Medical physics, 48(2):902–911, 2021. 4
work page 2021
-
[17]
D- perceptct: Deep perceptual enhancement for low-dose ct im- ages
Taifour Yousra Nabila, Azeddine Beghdadi, Marie Luong, Zuheng Ming, Habib Zaidi, and Faouzi Alaya Cheikh. D- perceptct: Deep perceptual enhancement for low-dose ct im- ages. InEuropean Workshop on Visual Information Process- ing (EUVIP), pages 1–6, 2025. 1
work page 2025
-
[18]
Ct image denoising methods for image quality improvement and radiation dose reduction
Rabeya Tus Sadia et al. Ct image denoising methods for image quality improvement and radiation dose reduction. Journal of Applied Clinical Medical Physics, 25(2):e14270,
-
[19]
Yazdan Salimi, Zahra Mansouri, Chang Sun, Amirhossein Sanaat, Mohammadhossein Yazdanpanah, Hossein Shooli, Ren´e Nkoulou, Sana Boudabbous, and Habib Zaidi. Deep learning-based segmentation of ultra-low-dose ct images us- ing an optimized nnu-net model.La Radiologia Medica, pages 1–17, 2025. 1
work page 2025
-
[20]
Mark Selles et al. Advances in metal artifact reduction in ct images: A review of traditional and novel metal artifact reduction techniques.European Journal of Radiology, 170: 111276, 2024. 1
work page 2024
-
[21]
Hamid R. Sheikh and Alan C. Bovik. Image information and visual quality.IEEE TIP, 15(2):430–444, 2006. 6
work page 2006
-
[22]
Emil Y Sidky and Xiaochuan Pan. Report on the aapm deep- learning sparse-view ct grand challenge.Medical physics, 49 (8):4935–4943, 2022. 4
work page 2022
-
[23]
Find-net: Fourier-integrated network with dictionary kernels for metal artifact reduction
Farid Tasharofi et al. Find-net: Fourier-integrated network with dictionary kernels for metal artifact reduction. InMed- ical Image Computing and Computer-Assisted Intervention (MICCAI), pages 192–201, 2025. 1
work page 2025
-
[24]
Tao Wang, Wenjun Xia, Jingfeng Lu, and Yi Zhang. A re- view of deep learning ct reconstruction from incomplete pro- jection data.IEEE Transactions on Radiation and Plasma Medical Sciences, 8(2):138–152, 2023. 1
work page 2023
-
[25]
Image quality assessment: From error visibility to structural similarity.IEEE TIP, 13(4):600–612,
Zhou Wang et al. Image quality assessment: From error visibility to structural similarity.IEEE TIP, 13(4):600–612,
-
[26]
Medclip: Contrastive learning from un- paired medical images and text
Zifeng Wang et al. Medclip: Contrastive learning from un- paired medical images and text. InConference on Empirical Methods in Natural Language Processing (EMNLP), page 3876, 2022. 6, 7, 5
work page 2022
-
[27]
Charting the path forward: Ct image quality assessment - an in-depth review
Siyi Xun, Qiaoyu Li, Xiaohong Liu, et al. Charting the path forward: Ct image quality assessment - an in-depth review. Journal of King Saud University Computer and Information Sciences, 37(5):92, 2025. 1
work page 2025
-
[28]
Sharpness-aware low-dose ct de- noising using conditional generative adversarial network
Xin Yi and Paul Babyn. Sharpness-aware low-dose ct de- noising using conditional generative adversarial network. Journal of digital imaging, 31(5):655–669, 2018. 4
work page 2018
-
[29]
Sungho Yun et al. Tmaa-net: Tensor-domain multi-planal anti-aliasing network for sparse-view ct image reconstruc- tion.Physics in Medicine & Biology, 69(22):225012, 2024. 1
work page 2024
-
[30]
Dong Zeng et al. A simple low-dose x-ray ct simulation from high-dose scan.IEEE Transactions on Nuclear Science, 62 (5):2226–2233, 2015. 3
work page 2015
-
[31]
The unreasonable effectiveness of deep features as a perceptual metric
Richard Zhang et al. The unreasonable effectiveness of deep features as a perceptual metric. InCVPR, pages 586–595,
-
[32]
Sheng Zhang et al. A multimodal biomedical foundation model trained from fifteen million image–text pairs.NEJM AI, 2(1), 2024. 4, 6, 7, 5 CT-DegradBench: A Physics-Informed Benchmark for CT Degradation Detection and Severity Estimation Supplementary Material
work page 2024
-
[33]
Additional Quantitative Evaluation 6.1. Per-Degradation Classification Performance Table 5 reports classification accuracy and F1-score for each degradation across single distortions (S1–S5) and mix- tures (M1–M5). Single degradations achieve consistently high performance, with most classes exceeding 0.98 accu- racy. Blur (S2) and metal artifacts (S5) obt...
-
[34]
Embedding-Space Representation Analysis 7.1. t-SNE Visualization by Degradation Type Figure 5 visualizes the learned embedding space projected using t-SNE and colored by degradation category. Distinct clusters emerge for most degradation types, indicating that the proposed representation encodes artifact-specific char- acteristics. Degradations that intro...
-
[35]
Extended Ablation Studies 8.1. Branch Contribution Analysis Table 4 evaluates the contribution of each branch in the pro- posed semantic-spectral framework. Ablation results reveal that the two branches play complementary roles in captur- ing degradation characteristics. Removing the semantic quality branch (B sem) causes a drastic drop in classification ...
-
[36]
Additional Benchmark Details This section provides supplementary details on the prompt design used to construct the semantic quality axis, the phys- ical motivation behind the degradation mixtures in CT- DegradBench, and the relation of CT-DegradBench to ex- isting CT restoration datasets. 9.1. Prompt design for the semantic quality axis Table 7 lists the...
-
[37]
Axial abdominal CT slice with excellent diagnostic quality, sharp boundaries, clear organ detail, and no visible artifacts
-
[38]
Abdominal CT slice with severe noise and grainy appearance that reduces visibility of anatomical structures
-
[39]
Diagnostic abdominal CT with clear anatomical structures, low noise, high contrast, and no streak artifacts
-
[40]
Abdominal CT slice with strong blur and significant loss of sharpness
-
[41]
High-quality CT image with sharp edges, clean appearance, and good visibility of abdominal organs
-
[42]
Abdominal CT slice with strong streak artifacts and reduced diagnostic quality
-
[43]
Abdominal CT slice with sparse-view aliasing artifacts and dis- torted anatomical structures
-
[44]
Abdominal CT slice with strong metal artifacts causing bright streaks and severe image corruption. Table 7.Prompt sets used to construct the semantic quality axis.High-quality prompts describe artifact-free diagnostic CT images, while low-quality prompts represent common degradations including noise, blur, streak artifacts, aliasing, and metal artifacts. ...
discussion (0)
Sign in with ORCID, Apple, or X to comment. Anyone can read and Pith papers without signing in.