A Parameterized YSO Accretion Disk Model with Increasing Accretion Rate: Predicted Outburst Lightcurves
Pith reviewed 2026-05-20 02:16 UTC · model grok-4.3
The pith
Red optical and near-infrared lightcurves of YSO outbursts closely track the input accretion rate profile, while mid-infrared lightcurves respond more to the location and heating of the innermost dust disk.
A machine-rendered reading of the paper's core claim, the machinery that carries it, and where it could break.
Core claim
By coupling stellar, shock, dust-disk, and gas-disk emission with time-dependent accretion rates that mimic FU Ori morphologies, the model shows that throughout an accretion outburst red optical and near-infrared lightcurves generally follow the same or very similar form as the input accretion profile, being sensitive to heating in the accretion shocks and inner gas disk, while mid-infrared lightcurves are more responsive to the location and heating of the innermost dust disk.
What carries the argument
Parameterized coupling of stellar photospheric emission, magnetospheric accretion shocks, an irradiated dust disk, and a viscously heated gas disk driven by time-dependent accretion rate profiles.
If this is right
- Red optical and near-infrared observations can be used to infer the time history of the accretion rate with minimal correction for disk geometry.
- Mid-infrared monitoring can reveal changes in the inner dust disk radius or temperature distribution during the outburst.
- Color curves can mark the epochs when different components (shocks, gas disk, dust disk) dominate the total flux.
- The model supplies a baseline for interpreting how star-magnetosphere-disk coupling evolves over the full outburst cycle.
Where Pith is reading between the lines
- Coordinated optical-to-mid-infrared campaigns could isolate the accretion-rate signal from dust-reprocessing effects.
- The framework could be applied to other classes of YSO variability to test whether the same wavelength-dependent sensitivities hold.
- Future infrared surveys with high cadence might use mid-infrared deviations to estimate inner-disk radii without full spectral modeling.
Load-bearing premise
The adopted time-dependent accretion rate profiles accurately mimic the observed morphologies of FU Ori outburst light curves without requiring additional physical mechanisms or adjustments to the disk structure parameters during the outburst.
What would settle it
Simultaneous multi-band photometry of a real FU Ori outburst that shows red optical lightcurves deviating in shape from the assumed accretion-rate profile while mid-infrared lightcurves do not.
Figures


read the original abstract
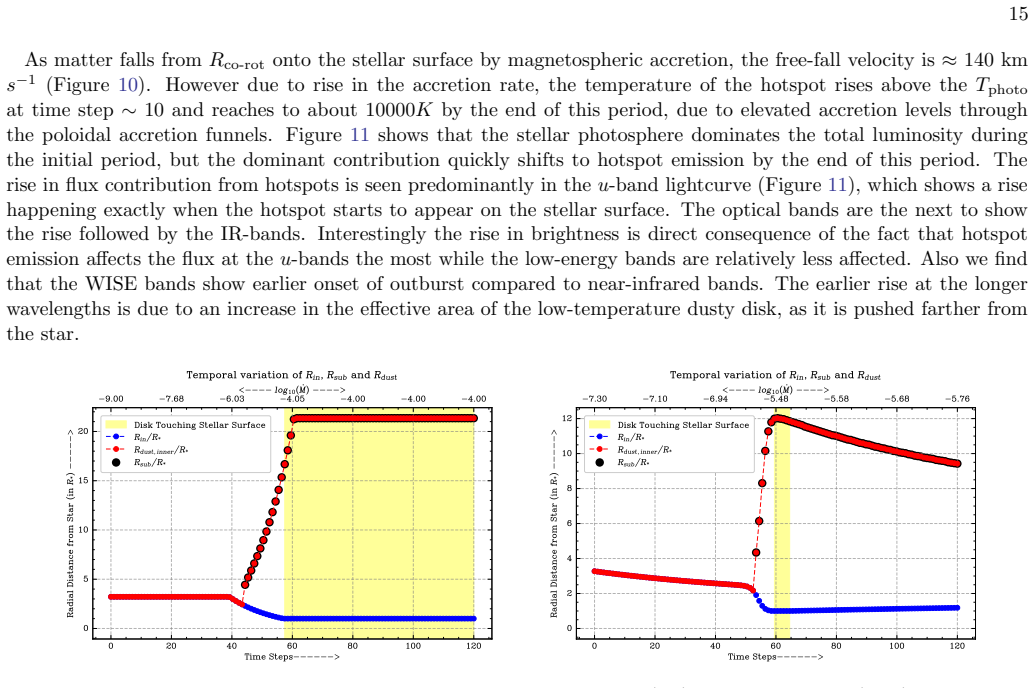
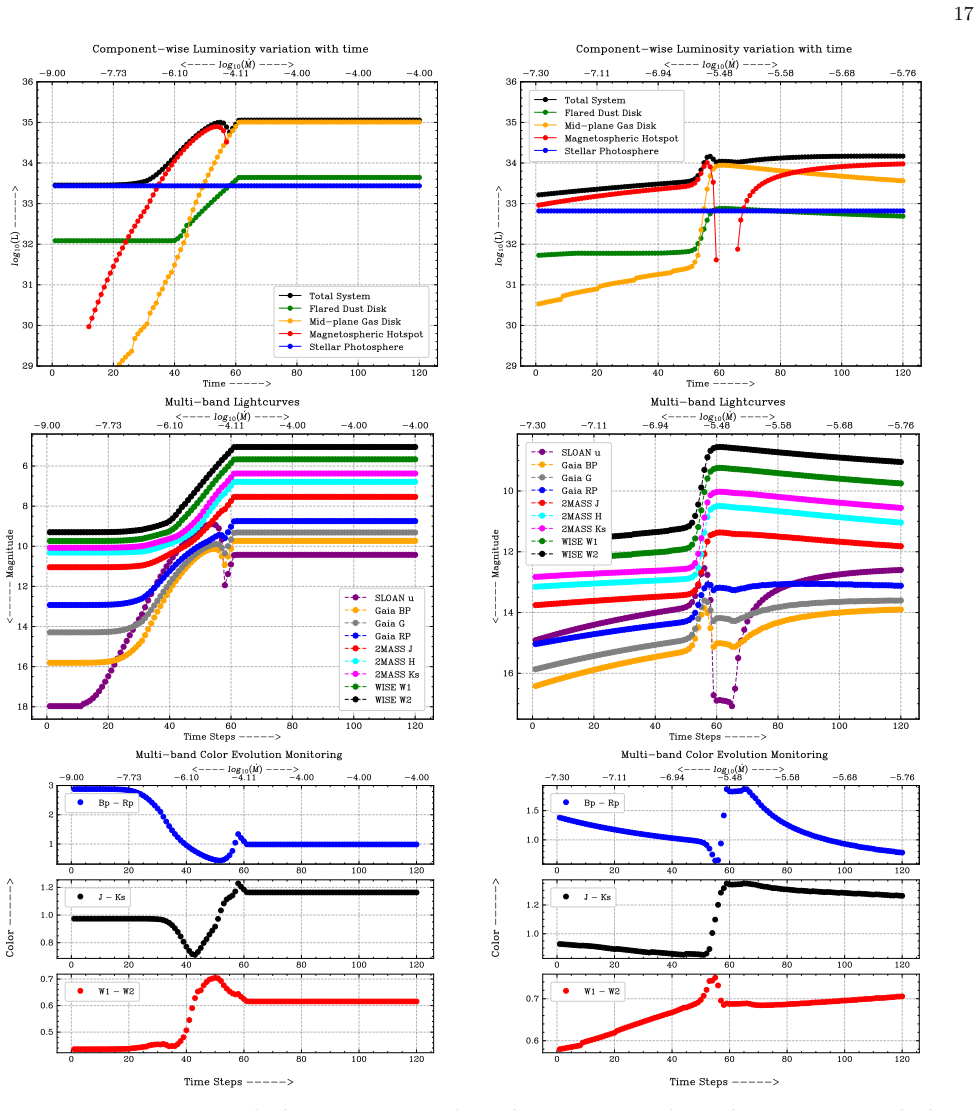
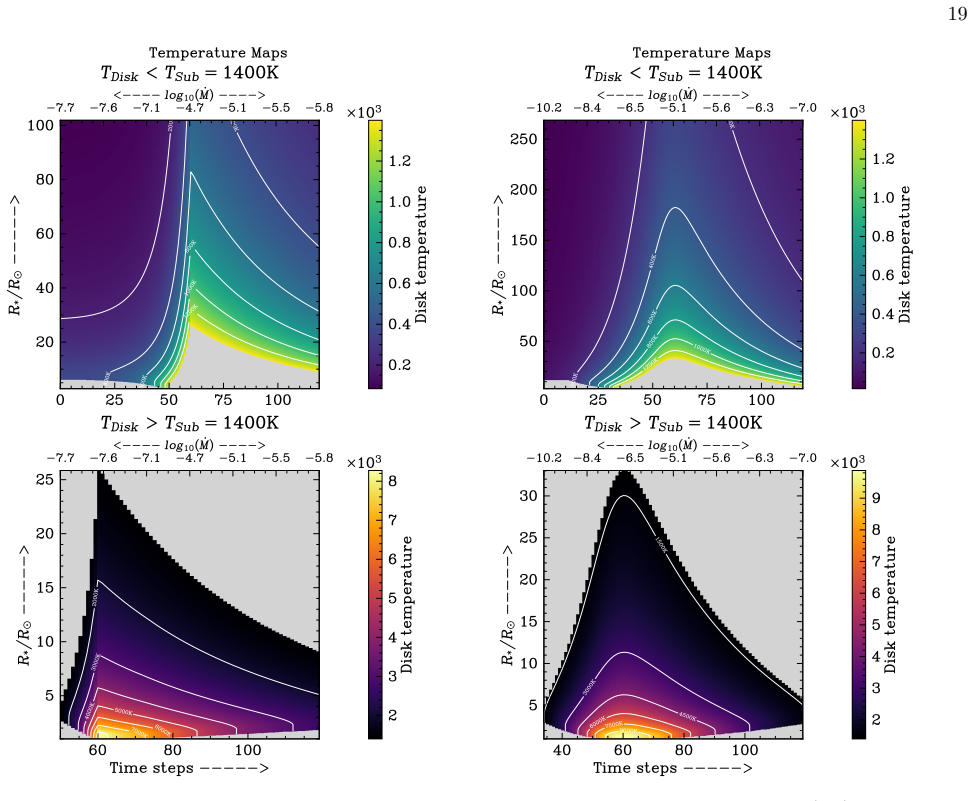
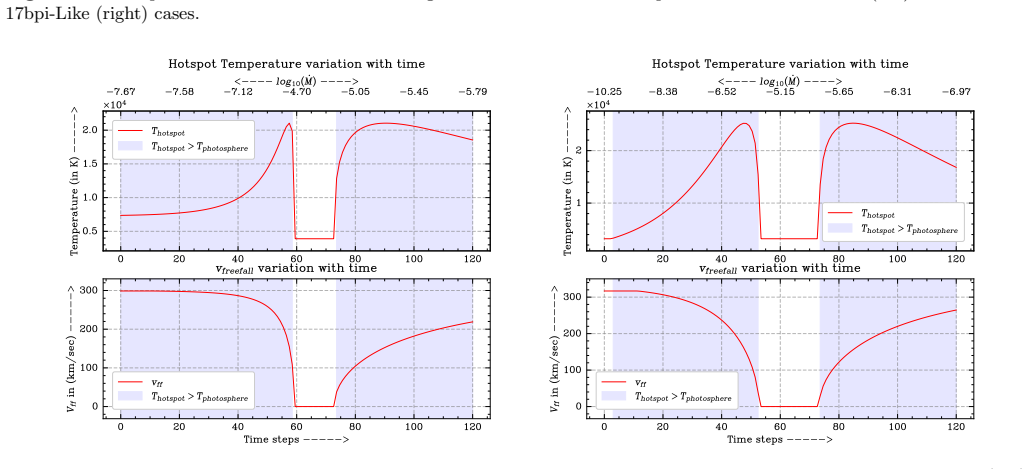
A sub-class among Young Stellar Objects (YSOs), known as FU Ori type stars, undergo sudden rises in luminosity by several orders of magnitude on timescales of a few months to a few years, and decay back to quiescence on timescales of a few decades. Modelling the light curves of these objects is crucial to understanding how different components of these accretion disk systems evolve during outburst. For this purpose, we use a parametric model that couples the stellar photospheric emission, magnetospheric accretion shocks, an irradiated dust disk, and a viscously heated gas disk. We adopt time-dependent accretion rate profiles that mimic the observed morphologies of FU Ori outburst light curves, and we use the accretion model infrastructure to simulate multi-band light curves, as well as color curves. The model enables us to study how different components dominate the flux in each band over the course of an outburst, providing insight into star-magnetosphere-disk interactions throughout the outburst cycle. We find that throughout an accretion outburst, red optical and near-infrared lightcurves generally follow the same or very similar form as the input accretion profile, being sensitive to heating in the accretion shocks and inner gas disk, while mid-infrared lightcurves are more responsive to the location and heating of the innermost dust disk.
Editorial analysis
A structured set of objections, weighed in public.
Referee Report
Summary. The manuscript presents a parameterized model for YSO accretion disks during FU Ori-type outbursts. It couples stellar photospheric emission, magnetospheric accretion shocks, an irradiated dust disk, and a viscously heated gas disk. Time-dependent accretion rate profiles that mimic observed FU Ori light-curve morphologies are adopted to simulate multi-band light curves and color curves. The central claim is that red optical and near-infrared lightcurves generally follow the input accretion profile (sensitive to shocks and inner gas disk heating), while mid-infrared lightcurves respond more to the location and heating of the innermost dust disk.
Significance. If the differential band sensitivities hold independently, the coupled multi-component model offers a useful framework for interpreting wavelength-dependent flux evolution during YSO outbursts and for studying star-magnetosphere-disk interactions. The parametric setup enables qualitative exploration of component dominance across bands, which is a constructive approach for this class of objects.
major comments (1)
- [Abstract and model setup] The adopted time-dependent accretion rate profiles are explicitly chosen to reproduce the shapes of observed FU Ori outburst light curves, which are predominantly optical or near-IR. This choice makes the reported result that red optical and NIR model lightcurves closely track the input profile potentially circular rather than an independent prediction from the coupled shock/gas/dust emission. The manuscript holds disk structure parameters fixed while varying only the accretion rate; a robustness test using untuned or alternative profiles is needed to support the claimed differential sensitivities (see abstract and model setup sections).
minor comments (2)
- [Results] No quantitative error bars, direct fits to specific observed light curves, or parameter-sensitivity analysis are provided; the trends remain qualitative.
- [Throughout] Notation for the inner dust edge and truncation radius should be defined consistently when discussing MIR responsiveness.
Simulated Author's Rebuttal
We thank the referee for their thoughtful and constructive review of our manuscript. We have carefully considered the concern about potential circularity arising from the choice of accretion rate profiles and provide a detailed response below, including plans for revision to strengthen the presentation of our results.
read point-by-point responses
-
Referee: [Abstract and model setup] The adopted time-dependent accretion rate profiles are explicitly chosen to reproduce the shapes of observed FU Ori outburst light curves, which are predominantly optical or near-IR. This choice makes the reported result that red optical and NIR model lightcurves closely track the input profile potentially circular rather than an independent prediction from the coupled shock/gas/dust emission. The manuscript holds disk structure parameters fixed while varying only the accretion rate; a robustness test using untuned or alternative profiles is needed to support the claimed differential sensitivities (see abstract and model setup sections).
Authors: We acknowledge the referee's point that the accretion rate profiles were selected to exhibit rise and decay timescales representative of observed FU Ori outbursts, which are most commonly monitored in optical and near-IR bands. However, the model input is the time-dependent mass accretion rate profile Mdot(t), not the observed light curves themselves. The coupled emission model then computes the wavelength-dependent fluxes self-consistently from the magnetospheric accretion shocks, viscously heated gas disk, irradiated dust disk, and stellar photosphere. The key prediction is the differential response: optical and NIR light curves track the input Mdot(t) shape because they are dominated by shock and inner gas disk heating, while mid-IR light curves deviate due to the evolving location and temperature of the innermost dust. This wavelength-dependent behavior emerges from the multi-component physics even for illustrative profiles. To directly address the concern and demonstrate robustness, we will add a new subsection presenting results for alternative, untuned accretion rate profiles (e.g., an abrupt step-function increase with exponential decay, and a profile with a slower linear rise). These tests will confirm that the differential band sensitivities persist independently of the specific morphological details. We will also revise the abstract and model setup sections to clarify that the profiles are chosen as representative morphologies rather than direct fits to individual observations, and note that disk structure parameters are held fixed to isolate the effect of varying accretion rate. revision: yes
Circularity Check
Accretion rate profiles chosen to mimic observed FU Ori morphologies make the red optical/NIR lightcurve tracking result partly by construction
specific steps
-
fitted input called prediction
[Abstract]
"We adopt time-dependent accretion rate profiles that mimic the observed morphologies of FU Ori outburst light curves, and we use the accretion model infrastructure to simulate multi-band light curves... We find that throughout an accretion outburst, red optical and near-infrared lightcurves generally follow the same or very similar form as the input accretion profile, being sensitive to heating in the accretion shocks and inner gas disk, while mid-infrared lightcurves are more responsive to the location and heating of the innermost dust disk."
Accretion rate profiles are parameterized to reproduce the shapes of observed FU Ori light curves (measured in optical/NIR). The model then shows that red optical/NIR outputs follow those same profiles because those bands are dominated by accretion-shock and inner-gas-disk heating that scales directly with the adopted rate. This reduces the reported tracking behavior to a near-tautology of the input choice and band-sensitivity assumptions rather than an independent prediction.
full rationale
The central claim that red optical and NIR lightcurves follow the input accretion profile is a direct output of selecting those profiles to reproduce observed outburst shapes (primarily optical/NIR) and then computing emission from components directly tied to accretion rate. The mid-IR differential response has more independent content. No self-citation chain or uniqueness theorem is load-bearing.
Axiom & Free-Parameter Ledger
free parameters (2)
- time-dependent accretion rate profile
- disk truncation radius and inner dust edge location
axioms (1)
- domain assumption The stellar photosphere, magnetospheric shocks, irradiated dust disk, and viscously heated gas disk can be treated as additive, independent emitters whose fluxes are computed separately and summed.
Lean theorems connected to this paper
-
IndisputableMonolith/Cost/FunctionalEquation.leanwashburn_uniqueness_aczel unclear?
unclearRelation between the paper passage and the cited Recognition theorem.
We adopt time-dependent accretion rate profiles that mimic the observed morphologies of FU Ori outburst light curves... red optical and near-infrared lightcurves generally follow the same or very similar form as the input accretion profile
-
IndisputableMonolith/Foundation/RealityFromDistinction.leanreality_from_one_distinction unclear?
unclearRelation between the paper passage and the cited Recognition theorem.
The modified Shakura & Sunyaev (1973) temperature profile for gas accretion... Chiang & Goldreich (1997) for the dust-dominated disk
What do these tags mean?
- matches
- The paper's claim is directly supported by a theorem in the formal canon.
- supports
- The theorem supports part of the paper's argument, but the paper may add assumptions or extra steps.
- extends
- The paper goes beyond the formal theorem; the theorem is a base layer rather than the whole result.
- uses
- The paper appears to rely on the theorem as machinery.
- contradicts
- The paper's claim conflicts with a theorem or certificate in the canon.
- unclear
- Pith found a possible connection, but the passage is too broad, indirect, or ambiguous to say the theorem truly supports the claim.
Reference graph
Works this paper leans on
-
[1]
Model Atmospheres From Very Low Mass Stars to Brown Dwarfs
Allard, F., Homeier, D., & Freytag, B. 2011, in Astronomical Society of the Pacific Conference Series, Vol. 448, 16th Cambridge Workshop on Cool Stars, Stellar Systems, and the Sun, ed. C. Johns-Krull, M. K. Browning, & A. A. West, 91, doi: 10.48550/arXiv.1011.5405
work page internal anchor Pith review Pith/arXiv arXiv doi:10.48550/arxiv.1011.5405 2011
-
[2]
Bae, J., Hartmann, L., Zhu, Z., & Nelson, R. P. 2014, ApJ, 795, 61, doi: 10.1088/0004-637X/795/1/61
-
[3]
Baraffe, I., Homeier, D., Allard, F., & Chabrier, G. 2015, A&A, 577, A42, doi: 10.1051/0004-6361/201425481 Beltr´ an, M. T., & de Wit, W. J. 2016, A&A Rv, 24, 6, doi: 10.1007/s00159-015-0089-z
work page internal anchor Pith review doi:10.1051/0004-6361/201425481 2015
-
[4]
N., Izidoro, A., & Morbidelli, A
Bouvier, J., Matt, S. P., Mohanty, S., et al. 2014, in Protostars and Planets VI, ed. H. Beuther, R. S. Klessen, C. P. Dullemond, & T. Henning, 433–450, doi: 10.2458/azu uapress 9780816531240-ch019
work page doi:10.2458/azu 2014
-
[5]
Calvet, N., & Gullbring, E. 1998, ApJ, 509, 802, doi: 10.1086/306527
-
[6]
2024, ApJ, 971, 44, doi: 10.3847/1538-4357/ad5286
Carvalho, A., Hillenbrand, L., Seebeck, J., & Covey, K. 2024, ApJ, 971, 44, doi: 10.3847/1538-4357/ad5286
-
[7]
2025, ApJL, 994, L12, doi: 10.3847/2041-8213/ae1830
France, K. 2025, ApJL, 994, L12, doi: 10.3847/2041-8213/ae1830
-
[8]
Carvalho, A. S., Hillenbrand, L. A., Hambsch, F.-J., et al. 2023, Astrophys. J., 953, 86, doi: 10.3847/1538-4357/ace2cb 27
-
[9]
Chiang, E. I., & Goldreich, P. 1997, ApJ, 490, 368, doi: 10.1086/304869
-
[10]
2023, MNRAS, 523, 5522, doi: 10.1093/mnras/stad1784
Cleaver, J., Hartmann, L., & Bae, J. 2023, MNRAS, 523, 5522, doi: 10.1093/mnras/stad1784
-
[11]
Das, G., Mukhopadhyay, A., & Ninan, J. P. 2024, in 42nd meeting of the Astronomical Society of India (ASI), Vol. 42, P198
work page 2024
-
[12]
Das, G., Mukhopadhyay, A., & Ninan, J. P. 2026
work page 2026
-
[13]
Fischer, W. J., Hillenbrand, L. A., Herczeg, G. J., et al. 2023, in Astronomical Society of the Pacific Conference
work page 2023
-
[14]
Protostars and Planets VII , year = 2023, editor =
Series, Vol. 534, Protostars and Planets VII, ed. S. Inutsuka, Y. Aikawa, T. Muto, K. Tomida, & M. Tamura, 355, doi: 10.48550/arXiv.2203.11257
-
[15]
Hartigan, P., Kenyon, S. J., Hartmann, L., et al. 1991, ApJ, 382, 617, doi: 10.1086/170749
-
[16]
2016, Annual Review of Astronomy and Astrophysics, 54, 135
Hartmann, L., Herczeg, G., & Calvet, N. 2016, Annual Review of Astronomy and Astrophysics, 54, 135
work page 2016
-
[17]
1994, ApJ, 426, 669, doi: 10.1086/174104
Hartmann, L., Hewett, R., & Calvet, N. 1994, ApJ, 426, 669, doi: 10.1086/174104
-
[18]
Hillenbrand, L. A., Carvalho, A. S., Stern, D., et al. 2025, ApJ, 988, 77, doi: 10.3847/1538-4357/ade14d
-
[19]
A., Contreras Pe˜ na, C., Morrell, S., et al
Hillenbrand, L. A., Contreras Pe˜ na, C., Morrell, S., et al. 2018a, Astrophys. J., 869, 146, doi: 10.3847/1538-4357/aaf414 —. 2018b, ApJ, 869, 146, doi: 10.3847/1538-4357/aaf414
-
[20]
2005, A&A, 438, 899, doi: 10.1051/0004-6361:20052773
Isella, A., & Natta, A. 2005, A&A, 438, 899, doi: 10.1051/0004-6361:20052773
-
[21]
Johns-Krull, C. M. 2007, ApJ, 664, 975, doi: 10.1086/519017
-
[22]
1991, ApJL, 370, L39, doi: 10.1086/185972 K´ osp´ al,´A., ´Abrah´ am, P., Acosta-Pulido, J
Koenigl, A. 1991, ApJL, 370, L39, doi: 10.1086/185972 K´ osp´ al,´A., ´Abrah´ am, P., Acosta-Pulido, J. A., et al. 2016, A&A, 596, A52, doi: 10.1051/0004-6361/201528061
-
[23]
Kuhn, M. A., & Hillenbrand, L. A. 2020, Research Notes of the American Astronomical Society, 4, 224, doi: 10.3847/2515-5172/abd18a
-
[24]
Liu, H., Herczeg, G. J., Johnstone, D., et al. 2022, The Astrophysical Journal, 936, 152
work page 2022
-
[25]
2005, The Astrophysical Journal, 634, 1214
Long, M., Romanova, M., & Lovelace, R. 2005, The Astrophysical Journal, 634, 1214
work page 2005
-
[26]
Manara, C. F. M. 2014, Phd thesis, lmu
work page 2014
-
[27]
Masley, A. T., & Hartmann, L. 2025, MNRAS, 544, 3210, doi: 10.1093/mnras/staf1908
-
[28]
K., D’Alessio, P., Calvet, N., et al
McClure, M. K., D’Alessio, P., Calvet, N., et al. 2013, ApJ, 775, 114, doi: 10.1088/0004-637X/775/2/114
-
[29]
Miller, A. A., Hillenbrand, L. A., Covey, K. R., et al. 2011, ApJ, 730, 80, doi: 10.1088/0004-637X/730/2/80
-
[30]
2024, MNRAS, 530, 1749, doi: 10.1093/mnras/stae877
Nayakshin, S., Cruz S´ aenz de Miera, F., K´ osp´ al,´A., et al. 2024, MNRAS, 530, 1749, doi: 10.1093/mnras/stae877
-
[31]
2025, ApJS, 278, 10, doi: 10.3847/1538-4365/adc397
Neha, S., & Sharma, S. 2025, ApJS, 278, 10, doi: 10.3847/1538-4365/adc397
-
[32]
Pavlyuchenkov, Y. N., & Akimkin, V. V. 2025, arXiv e-prints, arXiv:2504.10220, doi: 10.48550/arXiv.2504.10220
-
[33]
2007, ApJ, 656, 615, doi: 10.1086/510445
Posch, T., Mutschke, H., Trieloff, M., & Henning, T. 2007, ApJ, 656, 615, doi: 10.1086/510445
-
[34]
Roberts, M. J. O., Latter, H. N., & Lesur, G. 2025, MNRAS, 544, 1284, doi: 10.1093/mnras/staf1672 —. 2026, arXiv e-prints, arXiv:2602.11818, doi: 10.48550/arXiv.2602.11818
work page internal anchor Pith review Pith/arXiv arXiv doi:10.1093/mnras/staf1672 2025
-
[35]
Rodrigo, C., Cruz, P., Aguilar, J. F., et al. 2024, A&A, 689, A93, doi: 10.1051/0004-6361/202449998
-
[36]
Shakura, N. I., & Sunyaev, R. A. 1973, Astronomy and Astrophysics, 24, 337
work page 1973
-
[37]
Singh, K., Ninan, J. P., Romanova, M. M., et al. 2024, ApJ, 968, 88, doi: 10.3847/1538-4357/ad4099
-
[38]
2025, ApJ, 985, 16, doi: 10.3847/1538-4357/adc37b
Takasao, S., Hosokawa, T., Tomida, K., & Iwasaki, K. 2025, ApJ, 985, 16, doi: 10.3847/1538-4357/adc37b
-
[39]
1984, PASJ, 36, 105, doi: 10.1093/pasj/36.1.105
Uchida, Y., & Shibata, K. 1984, PASJ, 36, 105, doi: 10.1093/pasj/36.1.105
-
[40]
2025, MNRAS, 537, 3701, doi: 10.1093/mnras/staf250
Zhu, Z. 2025, MNRAS, 537, 3701, doi: 10.1093/mnras/staf250
-
[41]
Zhu, Z., Jiang, Y.-F., & Stone, J. M. 2020, MNRAS, 495, 3494, doi: 10.1093/mnras/staa952
-
[42]
Zhu, Z., Stone, J. M., & Calvet, N. 2024, MNRAS, 528, 2883, doi: 10.1093/mnras/stad3712
discussion (0)
Sign in with ORCID, Apple, or X to comment. Anyone can read and Pith papers without signing in.