The Signal in the Noise: OOD Detection Through Goodness-of-Fit Testing in Factorised Latent Spaces
Pith reviewed 2026-05-22 08:04 UTC · model grok-4.3
The pith
Continuous normalizing flows map out-of-distribution samples to atypical noise under the prior, enabling single-sample detection without relying on likelihood.
A machine-rendered reading of the paper's core claim, the machinery that carries it, and where it could break.
Core claim
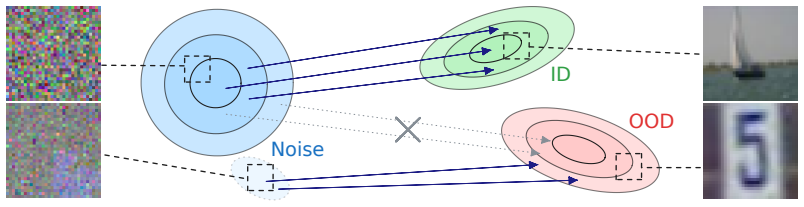
The diffeomorphic and mass-preserving properties of continuous normalizing flows cause OOD samples to be mapped to noise samples that are highly atypical under the noise prior in ways not captured by the likelihood. The proposed Signal in the Noise (SITN) method leverages this by performing goodness-of-fit testing in factorised latent spaces for single-sample OOD detection.
What carries the argument
Goodness-of-fit testing applied to the noise samples obtained by inverting a continuous normalizing flow on an input.
If this is right
- SITN requires no access to OOD data.
- The method adds minimal computational overhead beyond standard likelihood evaluation.
- It provides strict control over false positive rates.
- Evaluations show no complexity bias toward simpler in-distribution samples.
- It performs well on both standard benchmarks and synthetic perturbations.
Where Pith is reading between the lines
- The atypical noise mapping might generalize to other invertible models beyond continuous flows.
- This could be extended to multi-sample or batch detection scenarios for even stronger statistical power.
- Applications in safety-critical systems could benefit from the controlled false positive rates.
Load-bearing premise
The diffeomorphic and mass-preserving properties of continuous normalizing flows map OOD inputs to atypical noise under the prior independently of likelihood.
What would settle it
A dataset where OOD samples consistently produce noise samples that pass goodness-of-fit tests at rates similar to in-distribution samples would falsify the claim.
Figures




read the original abstract
Deep generative models offer a natural foundation for out-of-distribution (OOD) detection, yet prior work has shown that their assigned likelihoods are notoriously unreliable indicators for in- vs out-of-distribution data. In this paper, we address this problem by leveraging the diffeomorphic and mass-preserving properties of continuous normalising flows. Our analysis shows that OOD samples are mapped to noise samples that are highly atypical under the noise prior in ways not captured by the likelihood. Based on this observation, we propose a new method -- Signal in the Noise (SITN) -- for OOD detection on the single-sample level. SITN requires no access to OOD data, incurs minimal computational overhead, and provides strict control of false positive rates. Comprehensive evaluations through standard benchmarks and synthetic perturbations highlight the method's effectiveness and the absence of the complexity bias inherent to likelihood-based methods.
Editorial analysis
A structured set of objections, weighed in public.
Referee Report
Summary. The manuscript proposes Signal in the Noise (SITN), an OOD detection method that exploits the diffeomorphic and mass-preserving properties of continuous normalizing flows. OOD inputs are mapped to highly atypical points under the base noise prior in a factorised latent space; these atypicalities are detected via per-dimension CDF transforms to uniform p-values followed by a combination statistic (e.g., Fisher), yielding a single-sample test that requires no OOD data, incurs negligible overhead, and claims exact false-positive-rate control at any nominal alpha.
Significance. If the exact FPR guarantee and the separation from likelihood-based complexity bias both hold, the work would supply a theoretically grounded, low-cost alternative to existing generative-model OOD detectors and could influence downstream applications that need calibrated type-I error without access to outlier examples.
major comments (2)
- [§3] §3 (SITN construction) and the abstract: the claim of 'strict control of false positive rates' rests on the premise that, after training, the push-forward measure of held-out ID data under the flow is exactly the base prior (standard normal). Because the flow is obtained by maximum-likelihood estimation on finite data, the empirical marginals in the factorised latent space deviate from the prior; consequently the transformed p-values are not exactly uniform and the combined statistic does not possess the nominal null distribution. This directly affects the central guarantee of alpha-level thresholding without OOD data.
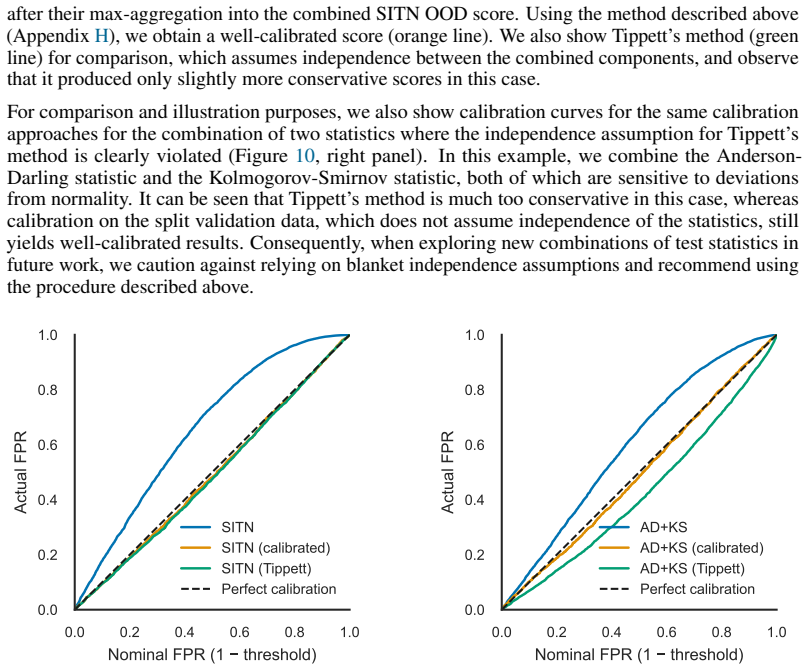
- [§4] §4 (Empirical evaluation): the reported benchmark results do not include a calibration check that compares the observed type-I error on held-out ID data against the nominal alpha across multiple thresholds. Without such a diagnostic, it is impossible to verify whether the finite-sample mismatch identified above remains negligible in the regimes tested.
minor comments (2)
- The precise form of the per-dimension goodness-of-fit transform and the p-value combination rule should be stated explicitly (including any continuity corrections) so that the null distribution can be reproduced.
- Figure captions and axis labels in the synthetic-perturbation experiments would benefit from explicit indication of which panels correspond to ID versus OOD samples.
Simulated Author's Rebuttal
We thank the referee for their insightful comments on our manuscript. We respond to each major comment below and outline the revisions we will make.
read point-by-point responses
-
Referee: [§3] §3 (SITN construction) and the abstract: the claim of 'strict control of false positive rates' rests on the premise that, after training, the push-forward measure of held-out ID data under the flow is exactly the base prior (standard normal). Because the flow is obtained by maximum-likelihood estimation on finite data, the empirical marginals in the factorised latent space deviate from the prior; consequently the transformed p-values are not exactly uniform and the combined statistic does not possess the nominal null distribution. This directly affects the central guarantee of alpha-level thresholding without OOD data.
Authors: We agree that the finite-sample MLE training of the flow means the push-forward of held-out ID data is not exactly the base prior, so the uniformity of the p-values and the exact null distribution of the combined statistic hold only asymptotically or conditional on a perfectly trained model. Our derivation in §3 proceeds under the standard population-level assumption that the flow has recovered the base distribution exactly. In practice the mismatch is small for the dataset sizes and model capacities used, but we acknowledge the referee's point is valid. In the revision we will update the abstract and §3 to state that the FPR control is exact with respect to the learned flow (i.e., if test data were drawn from the model's implied distribution) and add a short paragraph discussing finite-sample deviations and their expected magnitude. revision: partial
-
Referee: [§4] §4 (Empirical evaluation): the reported benchmark results do not include a calibration check that compares the observed type-I error on held-out ID data against the nominal alpha across multiple thresholds. Without such a diagnostic, it is impossible to verify whether the finite-sample mismatch identified above remains negligible in the regimes tested.
Authors: We agree that an explicit calibration diagnostic is needed to quantify how closely the observed type-I error tracks the nominal alpha. In the revised manuscript we will add, in §4, a calibration plot (or table) that reports the empirical false-positive rate on held-out in-distribution data for several nominal levels (0.01, 0.05, 0.10) across all benchmarks. This will directly address the finite-sample concern raised in the previous comment. revision: yes
Circularity Check
No circularity: derivation rests on standard CNF properties without reduction to fitted inputs or self-citations
full rationale
The paper grounds its atypicality claim and strict FPR control directly in the diffeomorphic and mass-preserving properties of continuous normalizing flows, which are standard mathematical facts independent of the present work. No equations or sections reduce the detection statistic to a parameter fitted on the target task, nor does the central argument rely on a load-bearing self-citation chain or imported uniqueness theorem. The method is presented as a direct consequence of the flow's change-of-variables formula applied to goodness-of-fit testing in the latent space, with no renaming of known results or smuggling of ansatzes. The derivation chain is therefore self-contained against external benchmarks.
Axiom & Free-Parameter Ledger
free parameters (1)
- false-positive-rate threshold
axioms (1)
- domain assumption Continuous normalizing flows are diffeomorphic and mass-preserving.
Lean theorems connected to this paper
-
IndisputableMonolith/Cost/FunctionalEquation.leanwashburn_uniqueness_aczel unclear?
unclearRelation between the paper passage and the cited Recognition theorem.
We quantify this atypicality at the single-sample level by exploiting the completely factorised nature of the Gaussian noise prior... Anderson-Darling statistic... coefficient of variation of the empirical power spectrum
What do these tags mean?
- matches
- The paper's claim is directly supported by a theorem in the formal canon.
- supports
- The theorem supports part of the paper's argument, but the paper may add assumptions or extra steps.
- extends
- The paper goes beyond the formal theorem; the theorem is a base layer rather than the whole result.
- uses
- The paper appears to rely on the theorem as machinery.
- contradicts
- The paper's claim conflicts with a theorem or certificate in the canon.
- unclear
- Pith found a possible connection, but the passage is too broad, indirect, or ambiguous to say the theorem truly supports the claim.
Reference graph
Works this paper leans on
-
[1]
11 Nicholas Baker, Hongjing Lu, Gennady Erlikhman, and Philip J
Anh Mai Nguyen, Jason Yosinski, and Jeff Clune. “Deep neural networks are easily fooled: High confidence predictions for unrecognizable images”. In:Proc of CVPR. 2015, pp. 427–436. DOI:10.1109/CVPR.2015.7298640
-
[2]
Neural Ordinary Differential Equations
Tian Qi Chen et al. “Neural Ordinary Differential Equations”. In:Proc. of NeurIPS. 2018, pp. 6572–6583
work page 2018
-
[3]
Flow Matching for Generative Modeling
Yaron Lipman et al. “Flow Matching for Generative Modeling”. In:Proc. of ICLR. 2023
work page 2023
-
[4]
Do Deep Generative Models Know What They Don’t Know?
Eric T. Nalisnick et al. “Do Deep Generative Models Know What They Don’t Know?” In: Proc. of ICLR. 2019
work page 2019
-
[5]
Input Complexity and Out-of-distribution Detection with Likelihood-based Generative Models
Joan Serrà et al. “Input Complexity and Out-of-distribution Detection with Likelihood-based Generative Models”. In:Proc. of ICLR. 2020
work page 2020
-
[6]
Robin Schirrmeister et al. “Understanding Anomaly Detection with Deep Invertible Networks through Hierarchies of Distributions and Features”. In:Proc. of NeurIPS. 2020
work page 2020
-
[7]
Why Normalizing Flows Fail to Detect Out-of-Distribution Data
Polina Kirichenko, Pavel Izmailov, and Andrew Gordon Wilson. “Why Normalizing Flows Fail to Detect Out-of-Distribution Data”. In:Proc. of NeurIPS. 2020
work page 2020
-
[8]
Detecting Out-of-Distribution Inputs to Deep Generative Models Using Typicality,
Eric Nalisnick et al. “Detecting Out-of-Distribution Inputs to Deep Generative Models Using Typicality”. In:ArXiv preprintabs/1906.02994 (2019)
-
[9]
Likelihood Ratios for Out-of-Distribution Detection
Jie Ren et al. “Likelihood Ratios for Out-of-Distribution Detection”. In:Proc. of NeurIPS. 2019, pp. 14680–14691
work page 2019
-
[10]
Likelihood Regret: An Out-of-Distribution Detec- tion Score For Variational Auto-encoder
Zhisheng Xiao, Qing Yan, and Yali Amit. “Likelihood Regret: An Out-of-Distribution Detec- tion Score For Variational Auto-encoder”. In:Proc. of NeurIPS. 2020
work page 2020
-
[11]
Density of States Estimation for Out of Distribution Detection
Warren R. Morningstar et al. “Density of States Estimation for Out of Distribution Detection”. In:Proc. of AISTATS. V ol. 130. Proceedings of Machine Learning Research. 2021, pp. 3232– 3240
work page 2021
-
[12]
Hierarchical V AEs Know What They Don’t Know
Jakob Drachmann Havtorn et al. “Hierarchical V AEs Know What They Don’t Know”. In:Proc. of ICML. V ol. 139. Proceedings of Machine Learning Research. 2021, pp. 4117–4128
work page 2021
-
[13]
A Geometric Explanation of the Likelihood OOD Detection Paradox
Hamidreza Kamkari et al. “A Geometric Explanation of the Likelihood OOD Detection Paradox”. In:Proc. of ICML. 2024
work page 2024
-
[14]
Hopcroft, and Ravindran Kannan.Foundations of data science
Avrim Blum, John E. Hopcroft, and Ravindran Kannan.Foundations of data science. 2020. ISBN: 978-1-108-48506-7 978-1-108-75552-8.DOI:10.1017/9781108755528
-
[15]
Understanding Failures in Out-of- Distribution Detection with Deep Generative Models
Lily H. Zhang, Mark Goldstein, and Rajesh Ranganath. “Understanding Failures in Out-of- Distribution Detection with Deep Generative Models”. In:Proc. of ICML. V ol. 139. Proceed- ings of Machine Learning Research. 2021, pp. 12427–12436
work page 2021
-
[16]
WAIC, but Why? Generative Ensembles for Robust Anomaly Detection
Hyunsun Choi, Eric Jang, and Alexander A. Alemi. “W AIC, but Why? Generative Ensembles for Robust Anomaly Detection”. In:ArXiv preprintabs/1810.01392 (2018)
work page internal anchor Pith review Pith/arXiv arXiv 2018
-
[17]
Revisiting flow generative models for Out-of- distribution detection
Dihong Jiang, Sun Sun, and Yaoliang Yu. “Revisiting flow generative models for Out-of- distribution detection”. In:Proc. of ICLR. 2022
work page 2022
-
[18]
Out-of-Distribution Detection with a Single Unconditional Diffusion Model
Alvin Heng, Alexandre H. Thiery, and Harold Soh. “Out-of-Distribution Detection with a Single Unconditional Diffusion Model”. In:Proc. of NeurIPS. 2024
work page 2024
-
[19]
Marcus Hutter.Testing Independence of Exchangeable Random Variables. Oct. 2022.DOI: 10.48550/arXiv.2210.12392
-
[20]
Benchmarking Neural Network Robustness to Common Corruptions and Perturbations
Dan Hendrycks and Thomas G. Dietterich. “Benchmarking Neural Network Robustness to Common Corruptions and Perturbations”. In:Proc. of ICLR. 2019
work page 2019
-
[21]
Denoising Diffusion Probabilistic Models
Jonathan Ho, Ajay Jain, and Pieter Abbeel. “Denoising Diffusion Probabilistic Models”. In: Proc. of NeurIPS. 2020
work page 2020
-
[22]
Diffusion Models Beat GANs on Image Synthesis
Prafulla Dhariwal and Alexander Quinn Nichol. “Diffusion Models Beat GANs on Image Synthesis”. In:Proc. of NeurIPS. 2021, pp. 8780–8794
work page 2021
-
[23]
doi: https://doi.org/ 10.1016/0771-050X(80)90013-3
J. R. Dormand and P. J. Prince. “A family of embedded Runge-Kutta formulae”. In:Journal of Computational and Applied Mathematics6.1 (1980), pp. 19–26.ISSN: 0377-0427.DOI: 10.1016/0771-050X(80)90013-3
-
[24]
Learning multiple layers of features from tiny images
Alex Krizhevsky, Geoffrey Hinton, et al. “Learning multiple layers of features from tiny images” (2009)
work page 2009
-
[25]
Reading digits in natural images with unsupervised feature learning
Yuval Netzer et al. “Reading digits in natural images with unsupervised feature learning”. In: NIPS workshop on deep learning and unsupervised feature learning. V ol. 2011. 2. 2011, p. 4. 11
work page 2011
-
[26]
Deep Learning Face Attributes in the Wild
Ziwei Liu et al. “Deep Learning Face Attributes in the Wild”. In:Proc. of ICCV. 2015, pp. 3730–3738.DOI:10.1109/ICCV.2015.425
-
[27]
Rania Briq et al.The Amazing Stability of Flow Matching. Apr. 2026.DOI: 10.48550/arXiv. 2604.16079
work page internal anchor Pith review Pith/arXiv arXiv doi:10.48550/arxiv 2026
-
[28]
Aryeh Dvoretzky, Jack Kiefer, and Jacob Wolfowitz. “Asymptotic minimax character of the sample distribution function and of the classical multinomial estimator”. In:The Annals of Mathematical Statistics(1956), pp. 642–669
work page 1956
-
[29]
PyTorch: An Imperative Style, High-Performance Deep Learning Library
Adam Paszke et al. “PyTorch: An Imperative Style, High-Performance Deep Learning Library”. In:Proc. of NeurIPS. 2019, pp. 8024–8035
work page 2019
-
[30]
Yaron Lipman et al. “Flow Matching Guide and Code”. In:ArXiv preprintabs/2412.06264 (2024). 12 A Metric Ablations Bright Contrast Defocus Elastic Fog Frost Gauss B Gauss N Glass Impulse JPEG Motion Pixel Saturate Shot Snow Spatter Speckle Zoom SITN AD CV 0.82 0.60 0.73 0.74 0.64 0.88 0.75 0.91 0.95 1.00 0.97 0.90 0.95 0.74 0.93 0.96 0.97 0.96 0.80 0.85 0....
work page internal anchor Pith review Pith/arXiv arXiv 2024
discussion (0)
Sign in with ORCID, Apple, or X to comment. Anyone can read and Pith papers without signing in.