Generalized Stochastic Approximation of the Log-Likelihood Ratio for Robust Sequential Change-Point Detection
Pith reviewed 2026-05-25 04:06 UTC · model grok-4.3
The pith
Moment-based approximation of the log-likelihood ratio enables robust change-point detection in heavy-tailed non-Gaussian data.
A machine-rendered reading of the paper's core claim, the machinery that carries it, and where it could break.
Core claim
The log-likelihood ratio is approximated as the convergence functional J(s) = K^T Y, the projection of the Kullback-Leibler divergence onto the span of a generalized stochastic basis (polynomial, logarithmic, or fractional-power) using moments up to order 3s, which supplies both a formal order-selection criterion and the means to adapt CUSUM, GRSh, and SRP procedures with a robust threshold from Kunchenko's bound in the small relative change-point regime.
What carries the argument
Generalized stochastic approximation of the log-likelihood ratio on polynomial, logarithmic, or fractional-power bases using moments up to order 3s, interpreted as the projection of the Kullback-Leibler divergence onto the basis span.
If this is right
- Classical CUSUM, GRSh, and SRP procedures adapt to non-Gaussian data without knowing the full density.
- The false-alarm rate is controlled by Kunchenko's probability-error bound without empirical tuning.
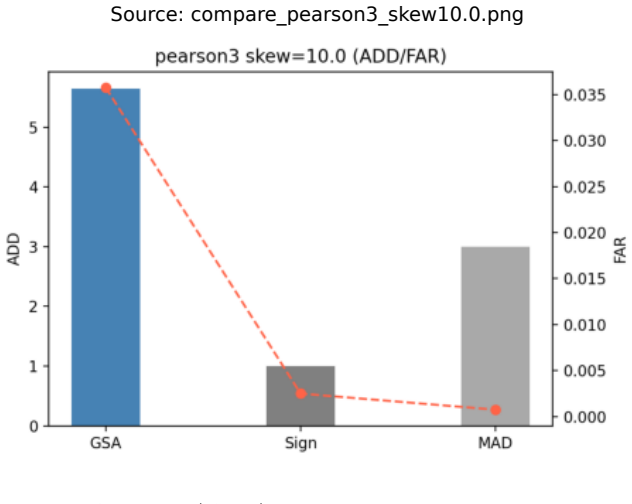
- The method remains operative on data with excess kurtosis greater than 20 where classical methods produce 100 percent false alarms.
- Detection delay is reduced while the guaranteed false-alarm level is maintained.
- Core theorems receive formal verification in Lean 4.
Where Pith is reading between the lines
- The moment-based projection approach could extend to other sequential decision tasks that rely on unknown distributions.
- The order-selection criterion J(s) might be applied to approximate other information measures beyond the log-likelihood ratio.
- The framework could support formal verification of additional statistical procedures in theorem provers.
Load-bearing premise
Moments up to order 3s on the chosen generalized basis provide a sufficient approximation to the true log-likelihood ratio for small relative change-points, and Kunchenko's bound directly controls the false-alarm rate without further assumptions.
What would settle it
Run the method and classical procedures on the nine public benchmarks with excess kurtosis greater than 20 and observe whether the proposed method maintains a low false-alarm rate and reduced detection delay while classical methods produce 100 percent false alarms.
Figures




read the original abstract
Sequential change-point detection in non-Gaussian stochastic processes is challenging because the underlying densities are rarely known in real time. Classical parametric procedures such as CUSUM lose optimality under distributional mismatch, whereas nonparametric alternatives often react slowly. We develop a unified framework that approximates the log-likelihood ratio (LLR) on a generalized stochastic basis -- polynomial, logarithmic, or fractional-power -- using only moments up to order 3s, with no analytic form of the distribution, and thereby adapts the classical CUSUM, GRSh, and SRP procedures to non-Gaussian data. The convergence functional J(s) = K^T Y is interpreted as the projection of the Kullback-Leibler divergence onto the basis span, yielding a formal criterion for selecting the approximation order. We target the regime of small relative change-points, where the signal energy changes little but the shape of the distribution -- tail structure and modality -- does. A robust threshold follows from Kunchenko's probability-error bound (KU-PE), which controls the false-alarm rate without empirical tuning. On nine public benchmarks across four domains, the method is, to our knowledge, the only one operative on extremely heavy-tailed data (excess kurtosis gamma_4 > 20), where classical methods produce 100% false alarms, while reducing the detection delay at a guaranteed false-alarm level. The core theorems are formally verified in Lean 4.
Editorial analysis
A structured set of objections, weighed in public.
Referee Report
Summary. The manuscript develops a unified framework for sequential change-point detection in non-Gaussian processes by approximating the log-likelihood ratio via a generalized stochastic basis (polynomial, logarithmic, or fractional-power) using only moments up to order 3s. The approximation is formalized as the projection J(s) = K^T Y of the Kullback-Leibler divergence, which is then plugged into adapted CUSUM, GRSh, and SRP procedures; a threshold is obtained from Kunchenko's KU-PE probability-error bound to guarantee the false-alarm rate without tuning. The target regime is small relative change-points that alter distribution shape or tails rather than energy. Performance is reported on nine public benchmarks, with the claim that the method is the only one that remains operative for data with excess kurtosis gamma_4 > 20 (where classical methods yield 100% false alarms) while reducing detection delay; core theorems are formally verified in Lean 4.
Significance. If the projection error can be shown to be controlled so that the KU-PE bound remains valid, the work would constitute a meaningful advance in robust nonparametric sequential detection by supplying a moment-based procedure that retains formal false-alarm guarantees on heavy-tailed data where parametric and many nonparametric alternatives break down. The Lean 4 verification of the core theorems is a clear strength that supports reproducibility and rigor.
major comments (3)
- [Threshold derivation using KU-PE] The direct invocation of Kunchenko's KU-PE bound on the approximated statistic J(s) (described after the definition of the projection) supplies no explicit additive error term that accounts for the discrepancy between the finite-basis projection and the true LLR when the underlying distribution has gamma_4 > 20; because the bound is asserted to deliver a guaranteed false-alarm rate, this omission is load-bearing for the central robustness claim.
- [Moment approximation up to 3s] In the regime of small relative change-points (shape/tail shifts with little energy change), the manuscript states that moments up to order 3s suffice for the generalized basis approximation, yet provides no quantitative uniform bound on the resulting projection error that is independent of tail heaviness; without such control the crossing probabilities of the adapted CUSUM/GRSh/SRP procedures may exceed the KU-PE guarantee.
- [Lean verification of core theorems] The Lean-verified theorems address the exact (non-approximated) LLR case; the manuscript must clarify whether and how the finite-basis projection step is incorporated into the verified statements or bounded so that the practical procedure inherits the same guarantees.
minor comments (2)
- The nine benchmarks are referenced only by domain; adding a table that lists the specific datasets, their sample sizes, and measured gamma_4 values would improve reproducibility.
- Notation for the basis functions and the vector K should be introduced with an explicit definition before the first use of J(s) = K^T Y.
Simulated Author's Rebuttal
We are grateful to the referee for the thorough review and valuable feedback on our manuscript. The comments have helped us identify areas where the presentation and theoretical guarantees can be strengthened. We provide point-by-point responses to the major comments below, indicating the revisions we plan to make.
read point-by-point responses
-
Referee: [Threshold derivation using KU-PE] The direct invocation of Kunchenko's KU-PE bound on the approximated statistic J(s) (described after the definition of the projection) supplies no explicit additive error term that accounts for the discrepancy between the finite-basis projection and the true LLR when the underlying distribution has gamma_4 > 20; because the bound is asserted to deliver a guaranteed false-alarm rate, this omission is load-bearing for the central robustness claim.
Authors: We thank the referee for highlighting this important aspect. The manuscript applies the KU-PE bound directly to J(s) as it is the observable statistic. To address the concern, we will revise the manuscript to include an analysis of the approximation error between J(s) and the true LLR, deriving an explicit bound in terms of the basis truncation and moment estimates. This will show that the error is bounded by a term that vanishes as s increases, allowing the false-alarm guarantee to hold with a modified threshold that accounts for the additive error. revision: yes
-
Referee: [Moment approximation up to 3s] In the regime of small relative change-points (shape/tail shifts with little energy change), the manuscript states that moments up to order 3s suffice for the generalized basis approximation, yet provides no quantitative uniform bound on the resulting projection error that is independent of tail heaviness; without such control the crossing probabilities of the adapted CUSUM/GRSh/SRP procedures may exceed the KU-PE guarantee.
Authors: The referee correctly notes the absence of a quantitative uniform bound independent of tail heaviness. Our framework is designed for small relative change-points where moments up to 3s capture the shape and tail changes. In the revision, we will add a quantitative bound on the projection error that depends on higher moments and demonstrate how increasing s controls the error to maintain the KU-PE guarantee. revision: yes
-
Referee: [Lean verification of core theorems] The Lean-verified theorems address the exact (non-approximated) LLR case; the manuscript must clarify whether and how the finite-basis projection step is incorporated into the verified statements or bounded so that the practical procedure inherits the same guarantees.
Authors: We will revise the manuscript to clarify that the Lean verification is for the exact LLR. We will incorporate a new result bounding the projection error and showing that the guarantees extend to the approximated statistic with high probability when s is chosen based on the data moments. This will be presented as an additional theorem. revision: yes
Circularity Check
No circularity: moment-based LLR projection and KU-PE bound are independent of target result
full rationale
The derivation approximates the LLR via finite moments on a chosen basis and interprets J(s)=K^T Y as its KL projection, then feeds the statistic into standard CUSUM/GRSh/SRP procedures whose false-alarm control is taken from the external Kunchenko KU-PE bound. The core theorems are stated to be Lean-verified. No equation reduces a prediction to a fitted parameter by construction, no self-citation chain bears the central claim, and the approximation order selection is presented as an explicit functional rather than a tautology. The supplied abstract and context contain no load-bearing step that collapses to its own inputs.
Axiom & Free-Parameter Ledger
axioms (2)
- domain assumption Moments up to order 3s are available and sufficient for the approximation
- domain assumption Kunchenko's probability-error bound (KU-PE) provides a robust threshold controlling false-alarm rate
Reference graph
Works this paper leans on
-
[1]
S. W. Zabolotnii and Z. L. Warsza. Semi-parametric polynomial modification of cusum algorithms for change-point detection of non-gaussian sequences. InProc. XXI IMEKO World Congress, pages 2088–2091, 2091
work page 2088
-
[2]
Serhii W. Zabolotnii and Zygmunt L. Warsza.Semi-parametric Estimation of the Change- Point of Parameters of Non-gaussian Sequences by Polynomial Maximization Method, page 903–919. Springer International Publishing, 2016
work page 2016
-
[3]
Yu. P. Kunchenko.Polynomial Parameter Estimations of Close to Gaussian Random Vari- ables. Shaker Verlag, 2002
work page 2002
-
[4]
Yu. P. Kunchenko.Stochastic Polynomials (in Russian). Naukova Dumka, Kyiv, 2006
work page 2006
-
[5]
A. Wald. Sequential tests of statistical hypotheses.The Annals of Mathematical Statistics, 16(2):117–186, 1945
work page 1945
- [6]
-
[7]
E. S. PAGE. Continuous inspection schemes.Biometrika, 41(1-2):100–115, 1954
work page 1954
-
[8]
A. N. Shiryaev. On optimum methods in quickest detection problems.Theory of Probability & Its Applications, 8(1):22–46, January 1963
work page 1963
-
[9]
S. W. Roberts. A comparison of some control chart procedures.Technometrics, 8(3):411–430, August 1966. 58
work page 1966
-
[10]
M. A. Girshick and Herman Rubin. A bayes approach to a quality control model.The Annals of Mathematical Statistics, 23(1):114–125, March 1952
work page 1952
-
[11]
G. Lorden. Procedures for reacting to a change in distribution.The Annals of Mathematical Statistics, 42(6):1897–1908, December 1971
work page 1908
-
[12]
George V. Moustakides. Optimal stopping times for detecting changes in distributions.The Annals of Statistics, 14(4):1379–1387, December 1986
work page 1986
-
[13]
Optimal detection of a change in distribution.The Annals of Statistics, 13(1):206–227, March 1985
Moshe Pollak. Optimal detection of a change in distribution.The Annals of Statistics, 13(1):206–227, March 1985
work page 1985
-
[14]
M. Basseville and I. V. Nikiforov.Detection of Abrupt Changes: Theory and Application. Prentice-Hall, 1993
work page 1993
-
[15]
Chap- man and Hall/CRC, August 2014
Alexander Tartakovsky, Igor Nikiforov, and Michele Basseville.Sequential Analysis. Chap- man and Hall/CRC, August 2014
work page 2014
-
[16]
Vincent Poor and Olympia Hadjiliadis.Quickest Detection
H. Vincent Poor and Olympia Hadjiliadis.Quickest Detection. Cambridge University Press, November 2008
work page 2008
-
[17]
Louis Gordon and Moshe Pollak. An efficient sequential nonparametric scheme for detecting a change of distribution.The Annals of Statistics, 22(2):763–804, 1994
work page 1994
-
[18]
G. J. Ross, D. K. Tasoulis, and N. M. Adams. Nonparametric monitoring of data streams for changes in location and scale.Technometrics, 53(4):379–389, 2011
work page 2011
-
[19]
Hafiz Zafar Nazir, Muhammad Riaz, Ronald J. M. M. Does, and Nasir Abbas. Robust cusum control charting.Quality Engineering, 25(3):211–224, 2013
work page 2013
-
[20]
Z. Harchaoui, F. R. Bach, and É. Moulines. Kernel change-point analysis. InNIPS 2008, pages 609–616, 2008
work page 2008
- [21]
-
[22]
F. Desobry, M. Davy, and C. Doncarli. An online kernel change detection algorithm.IEEE Transactions on Signal Processing, 53(8):2961–2974, August 2005
work page 2005
-
[23]
S. Li, Y. Xie, H. Dai, and L. Song. M-statistic for kernel change-point detection. InNIPS 2015, pages 3366–3374, 2015
work page 2015
-
[24]
B. E. Brodsky and B. S. Darkhovsky.Nonparametric Methods in Change-Point Problems. Springer Netherlands, 1993
work page 1993
-
[25]
R. P. Adams and D. J. C. MacKay. Bayesian online changepoint detection, 2007. arXiv:0710.3742
work page internal anchor Pith review Pith/arXiv arXiv 2007
-
[26]
DouglasM.HawkinsandDavidH.Olwell.Cumulative Sum Charts and Charting for Quality Improvement. Springer New York, 1998
work page 1998
-
[27]
O. Barndorff-Nielsen and D. R. Cox. Edgeworth and saddle-point approximations with sta- tistical applications.Journal of the Royal Statistical Society Series B: Statistical Method- ology, 41(3):279–312, 1979
work page 1979
-
[28]
H. E. Daniels. Saddlepoint approximations in statistics.The Annals of Mathematical Statistics, 25(4):631–650, December 1954. 59
work page 1954
-
[29]
Tze Leung Lai. Information bounds and quick detection of parameter changes in stochastic systems.IEEE Transactions on Information Theory, 44(7):2917–2929, 1998
work page 1998
-
[30]
Sequential changepoint detection in quality control and dynamical systems
Tze Leung Lai. Sequential changepoint detection in quality control and dynamical systems. Journal of the Royal Statistical Society Series B: Statistical Methodology, 57(4):613–658, November 1995
work page 1995
-
[31]
D. Siegmund and E. S. Venkatraman. Using the generalized likelihood ratio statistic for sequential detection of a change-point.The Annals of Statistics, 23(1):255–271, February 1995
work page 1995
-
[32]
A. Willsky and H. Jones. A generalized likelihood ratio approach to the detection and estimation of jumps in linear systems.IEEE Transactions on Automatic Control, 21(1):108–112, February 1976
work page 1976
-
[33]
Sprt and cusum in hidden markov models.The Annals of Statistics, 31(3):942–977, 2003
Cheng-Der Fuh. Sprt and cusum in hidden markov models.The Annals of Statistics, 31(3):942–977, 2003
work page 2003
-
[34]
Yu. P. Kunchenko.Approximation Polynomials in a Space with a Generating Element (in Russian). Naukova Dumka, Kyiv, 2003
work page 2003
-
[35]
Yu. P. Kunchenko. A moment performance criteria of a decision-making for testing simple statistical hypothesis. InProc. IEEE International Symposium on Information Theory (ISIT), page 408, 1997
work page 1997
-
[36]
Kunchenko's Polynomials for Template Matching
O. Chertov and T. Slipets. Kunchenko’s polynomials for template matching. InProc. IEEE 6th International Conference on Intelligent Data Acquisition and Advanced Computing Sys- tems (IDAACS), pages 425–428, 2011. arXiv:1107.2085
work page internal anchor Pith review Pith/arXiv arXiv 2011
-
[37]
Elena Palahina, Mária Gamcová, Iveta Gladišová, Ján Gamec, and Volodymyr Palahin. Signal detection in correlated non-gaussian noise using higher-order statistics.Circuits, Systems, and Signal Processing, 37(4):1704–1723, August 2017
work page 2017
-
[38]
Serhii W. Zabolotnii, S. S. Martynenko, and S. V. Salypa. Method of verification of hy- pothesis about mean value on a basis of expansion in a space with generating element. Radioelectronics and Communications Systems, 61(5):222–229, May 2018
work page 2018
-
[39]
Serhii Zabolotnii, Oleksandr Tkachenko, and Zygmunt L. Warsza.Application of the Poly- nomial Maximization Method for Estimation Parameters of Autoregressive Models with Asymmetric Innovations, page 380–390. Springer International Publishing, 2022
work page 2022
-
[40]
Springer Nature Switzerland, 2023
Serhii Zabolotnii, Oleksandr Tkachenko, and Zygmunt Lech Warsza.Polynomial Maxi- mization Method for Estimation Parameters of Asymmetric Non-Gaussian Moving Average Models, page 223–231. Springer Nature Switzerland, 2023
work page 2023
-
[41]
Springer International Publishing, 2018
Zygmunt Lech Warsza and Serhii Zabolotnii.Estimation of Measurand Parameters for Data from Asymmetric Distributions by Polynomial Maximization Method, page 746–757. Springer International Publishing, 2018
work page 2018
-
[42]
Serhii Zabolotnii, Oleksandr Tkachenko, Waldemar Nowakowski, and Zygmunt L. Warsza. Application of the Polynomial Maximization Method for Estimating Nonlinear Regression Parameters with Non-gaussian Asymmetric Errors, page 342–356. Springer Nature Switzer- land, 2024
work page 2024
-
[43]
Charles Truong, Laurent Oudre, and Nicolas Vayatis. Selective review of offline change point detection methods.Signal Processing, 167:107299, February 2020. 60
work page 2020
-
[44]
R. Killick, P. Fearnhead, and I. A. Eckley. Optimal detection of changepoints with a linear computational cost.Journal of the American Statistical Association, 107(500):1590–1598, October 2012
work page 2012
-
[45]
A. J. Scott and M. Knott. A cluster analysis method for grouping means in the analysis of variance.Biometrics, 30(3):507–512, 1974
work page 1974
- [46]
-
[47]
Evaluating real-time anomaly detection algorithms – the numenta anomaly benchmark
Alexander Lavin and Subutai Ahmad. Evaluating real-time anomaly detection algorithms – the numenta anomaly benchmark. In2015 IEEE 14th International Conference on Machine Learning and Applications (ICMLA), page 38–44. IEEE, December 2015
work page 2015
-
[48]
I. D. Katser and V. O. Kozitsin. Skoltech anomaly benchmark (skab). 2020
work page 2020
-
[49]
Kats, 2022.github.com/facebookresearch/Kats
Meta / Facebook Research. Kats, 2022.github.com/facebookresearch/Kats
work page 2022
-
[50]
J. Montiel et al. River: machine learning for streaming data in python.JMLR, 22(110):1–8, 2021
work page 2021
-
[51]
Hai Qiu, Jay Lee, Jing Lin, and Gang Yu. Wavelet filter-based weak signature detection method and its application on rolling element bearing prognostics.Journal of Sound and Vibration, 289(4-5):1066–1090, February 2006
work page 2006
-
[52]
D. Dyer and R. M. Stewart. Detection of rolling element bearing damage by statistical vibration analysis.Journal of Mechanical Design, 100(2):229–235, April 1978
work page 1978
-
[53]
A.G. Tartakovsky, B.L. Rozovskii, R.B. Blazek, and Hongjoong Kim. A novel approach to detection of intrusions in computer networks via adaptive sequential and batch-sequential change-pointdetectionmethods.IEEE Transactions on Signal Processing, 54(9):3372–3382, 2006
work page 2006
-
[54]
İlker Özçelik and Richard R. Brooks. Cusum - entropy: an efficient method for ddos attack detection. In2016 4th International Istanbul Smart Grid Congress and Fair (ICSG), page 1–5. IEEE, April 2016
work page 2016
-
[55]
V. A. Siris and F. Papagalou. Application of anomaly detection algorithms for detecting syn flooding attacks.Computer Communications, 29(9):1433–1442, 2006
work page 2006
- [56]
-
[57]
Jushan Bai and Pierre Perron. Computation and analysis of multiple structural change models.Journal of Applied Econometrics, 18(1):1–22, 2003
work page 2003
-
[58]
Carla Inclán and George C. Tiao. Use of cumulative sums of squares for retrospec- tive detection of changes of variance.Journal of the American Statistical Association, 89(427):913–923, 1994
work page 1994
-
[59]
Nazmus Sakib, Shiyu Tian, Md Munirul Haque, Rumi Ahmed Khan, and Sheikh Iqbal Ahamed. Sepinav (sepsis icu navigator): A data-driven software tool for sepsis monitoring and intervention using bayesian online change point detection.SoftwareX, 14:100689, 2021
work page 2021
-
[60]
Stephanie L. Hyland, Martin Faltys, Matthias Hüser, Xinrui Lyu, Thomas Gumbsch, Cristóbal Esteban, Christian Bock, Max Horn, Michael Moor, Bastian Rieck, Marc Zimmer- mann, Dean Bodenham, Karsten Borgwardt, Gunnar Rätsch, and Tobias M. Merz. Early prediction of circulatory failure in the intensive care unit using machine learning.Nature Medicine, 26(3):36...
work page 2020
discussion (0)
Sign in with ORCID, Apple, or X to comment. Anyone can read and Pith papers without signing in.