When One Point Is Not Enough: Addressing Ambiguous Instances in Dimensionality Reduction by Splitting
Pith reviewed 2026-05-25 05:01 UTC · model grok-4.3
The pith
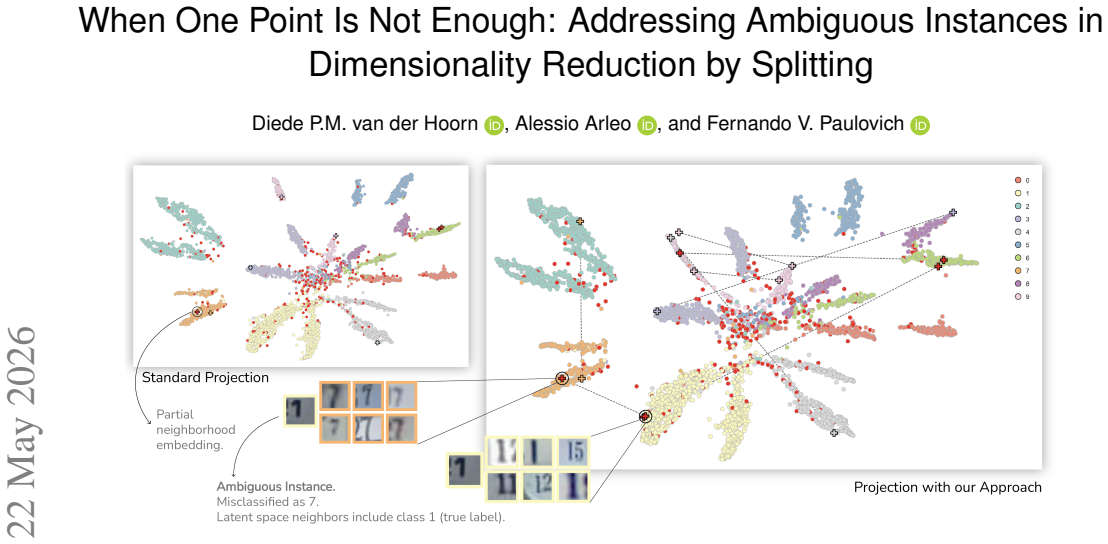
Ambiguous data points similar to multiple neighborhoods can be replicated as separate points in dimensionality reduction to show their full structure.
A machine-rendered reading of the paper's core claim, the machinery that carries it, and where it could break.
Core claim
Ambiguous instances, defined as points highly similar to multiple mutually dissimilar neighborhoods in high-dimensional space, cause partial neighborhood embedding when projected to a single point; replicating each such instance as multiple points in the low-dimensional space and placing each copy in its respective neighborhood reveals the full set of neighborhood memberships.
What carries the argument
Graph-based detection of ambiguous instances via high-dimensional similarity relations, followed by replication of each instance into multiple projected points.
If this is right
- Projections display previously invisible neighborhood memberships for the replicated points.
- Partial neighborhood embedding is reduced across multiple tested examples.
- The method extends to other local graph-based dimensionality reduction techniques beyond UMAP.
- Quantitative measures confirm the reduction in embedding distortion.
Where Pith is reading between the lines
- Interactive visualization systems could allow users to toggle between the multiple placements of a split point.
- The replication step might be combined with existing quality metrics to automatically flag remaining projection artifacts.
- Downstream tasks such as clustering performed on the augmented projection could recover groupings that standard single-point embeddings miss.
Load-bearing premise
High-dimensional similarity relations supply a reliable ground truth for identifying which neighborhoods an instance belongs to, without the detection process itself being compromised by projection loss.
What would settle it
A test set of known ambiguous instances where the method's splits fail to match independent neighborhood labels or where the added points increase rather than decrease measured partial embedding error.
Figures


read the original abstract
Dimensionality Reduction (DR) methods are widely used to visualize high-dimensional data. One key task in DR-based analysis is discovering neighborhoods, which relies on analyzing the fine-grained local structure of a projection. However, DR is an inherently lossy process; no technique can perfectly preserve the high-dimensional relationships, and projections therefore contain visual artifacts. In this paper, we highlight a typically overlooked source of visual artifacts: ambiguous instances. These are instances that are highly similar to multiple mutually dissimilar neighborhoods in the high-dimensional space. Standard DR methods cannot faithfully project such instances, since each data instance is mapped to a single point in the visual space. As a result, such an instance is placed in only one of its neighborhoods (or in none at all), so only part of its neighborhood structure is represented. We call this distortion partial neighborhood embedding. In this paper, we introduce a graph-based approach that identifies ambiguous instances and replicates them as multiple points in the projection, placing each copy within its respective neighborhood. We use UMAP for our results, but our approach also generalizes to other local graph-based DR techniques, and we show that our approach reveals previously hidden neighborhood memberships in projections and reduces partial neighborhood embedding across multiple examples, and is further supported by quantitative analyses.
Editorial analysis
A structured set of objections, weighed in public.
Referee Report
Summary. The paper identifies ambiguous instances—points in high-dimensional space that are highly similar to multiple mutually dissimilar neighborhoods—as a source of visual artifacts in dimensionality reduction (DR). It proposes a graph-based method to detect such instances entirely in the original high-dimensional similarity graph, replicate each as multiple points, and embed the copies into their respective neighborhoods during projection (demonstrated with UMAP but claimed to generalize to other local graph-based DR methods). The central claims are that this reveals previously hidden neighborhood memberships and reduces partial neighborhood embedding, supported by examples and quantitative analyses.
Significance. If the claims hold, the work addresses an under-recognized source of distortion in neighborhood discovery from DR projections by operating the detection step upstream of any lossy embedding. The high-dimensional graph construction insulates identification from projection artifacts, avoiding the circularity concern raised in the stress-test note. Strengths include the parameter-free framing of the core procedure and the attempt at quantitative support beyond visual examples.
major comments (2)
- [§3] §3 (Method): The definition of 'ambiguous instances' and the procedure for identifying 'mutually dissimilar neighborhoods' via the high-dimensional similarity graph are not accompanied by explicit thresholds, similarity measures, or pseudocode; without these, the quantitative analyses in §4 cannot be reproduced or verified as load-bearing evidence for reduced partial neighborhood embedding.
- [§4] §4 (Quantitative analyses): No error bars, baseline comparisons, or controls for post-hoc parameter choices in the splitting decision are reported; the claim that the approach 'reduces partial neighborhood embedding across multiple examples' therefore rests on unverifiable metrics.
minor comments (2)
- [Abstract] The abstract states the method 'generalizes to other local graph-based DR techniques' but provides no explicit statement of the required interface (e.g., neighborhood graph input) in the main text.
- [Figures] Figure captions should explicitly state whether the shown projections use the original UMAP or the modified splitting procedure for direct visual comparison.
Simulated Author's Rebuttal
We thank the referee for the constructive feedback and for recognizing the potential significance of addressing ambiguous instances upstream of the embedding step. We respond point-by-point to the major comments below.
read point-by-point responses
-
Referee: [§3] §3 (Method): The definition of 'ambiguous instances' and the procedure for identifying 'mutually dissimilar neighborhoods' via the high-dimensional similarity graph are not accompanied by explicit thresholds, similarity measures, or pseudocode; without these, the quantitative analyses in §4 cannot be reproduced or verified as load-bearing evidence for reduced partial neighborhood embedding.
Authors: The procedure is deliberately parameter-free and operates exclusively on the input similarity graph (using the same similarity measure and neighborhood construction already required by the downstream DR method such as UMAP). No additional thresholds are introduced. To improve reproducibility and allow direct verification of the §4 metrics, we will insert explicit pseudocode for the detection and replication steps into the revised §3. revision: yes
-
Referee: [§4] §4 (Quantitative analyses): No error bars, baseline comparisons, or controls for post-hoc parameter choices in the splitting decision are reported; the claim that the approach 'reduces partial neighborhood embedding across multiple examples' therefore rests on unverifiable metrics.
Authors: Because the splitting decision is deterministic and parameter-free once the high-dimensional graph is fixed, post-hoc parameter controls are not applicable. We agree, however, that the current quantitative section would be strengthened by baseline comparisons (standard DR without splitting) and by explicit reporting of the metrics used to quantify partial neighborhood embedding. We will add these elements and clarify any sources of variation in the revised §4. revision: yes
Circularity Check
No significant circularity; method operates entirely in high-dimensional space prior to projection
full rationale
The paper's core procedure constructs a high-dimensional similarity graph to detect ambiguous instances (points similar to multiple dissimilar neighborhoods) and replicates them before any DR is applied. Identification and splitting decisions occur in the original space, insulated from projection artifacts. No equations or steps reduce by construction to fitted parameters, self-definitions, or self-citation chains. The derivation is self-contained against external benchmarks with no load-bearing self-referential elements.
Axiom & Free-Parameter Ledger
Lean theorems connected to this paper
-
IndisputableMonolith/Foundation/AbsoluteFloorClosure.lean; IndisputableMonolith/Cost/FunctionalEquation.leanreality_from_one_distinction; washburn_uniqueness_aczel unclear?
unclearRelation between the paper passage and the cited Recognition theorem.
We introduce a graph-based approach that identifies ambiguous instances and replicates them as multiple points in the projection... using local articulation points (LAPr) on sparsified UMAP graphs
What do these tags mean?
- matches
- The paper's claim is directly supported by a theorem in the formal canon.
- supports
- The theorem supports part of the paper's argument, but the paper may add assumptions or extra steps.
- extends
- The paper goes beyond the formal theorem; the theorem is a base layer rather than the whole result.
- uses
- The paper appears to rely on the theorem as machinery.
- contradicts
- The paper's claim conflicts with a theorem or certificate in the canon.
- unclear
- Pith found a possible connection, but the passage is too broad, indirect, or ambiguous to say the theorem truly supports the claim.
Reference graph
Works this paper leans on
-
[1]
M. Aupetit. Visualizing distortions and recovering topology in continuous projection techniques.Neurocomputing, 70(7):1304–1330, Mar. 2007. doi: 10.1016/j.neucom.2006.11.018 1
- [2]
-
[3]
E. Becht, L. McInnes, J. Healy, C.-A. Dutertre, I. W. H. Kwok, L. G. Ng et al. Dimensionality reduction for visualizing single-cell data using UMAP. Nature Biotechnology, 37(1):38–44, Jan. 2019. doi: 10.1038/nbt.4314 7
-
[5]
T. Chari and L. Pachter. The specious art of single-cell genomics.PLOS Computational Biology, 19(8):e1011288, Aug. 2023. doi: 10.1371/journal .pcbi.1011288 1
-
[6]
H. Doraiswamy, J. Tierny, P. J. Silva, L. G. Nonato, and C. Silva. Topomap: A 0-dimensional homology preserving projection of high-dimensional data. IEEE Transactions on Visualization and Computer Graphics, 27(2):561– 571, 2020. doi: 10.1109/TVCG.2020.3030441 2
-
[7]
D. Eppstein, P. Kindermann, S. Kobourov, G. Liotta, A. Lubiw, A. Maig- nan et al. On the planar split thickness of graphs.Algorithmica, 80(3):977– 994, 2018. doi: 10.1007/s00453-017-0328-y 3
-
[8]
M. Espadoto, R. M. Martins, A. Kerren, N. S. Hirata, and A. C. Telea. Toward a quantitative survey of dimension reduction techniques.IEEE Transactions on Visualization and Computer Graphics, 27(3):2153–2173,
-
[9]
doi: 10.1109/TVCG.2019.2944182 1, 2
-
[10]
R. Feldbauer and A. Flexer. A comprehensive empirical comparison of hubness reduction in high-dimensional spaces.Knowledge and Informa- tion Systems, 59(1):137–166, Apr 2019. doi: 10.1007/s10115-018-1205-y 3
-
[11]
G. S. Green, M. Fujita, H.-S. Yang, M. Taga, A. Cain, C. McCabe et al. Cellular communities reveal trajectories of brain ageing and Alzheimer’s disease.Nature, 633(8030):634–645, Sept. 2024. doi: 10.1038/s41586 -024-07871-6 1
-
[12]
V . Guardieiro, F. I. De Oliveira, H. Doraiswamy, L. G. Nonato, and C. Silva. Topomap++: A faster and more space efficient technique to compute projections with topological guarantees.IEEE Transactions on Visualization and Computer Graphics, 2024. doi: 10.1109/TVCG.2024. 3456365 2
-
[13]
X. Han, R. Wang, Y . Zhou, L. Fei, H. Sun, S. Lai et al. Mapping the mouse cell atlas by microwell-seq.Cell, 172(5):1091–1107, 2018. 7
work page 2018
-
[14]
Harary.Graph theory (on Demand Printing of 02787)
F. Harary.Graph theory (on Demand Printing of 02787). CRC Press,
-
[15]
doi: 10.1201/9780429493768 3
-
[16]
E. Heiter, R. Vandaele, T. De Bie, Y . Saeys, and J. Lijffijt. Incorporating topological priors into low-dimensional visualizations through topological regularization.IEEE Access, 2024. doi: 10.1109/ACCESS.2024.3456474 2
- [17]
-
[18]
M. Imre, J. Tao, Y . Wang, Z. Zhao, Z. Feng, and C. Wang. Spectrum- preserving sparsification for visualization of big graphs.Computers & Graphics, 87:89–102, 2020. doi: 10.1016/j.cag.2020.02.004 3
-
[19]
P. Isenberg, F. Heimerl, S. Koch, T. Isenberg, P. Xu, C. Stolper et al. vispubdata.org: A metadata collection about IEEE visualization (VIS) publications.IEEE Transactions on Visualization and Computer Graphics, 23(9):2199–2206, Sept. 2017. doi: 10.1109/TVCG.2016.2615308 9
-
[20]
M. Jacomy, T. Venturini, S. Heymann, and M. Bastian. ForceAtlas2, a continuous graph layout algorithm for handy network visualization designed for the gephi software.PLOS ONE, 9(6):1–12, June 2014. doi: 10.1371/journal.pone.0098679 5
-
[21]
M. Jung, J. Choi, and J. Jo. Projection ensemble: Visualizing the robust structures of multidimensional projections. In2023 IEEE Visualization and Visual Analytics (VIS), pp. 46–50. IEEE, 2023. doi: 10.1109/VIS54172. 2023.00018 2
- [22]
-
[23]
S. Kaski, J. Nikkilä, M. Oja, J. Venna, P. Törönen, and E. Castrén. Trust- worthiness and metrics in visualizing similarity of gene expression.BMC bioinformatics, 4:1–13, 2003. doi: 10.1186/1471-2105-4-48 2, 8, 9
-
[24]
D. Kobak and P. Berens. The art of using t-SNE for single-cell tran- scriptomics.Nature Communications, 10(1):5416, Nov. 2019. doi: 10. 1038/s41467-019-13056-x 1
work page 2019
-
[25]
J. Lause, P. Berens, and D. Kobak. The art of seeing the elephant in the room: 2d embeddings of single-cell data do make sense.PLOS Computational Biology, 20(10):1–5, 10 2024. doi: 10.1371/journal.pcbi. 1012403 1
-
[26]
Y . LeCun, P. Haffner, L. Bottou, and Y . Bengio. Object recognition with gradient-based learning. InShape, contour and grouping in computer vision, pp. 319–345. Springer, 1999. doi: 10.1007/3-540-46805-6_19 7
-
[27]
J. A. Lee and M. Verleysen. Quality assessment of dimensionality reduc- tion: Rank-based criteria.Neurocomputing, 72(7):1431–1443, Mar. 2009. doi: 10.1016/j.neucom.2008.12.017 8
-
[28]
L. Livi and A. Rizzi. Graph ambiguity.Fuzzy Sets and Systems, 221:24–47, June 2013. doi: 10.1016/j.fss.2013.01.001 2
-
[29]
C. D. Manning, R. Prabhakar, and H. Schütze.Introduction to Information Retrieval. Cambridge University Press, 2008. 7
work page 2008
-
[30]
R. M. Martins, D. B. Coimbra, R. Minghim, and A. Telea. Visual analysis of dimensionality reduction quality for parameterized projections.Com- puters & Graphics, 41:26–42, June 2014. doi: 10.1016/j.cag.2014.01.006 1, 9
-
[31]
R. M. Martins, R. Minghim, and A. C. Telea. Explaining Neighborhood Preservation for Multidimensional Projections. InEG UK Computer Graphics & Visual Computing, 2015. 8
work page 2015
-
[32]
UMAP: Uniform Manifold Approximation and Projection for Dimension Reduction
L. McInnes, J. Healy, and J. Melville. Umap: Uniform manifold ap- proximation and projection for dimension reduction.arXiv preprint arXiv:1802.03426, 2018. doi: 10.48550/arXiv.1802.03426 2, 6
work page internal anchor Pith review Pith/arXiv arXiv doi:10.48550/arxiv.1802.03426 2018
- [33]
-
[34]
M. Nöllenburg, M. Sorge, S. Terziadis, A. Villedieu, H.-Y . Wu, and J. Wulms. Planarizing graphs and their drawings by vertex splitting.Jour- nal of Computational Geometry, 16(1):333–372, 2025. doi: 10.20382/jocg .v16i1a10 3
-
[35]
L. G. Nonato and M. Aupetit. Multidimensional projection for visual ana- lytics: Linking techniques with distortions, tasks, and layout enrichment. IEEE Transactions on Visualization and Computer Graphics, 25(8):2650– 2673, 2018. doi: 10.1109/TVCG.2018.2846735 1, 2
-
[36]
F. V . Paulovich, A. Arleo, and S. van den Elzen. When dimensionality re- duction meets graph (drawing) theory: Introducing a common framework, challenges and opportunities.CGF, 44(3):e70105, 2025. doi: 10.1111/cgf .70105 2, 3
work page doi:10.1111/cgf 2025
-
[37]
F. V . Paulovich, L. G. Nonato, R. Minghim, and H. Levkowitz. Least square projection: A fast high-precision multidimensional projection tech- nique and its application to document mapping.IEEE Transactions on Visualization and Computer Graphics, 14(3):564–575, 2008. doi: 10. 1109/TVCG.2007.70443 2, 7
-
[38]
M. Radovanovi´c, A. Nanopoulos, and M. Ivanovi´c. Hubs in space: Pop- ular nearest neighbors in high-dimensional data.J. Mach. Learn. Res., 11:2487–2531, Dec. 2010. 3
work page 2010
- [39]
-
[40]
P. E. Rauber, A. X. Falcão, and A. C. Telea. Visualizing Time-Dependent Data Using Dynamic t-SNE. InProceedings of the Eurographics/IEEE VGTC Conference on Visualization: Short Papers. Eurographics Associa- tion, 2016. 5
work page 2016
-
[41]
P. C. Ribeiro, G. G. Schardong, S. D. Barbosa, C. S. de Souza, and H. Lopes. Visual exploration of an ensemble of classifiers.Computers & Graphics, 85:23–41, 2019. doi: 10.1016/j.cag.2019.08.012 1
-
[42]
J. Ros, A. Arleo, and F. V . Paulovich. Scalable Force Scheme: A fast method for projecting large datasets.EuroVis Workshop on Visual Analyt- ics (EuroVA) 2025, 2025. doi: 10.2312/EUROV A.20251098 2
- [43]
-
[44]
J. W. Sammon. A nonlinear mapping for data structure analysis.IEEE Transactions on computers, 100(5):401–409, 1969. doi: 10.1109/T-C. 1969.222678 2
work page doi:10.1109/t-c 1969
-
[45]
B. W. B. Shires and C. J. Pickard. Visualizing energy landscapes through manifold learning.Phys. Rev. X, 11:041026, Nov 2021. doi: 10.1103/ PhysRevX.11.041026 1
work page 2021
-
[46]
D. A. Spielman and N. Srivastava. Graph sparsification by effective resistances. InProceedings of the Fortieth Annual ACM Symposium on Theory of Computing, pp. 563–568. ACM, Victoria British Columbia Canada, May 2008. doi: 10.1145/1374376.1374456 3, 4
-
[47]
J. Tang, J. Liu, M. Zhang, and Q. Mei. Visualizing large-scale and high- dimensional data. InProceedings of the 25th international conference on world wide web, pp. 287–297, 2016. doi: 10.1145/2872427.2883041 2
-
[48]
R. Tarjan. Depth-first search and linear graph algorithms.SIAM journal on computing, 1(2):146–160, 1972. doi: 10.1137/0201010 3, 4
-
[49]
E. Tejada, R. Minghim, and L. G. Nonato. On improved projection techniques to support visual exploration of multi-dimensional data sets. Information Visualization, 2(4):218–231, 2003. doi: 10.1057/palgrave.ivs. 9500054 2
-
[50]
J. B. Tenenbaum, V . d. Silva, and J. C. Langford. A global geometric frame- work for nonlinear dimensionality reduction.science, 290(5500):2319– 2323, 2000. doi: 10.1126/science.290.5500.2319 2
-
[51]
W. S. Torgerson. Multidimensional scaling: I. theory and method.Psy- chometrika, 17(4):401–419, 1952. doi: 10.1007/BF02288916 2
-
[52]
L. Van der Maaten and G. Hinton. Visualizing data using t-sne.Journal of machine learning research, 9(11), 2008. 2, 7
work page 2008
-
[53]
L. Van der Maaten and G. Hinton. Visualizing non-metric similarities in multiple maps.Machine learning, 87(1):33–55, 2012. doi: 10.1007/ s10994-011-5273-4 2
work page 2012
-
[54]
R. G. Viegas, I. B. S. Martins, M. N. Sanches, A. B. Oliveira Junior, J. B. d. Camargo, F. V . Paulovich et al. Elvim: Exploring biomolecular energy landscapes through multidimensional visualization.Journal of Chemical Information and Modeling, 64(8):3443–3450, Apr 2024. doi: 10.1021/acs. jcim.4c00034 1
work page doi:10.1021/acs 2024
-
[55]
F. Wan, M. D. T. Torres, J. Peng, and C. de la Fuente-Nunez. Deep- learning-enabled antibiotic discovery through molecular de-extinction. Nature Biomedical Engineering, 8(7):854–871, July 2024. doi: 10.1038/ s41551-024-01201-x 1
work page 2024
- [56]
-
[57]
K. Yan and W. Cui. Visualizing the uncertainty induced by graph layout algorithms. In2017 IEEE Pacific Visualization Symposium (PacificVis), pp. 200–209, 2017. doi: 10.1109/PACIFICVIS.2017.8031595 3
-
[58]
S. Yu, L. Gao, and R. Song. Local articulation points in complex networks. arXiv preprint arXiv:1812.10631, 2018. doi: 10.48550/arXiv.1812.10631 4
work page internal anchor Pith review Pith/arXiv arXiv doi:10.48550/arxiv.1812.10631 2018
discussion (0)
Sign in with ORCID, Apple, or X to comment. Anyone can read and Pith papers without signing in.