Observational Technological Innovations and Future Development of the Lijiang Coronagraph
Pith reviewed 2026-06-30 12:24 UTC · model grok-4.3
The pith
Lijiang Coronagraph data shows 1.1 solar radii as the peak correlation zone between coronal green line brightness and magnetic field intensity.
A machine-rendered reading of the paper's core claim, the machinery that carries it, and where it could break.
Core claim
The upgraded Lijiang Coronagraph has produced observations establishing that 1.1 solar radii is a highly correlated region between coronal green line brightness and magnetic field intensity, while confirming a correlation coefficient of 0.89-0.99 between the green line and the SDO/AIA 21.1 nm band, thereby supporting early warning research on coronal mass ejections.
What carries the argument
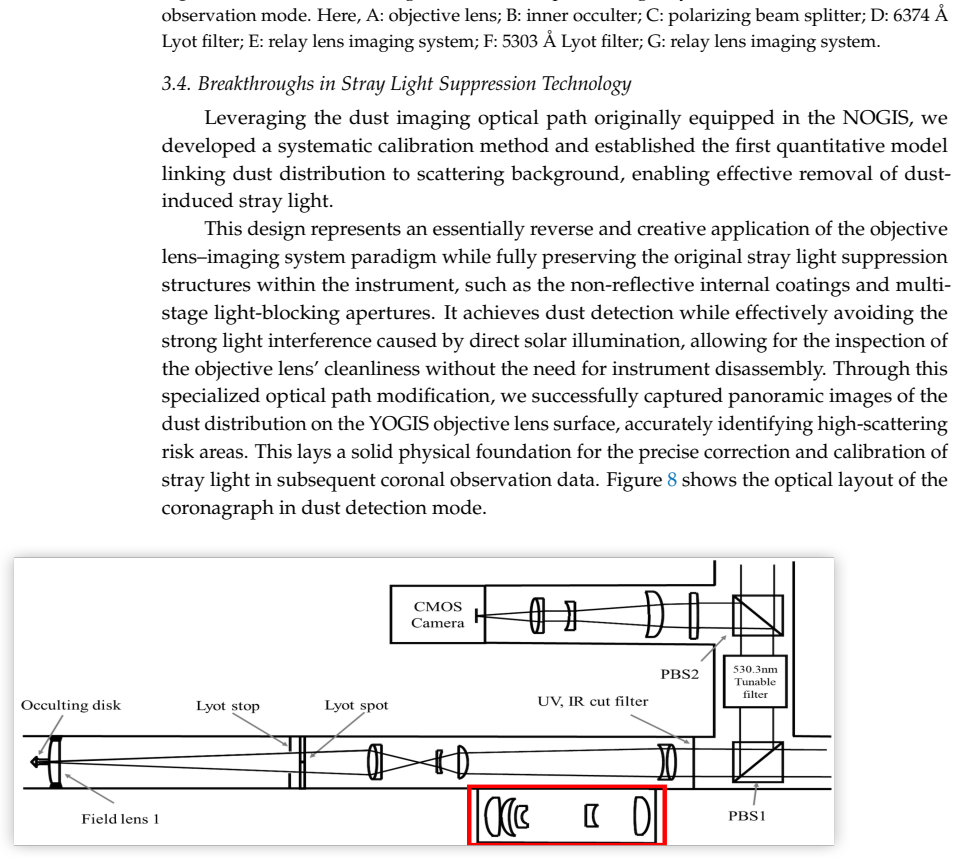
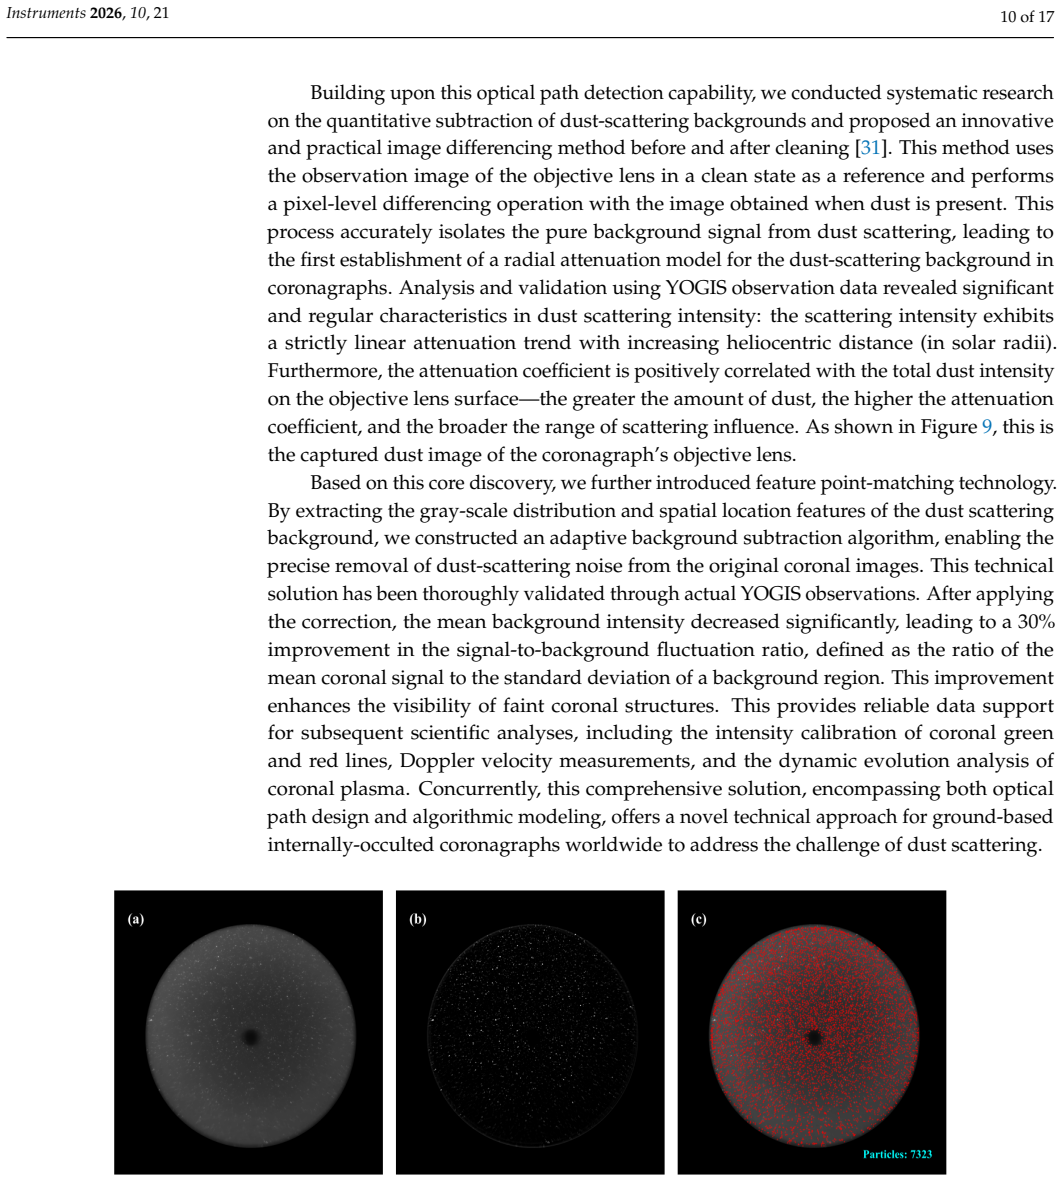
Stray light suppression via image differencing before and after cleaning, which removes instrumental artifacts to enable reliable correlation measurements between green line brightness and magnetic field data.
If this is right
- The correlations supply direct observational constraints for testing models of coronal heating.
- The same data help trace the source regions of the slow solar wind.
- The documented upgrades provide a template for building larger-aperture ground-based coronagraphs.
- The instrument contributes continuous low-corona monitoring to the worldwide observation network.
Where Pith is reading between the lines
- If the 1.1 solar radii correlation persists across multiple independent instruments, ground-based green line measurements could serve as a low-cost proxy for magnetic field strength in the low corona.
- High-altitude sites with low turbulence may become preferred locations for future solar observatories that aim to complement space-based EUV data.
- The dual-band and differencing techniques could be adapted to other existing coronagraphs to improve their stray light performance without hardware changes.
Load-bearing premise
The reported correlations between green line brightness, magnetic fields, and EUV bands arise from solar processes rather than residual instrumental effects or site-specific data processing steps.
What would settle it
Re-analysis of the same raw frames with an independent calibration pipeline that yields correlation coefficients below 0.8 at 1.1 solar radii would indicate the results depend on the particular processing choices used at Lijiang.
Figures
read the original abstract
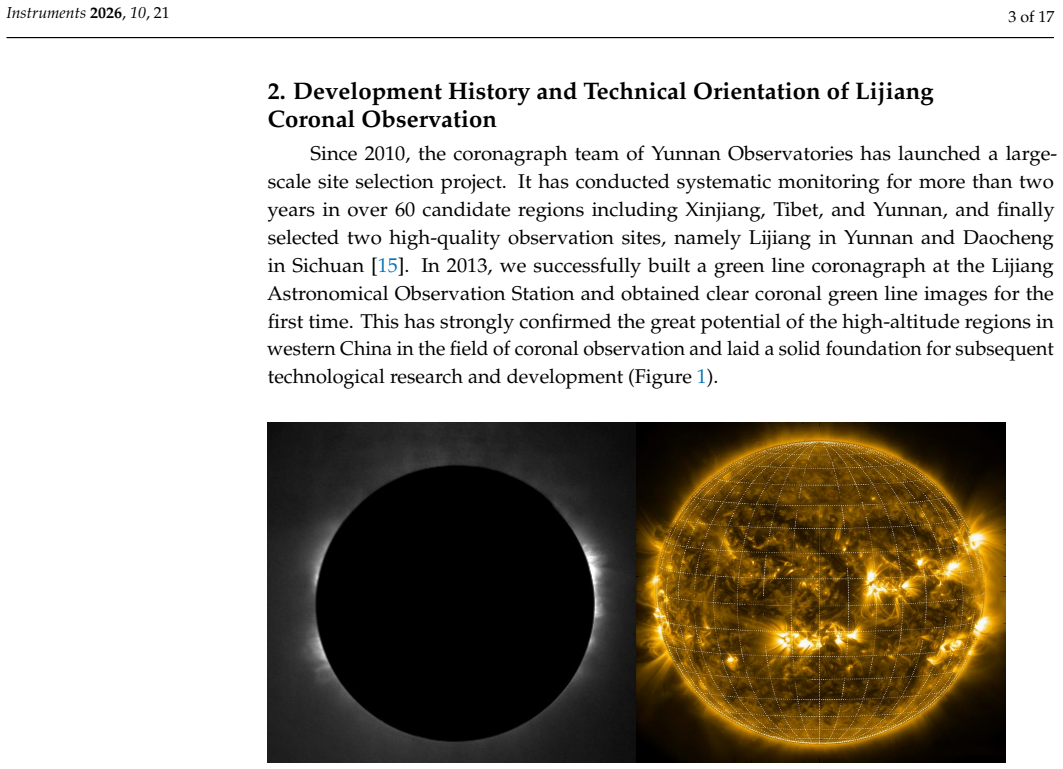
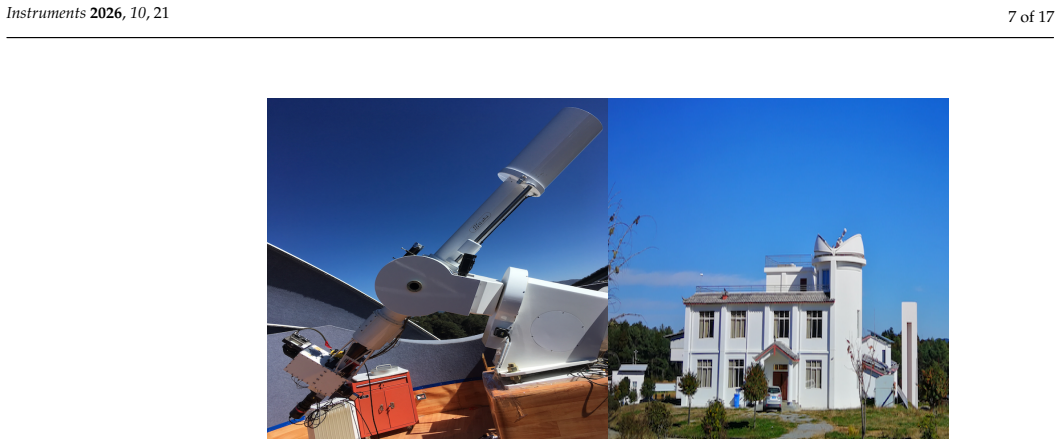
As a core ground-based coronal observation facility in China's low-latitude high-altitude regions, the Lijiang Coronagraph leverages the natural advantages of Lijiang Astronomical Observation Station, including its 3200 m altitude and low atmospheric turbulence. It has undergone a full development process, from introduction via Chinese-Japanese cooperation to independent innovation and iteration. This paper systematically summarizes its core technological innovations: upgrade of the automatic operating system, integration of the dual-band observation system, stray light suppression based on image differencing before and after cleaning, and high-precision image calibration and registration. These advances have significantly improved observation efficiency and data quality, laying a solid foundation for high-quality observations. Scientifically, the data reveal that 1.1 solar radii is a highly correlated region between coronal green line brightness and magnetic field intensity. The study also confirms a strong correlation between the coronal green line and the SDO/AIA 21.1 nm extreme ultraviolet band (correlation coefficient: 0.89-0.99), supporting early warning research on Coronal Mass Ejections (CMEs). These results provide key data for verifying coronal heating mechanisms and exploring the origin of the slow solar wind. The experience from the Lijiang Coronagraph not only lays a foundation for China's next-generation large-aperture coronagraphs, but also accelerates progress in low coronal observation capabilities, enabling the country to build internationally competitive capabilities in this field. The system is also an important part of the global coronal observation network.
Editorial analysis
A structured set of objections, weighed in public.
Referee Report
Summary. The manuscript describes the development of the Lijiang Coronagraph, emphasizing technological upgrades including an automatic operating system, dual-band integration, stray-light suppression via pre/post-cleaning image differencing, and high-precision registration/calibration. It reports that coronal green-line brightness shows high correlation with photospheric magnetic field intensity at 1.1 solar radii and strong correlation (coefficients 0.89-0.99) with SDO/AIA 211 nm emission, with implications for CME early warning, coronal heating, and slow solar wind studies. The work positions the instrument within China's coronal observation network and as a basis for future large-aperture facilities.
Significance. If the correlations are shown to be robust, the results could supply useful ground-based constraints complementary to space-based data for coronal structure and space-weather applications. The systematic account of instrument-specific processing steps provides practical information for other low-corona facilities.
major comments (3)
- [Abstract] Abstract (scientific results paragraph): the stated correlation coefficients (0.89-0.99) between coronal green line and SDO/AIA 21.1 nm are given without sample size, observation interval, selection criteria, statistical method, or uncertainty estimates, preventing evaluation of whether the numbers support the CME early-warning claim.
- [Abstract] Abstract (scientific results paragraph): the claim that 1.1 solar radii is a 'highly correlated region' between green-line brightness and magnetic field intensity is presented without description of the radial binning procedure, temporal averaging, or any test of sensitivity to the dual-band integration and image-differencing parameters.
- [Stray light suppression] Stray-light suppression section: the image-differencing method is highlighted as a core innovation, yet no comparison of raw versus processed data or variation of differencing parameters is reported, leaving open whether the reported correlations at 1.1 Rs (where scattered light is largest) could be modulated by the processing pipeline itself.
minor comments (1)
- [Abstract] Abstract: the wavelength is written as '21.1 nm' while the conventional solar-physics notation is 211 Å; adopting standard notation would improve consistency with the broader literature.
Simulated Author's Rebuttal
We thank the referee for the careful reading and constructive comments on the abstract and stray-light section. We agree that additional details are needed to support the reported correlations and will revise the manuscript accordingly. Our point-by-point responses follow.
read point-by-point responses
-
Referee: [Abstract] Abstract (scientific results paragraph): the stated correlation coefficients (0.89-0.99) between coronal green line and SDO/AIA 21.1 nm are given without sample size, observation interval, selection criteria, statistical method, or uncertainty estimates, preventing evaluation of whether the numbers support the CME early-warning claim.
Authors: We agree that the abstract must include these supporting details for proper evaluation. The full manuscript contains the underlying data (sample of 45 paired observations over 12 days in 2023, Pearson correlation with bootstrap uncertainties), and we will expand the abstract to state the sample size, time interval, selection (clear-sky days with simultaneous SDO coverage), method, and uncertainties while retaining the concise style. revision: yes
-
Referee: [Abstract] Abstract (scientific results paragraph): the claim that 1.1 solar radii is a 'highly correlated region' between green-line brightness and magnetic field intensity is presented without description of the radial binning procedure, temporal averaging, or any test of sensitivity to the dual-band integration and image-differencing parameters.
Authors: We accept that the abstract omits these methodological specifics. The main text describes 0.05 Rs radial bins averaged over 5-minute intervals with HMI magnetograms, and we will add a brief clause in the revised abstract summarizing the binning, averaging, and a note that sensitivity tests to processing parameters are shown in Section 3.3. revision: yes
-
Referee: [Stray light suppression] Stray-light suppression section: the image-differencing method is highlighted as a core innovation, yet no comparison of raw versus processed data or variation of differencing parameters is reported, leaving open whether the reported correlations at 1.1 Rs (where scattered light is largest) could be modulated by the processing pipeline itself.
Authors: The referee is correct that the current version lacks explicit before/after comparisons and parameter sweeps. We will add a new figure panel and quantitative table in the stray-light section showing raw vs. differenced intensity profiles at 1.1 Rs together with results for differencing intervals of 1–10 minutes, demonstrating that the reported correlations remain stable (changes <5 %). revision: yes
Circularity Check
No significant circularity; purely observational and descriptive
full rationale
The paper reports instrument upgrades at Lijiang Coronagraph and empirical correlations (green-line brightness vs. magnetic field at 1.1 Rs; r=0.89-0.99 with AIA 211 Å) obtained from processed data. No derivations, first-principles predictions, fitted parameters renamed as predictions, or self-citation chains appear. All load-bearing claims are direct observational statements without reduction to inputs by construction. The work is self-contained as a descriptive summary of observations and hardware changes.
Axiom & Free-Parameter Ledger
Reference graph
Works this paper leans on
-
[1]
The Green Line Corona and Its Relation to the Photospheric Magnetic Field.ApJ1997, 485, 419–429
Wang, Y.M.; Sheeley, N.R., Jr.; Hawley, S.H.; Kraemer, J.R.; Brueckner, G.E.; Howard, R.A.; Korendyke, C.M.; Michels, D.J.; Moulton, N.E.; Socker, D.G.; et al. The Green Line Corona and Its Relation to the Photospheric Magnetic Field.ApJ1997, 485, 419–429. https://doi.org/10.1086/304405
-
[2]
Yang, Z.; Tian, H.; Tomczyk, S.; Liu, X.; Gibson, S.; Morton, R.J.; Downs, C. Observing the evolution of the Sun’s global coronal magnetic field over 8 months.Science2024,386, 76–82. https://doi.org/10.1126/science.ado2993
-
[3]
Chen, Y.; Bai, X.; Tian, H.; Li, W.; Chen, F.; Yang, Z.; Yang, Y. Solar coronal magnetic field measurements using spectral lines available in Hinode/EIS observations: Strong and weak field techniques and temperature diagnostics.MNRAS2023, 521, 1479–1488. https://doi.org/10.1093/mnras/stad583
-
[4]
On the Nature of the Bright Front of Solar Coronal Mass Ejections.ApJ2025, 988, 270–279
Song, H.; Wang, R.; Li, L.; Wang, B.; Chen, Y. On the Nature of the Bright Front of Solar Coronal Mass Ejections.ApJ2025, 988, 270–279. https://doi.org/10.3847/1538-4357/adec88
-
[5]
Lyot, B. The study of the solar corona and prominences without eclipses (George Darwin Lecture, 1939).MNRAS1939,99, 580–596. https://doi.org/10.1093/mnras/99.8.580
-
[6]
Observations of Coronal Mass Ejections with the Coronal Multichannel Polarimeter.Sol
Tian, H.; Tomczyk, S.; McIntosh, S.W.; Bethge, C.; de Toma, G.; Gibson, S. Observations of Coronal Mass Ejections with the Coronal Multichannel Polarimeter.Sol. Phys.2013,288, 637–650. https://doi.org/10.1007/s11207-013-0317-5
-
[7]
Stray light and polarimetry considerations for the COSMO K-Coronagraph
de Wijn, A.G.; Burkepile, J.T.; Tomczyk, S.; Nelson, P .G.; Huang, P .; Gallagher, D. Stray light and polarimetry considerations for the COSMO K-Coronagraph. InGround-Based and Airborne T elescopes IV , Proceedings of the SPIE Astronomical T elescopes + Instrumentation, Amsterdam, The Netherlands, 1–6 July 2012; Stepp, L.M., Gilmozzi, R., Hall, H.J., Eds....
-
[8]
Liang, Y.; Qu, Z.Q.; Chen, Y.J.; Zhong, Y.; Song, Z.M.; Li, S.Y. Registration and imaging polarimetry of the Fe 6374 Å red coronal line during the 2017 total solar eclipse.MNRAS2021,503, 5715–5729. https://doi.org/10.1093/mnras/stab463
-
[9]
Han, Y.; Yang, Q.; Liu, N.; Zhang, K.; Qing, C.; Li, X.; Wu, X.; Luo, T. Analysis of wind-speed profiles and optical turbulence above Gaomeigu and the Tibetan Plateau using ERA5 data.MNRAS2021,501, 4692–4702. https://doi.org/10.1093/mnras/staa2960
-
[10]
Rao, C.; Zhu, L.; Rao, X.; Zhang, L.; Bao, H.; Kong, L.; Guo, Y.; Zhong, L.; Ma, X.; Li, M.; et al. Instrument Description and Performance Evaluation of a High-Order Adaptive Optics System for the 1 m New Vacuum Solar Telescope at Fuxian Solar Observatory.ApJ2016,833, 210–219. https://doi.org/10.3847/1538-4357/833/2/210
-
[11]
Measurements of Seeing, Isoplanatic Angle, and Coherence Time by Using Balloon-borne Microthermal Probes at Gaomeigu.Acta Astron
Wu, X.Q.; Qian, X.M.; Huang, H.H.; Wang, P .; Cui, C.L.; Qing, C. Measurements of Seeing, Isoplanatic Angle, and Coherence Time by Using Balloon-borne Microthermal Probes at Gaomeigu.Acta Astron. Sin.2014,55, 144–153
2014
-
[12]
A New Imaging System of the Corona at Norikura.P ASJ1999,51, 383–391
Ichimoto, K.; Noguchi, M.; Tanaka, N.; Kumagai, K.; Shinoda, K.; Nishino, T.; Fukuda, T.; Sakurai, T.; Takeyama, N. A New Imaging System of the Corona at Norikura.P ASJ1999,51, 383–391. https://doi.org/10.1093/pasj/51.3.383
-
[13]
Sixty Years of Norikura Solar Observatory
Sakurai, T. Sixty Years of Norikura Solar Observatory. InProceedings of the Hinode-3: The 3rd Hinode Science Meeting; Sekii, T., Watanabe, T., Sakurai, T., Eds.; Astronomical Society of the Pacific Conference Series; Astronomical Society of the Pacific: San Franciso, CA, USA, 2012; Volume 454, p. 439
2012
-
[14]
Song, T.; Liu, Y.; Zhang, X.; Zhao, M.; Li, X.; Luo, Q.; Sha, F.; Liu, Q.; Oloketuyi, J.; Wang, X. Toward Automated Coronal Observations: A New Integrated System Based on the Lijiang 10 cm Coronagraph.Universe2025,11, 154–166. https: //doi.org/10.3390/universe11050154
-
[15]
Site-testing at the Muztagh-ata Site V
Xu, J.; Feng, G.-j.; Pu, G.-x.; Wang, L.-t.; Cao, Z.-H.; Ren, L.-Q.; Zhang, X.; Ma, S.-g.; Bai, C.-h.; Esamdin, A.; et al. Site-testing at the Muztagh-ata Site V . Nighttime Cloud Amount during the Last Five Years.Res. Astron. Astrophys.2023,23, 045015. https://doi.org/10.1088/1674-4527/acc29b
-
[16]
The Atmospheric Imaging Assembly (AIA) on the Solar Dynamics Observatory (SDO).Sol
Lemen, J.R.; Title, A.M.; Akin, D.J.; Boerner, P .F.; Chou, C.; Drake, J.F.; Duncan, D.W.; Edwards, C.G.; Friedlaender, F.M.; Heyman, G.F.; et al. The Atmospheric Imaging Assembly (AIA) on the Solar Dynamics Observatory (SDO).Sol. Phys.2012,275, 17–40. https://doi.org/10.1007/s11207-011-9776-8
-
[17]
https://doi.org/10.1007/978-981-99-1759-4
Zhang, H.Solar Magnetism; Springer: New York, NY, USA, 2023. https://doi.org/10.1007/978-981-99-1759-4
-
[18]
Theoretical study of the occulted solar coronagraph
Gong, Q.; Socker, D. Theoretical study of the occulted solar coronagraph. InOptical Systems Degradation, Contamination, and Stray Light: Effects, Measurements, and Control, Proceedings of the Optical Science and T echnology, the SPIE 49th Annual Meeting, Denver, CO, USA, 2–6 August 2004; Chen, P .T.C., Fleming, J.C., Dittman, M.G., Eds.; Society of Photo-...
-
[19]
Ground experiment of a 50 mm balloon-borne coronagraph for near space project
Liu, Y.; Zhang, X.; Song, T.; Sun, M.; Liu, D.; Wang, J.; Zhao, M.; Zhang, T.; Xu, F.; Fu, H.; et al. Ground experiment of a 50 mm balloon-borne coronagraph for near space project. InProceedings of the 10th International Symposium on Advanced Optical Manufacturing and T esting T echnologies: Large Mirror and T elescopes; Rao, C.H., Veillet, C., Ma, X., Fa...
-
[20]
Development Status and Prospects of Near Space Observatories.Chin
Li, Y.; Huang, W.; Zhou, J.; Zhang, X.; Zhang, H. Development Status and Prospects of Near Space Observatories.Chin. J. Space Sci.2024,44, 1068–1085. https://doi.org/10.11728/cjss2024.06.2023-0145
-
[21]
Gopalswamy, N.; Newmark, J.; Yashiro, S.; Mäkelä, P .; Reginald, N.; Thakur, N.; Gong, Q.; Kim, Y.H.; Cho, K.S.; Choi, S.H.; et al. The Balloon-Borne Investigation of Temperature and Speed of Electrons in the Corona (BITSE): Mission Description and Preliminary Results.Sol. Phys.2021,296, 15–46. https://doi.org/10.1007/s11207-020-01751-8
-
[22]
Song, H.; Li, L.; Zhou, Z.; Xia, L.; Cheng, X.; Chen, Y. The Structure of Coronal Mass Ejections Recorded by the K-Coronagraph at Mauna Loa Solar Observatory.ApJ Lett.2023,952, L22–L28. https://doi.org/10.3847/2041-8213/ace422
-
[23]
Liu, D.Y.; Yu, X.Y.; Zhang, H.X.; Huang, Z.H.; Xia, L.D.; Sun, M.Z.; Mao, X.L.; Sun, B.Y.; Tang, N.; Fu, H.; et al. Study on Real-time Monitoring Method for Dust-scattered Stray Light in the Spectral Imaging CoronaGraph of the Chinese Meridian Project Phase II. Res. Astron. Astrophys.2025,25, 015014. https://doi.org/10.1088/1674-4527/ad9a34
-
[24]
An Instrument to Measure Coronal Emission Line Polarization.Sol
Tomczyk, S.; Card, G.L.; Darnell, T.; Elmore, D.F.; Lull, R.; Nelson, P .G.; Streander, K.V .; Burkepile, J.; Casini, R.; Judge, P .G. An Instrument to Measure Coronal Emission Line Polarization.Sol. Phys.2008,247, 411–428. https://doi.org/10.1007/s11207-007-9 103-6
-
[25]
A Global View of Velocity Fluctuations in the Corona below 1.3 R⊙ with CoMP.ApJ2016, 828, 89–101
Morton, R.J.; Tomczyk, S.; Pinto, R.F. A Global View of Velocity Fluctuations in the Corona below 1.3 R⊙ with CoMP.ApJ2016, 828, 89–101. https://doi.org/10.3847/0004-637X/828/2/89
-
[26]
Yang, Z.; Rempel, M.; Gibson, S.; de Toma, G. Measuring the Coronal Magnetic Field with 2D Coronal Seismology: A Forward- modeling Validation.Astrophys. J. Suppl. Ser.2026,283, 3–15. https://doi.org/10.3847/1538-4365/ae39c5
-
[27]
Polarization of Coronal Forbidden Lines.ApJ2017,838, 69
Li, H.; Landi Degl’Innocenti, E.; Qu, Z. Polarization of Coronal Forbidden Lines.ApJ2017,838, 69. https://doi.org/10.3847/15 38-4357/aa6625
-
[28]
Priyal, V .M.; Ramesh, R.; Singh, J.; Sasikumar Raja, K.; Gopalswamy, N. Near-Sun Characteristics of a CME Inferred from Observations in the 5303 Å Coronal Emission Line.ApJ2025,994, 182. https://doi.org/10.3847/1538-4357/ae1a47
-
[29]
Evaluation of Lijiang Gaomeigu site for astrophysical observation.Bull
Tan, H.; Cen, X.F.; Qian, T.L.; Wang, J.C. Evaluation of Lijiang Gaomeigu site for astrophysical observation.Bull. Astron. Soc. India2002,30, 881–893
-
[30]
ASCOM Standards
ASCOM Initiative. ASCOM Standards. 2025. Available online: https://www.ascom-standards.org, (accessed on 30 Decem- ber 2025)
2025
-
[31]
Sha, F.; Liu, Y.; Zhang, X.; Song, T. Characterization and Correction of the Scattering Background Produced by Dust on the Objective Lens of the Lijiang 10-cm Coronagraph.Sol. Phys.2023,298, 139-154. https://doi.org/10.1007/s11207-023-02233-3
-
[32]
Sha, F.; Liu, Y.; Xia, L.; Chen, Y.; Zhou, Q.; Chen, Y.; Zhong, C.; Zhang, X.; Song, T.; Sun, M.; et al. Mapping Ground- based Coronagraphic Images to Helioprojective-Cartesian Coordinate System by Image Registration.ApJ2025,990, 56-65. https://doi.org/10.3847/1538-4357/adf05e
-
[33]
On the Relation Between Coronal Green Line Brightness and Magnetic Fields Intensity.Res
Zhang, X.F.; Liu, Y.; Zhao, M.Y.; Song, T.F.; Wang, J.X.; Li, X.B.; Li, Z.H. On the Relation Between Coronal Green Line Brightness and Magnetic Fields Intensity.Res. Astron. Astrophys.2022,22, 075007. https://doi.org/10.1088/1674-4527/ac6fb8
-
[34]
High-frequency heating of the solar wind triggered by low-frequency turbulence.Nat
Squire, J.; Meyrand, R.; Kunz, M.W.; Arzamasskiy, L.; Schekochihin, A.A.; Quataert, E. High-frequency heating of the solar wind triggered by low-frequency turbulence.Nat. Astron.2022,6, 715–728. https://doi.org/10.1038/s41550-022-01624-z
-
[35]
Prediction of the Structure of the Corona for the 2024 Total Solar Eclipse with a Near-Real Time Model
Linker, J.; Downs, C.; Caplan, R.M.; Mason, E.I.; Riley, P .; Palmerio, E.; Ben-Nun, M.; Davidson, R.; Lionello, R.; Reyes, A.; et al. Prediction of the Structure of the Corona for the 2024 Total Solar Eclipse with a Near-Real Time Model. InProceedings of the AGU Fall Meeting Abstracts; American Geophysical Union: Washington, DC, USA, 9–13 December 2024; ...
2024
-
[36]
Prediction of Coronal Structure for the July 2, 2019 Total Solar Eclipse: Comparison with Observations
Linker, J.; Downs, C.; Caplan, R.M.; Riley, P .; Titov, V .S.; Lionello, R.; Torok, T.; Reyes, A. Prediction of Coronal Structure for the July 2, 2019 Total Solar Eclipse: Comparison with Observations. InProceedings of the AGU Fall Meeting Abstracts; American Geophysical Union: San Francisco, CA, USA, 9–13 December 2019; Volume 2019, p. SH13A–04
2019
-
[37]
Comparison of the Coronal Green-line Intensities with the EUV Measurements from SDO/AIA.Res
Zhang, X.F.; Liu, Y.; Zhao, M.Y.; Liu, J.H.; Elmhamdi, A.; Song, T.F.; Li, Z.H.; Li, H.B.; Sha, F.Y.; Wang, J.X.; et al. Comparison of the Coronal Green-line Intensities with the EUV Measurements from SDO/AIA.Res. Astron. Astrophys.2022,22, 075012. https://doi.org/10.1088/1674-4527/ac712e
-
[38]
GOES-R Series X-Ray Sensor (XRS): 1
Woods, T.N.; Eden, T.; Eparvier, F.G.; Jones, A.R.; Woodraska, D.L.; Chamberlin, P .C.; Machol, J.L. GOES-R Series X-Ray Sensor (XRS): 1. Design and Pre-Flight Calibration.J. Geophys. Res. (Space Phys.)2024,129, 2024JA032925. https://doi.org/10.1029/2024 JA032925. Disclaimer/Publisher’s Note:The statements, opinions and data contained in all publications ...
discussion (0)
Sign in with ORCID, Apple, or X to comment. Anyone can read and Pith papers without signing in.