ROC Analysis for Evaluating Translation Quality Estimation Systems
Pith reviewed 2026-06-30 12:57 UTC · model grok-4.3
The pith
ROC analysis evaluates translation quality estimation systems consistently with standard methods while providing actionable business insights.
A machine-rendered reading of the paper's core claim, the machinery that carries it, and where it could break.
Core claim
ROC analysis is a useful approach for evaluating translation quality estimation systems because it produces results consistent with currently prevalent methods while offering several important advantages, including actionable performance insights that support business decision-making.
What carries the argument
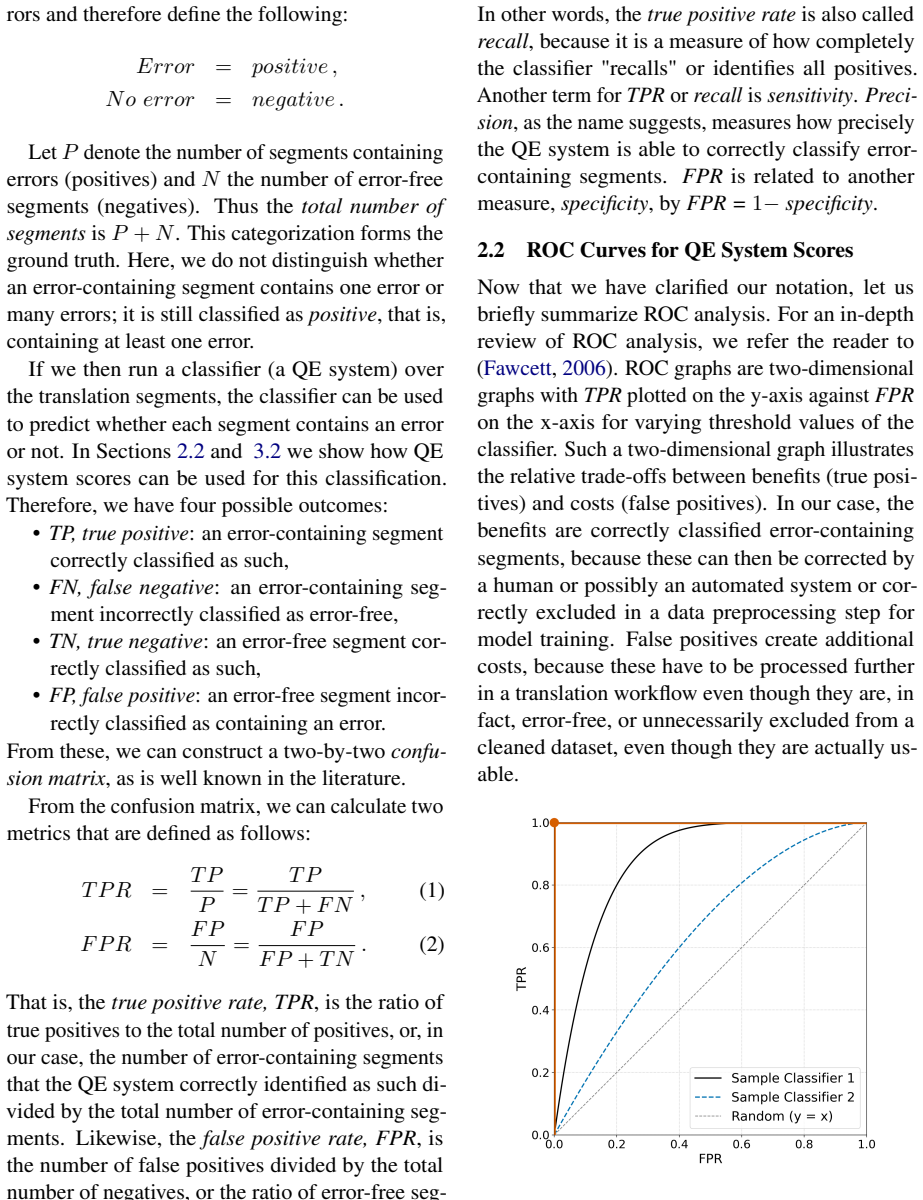
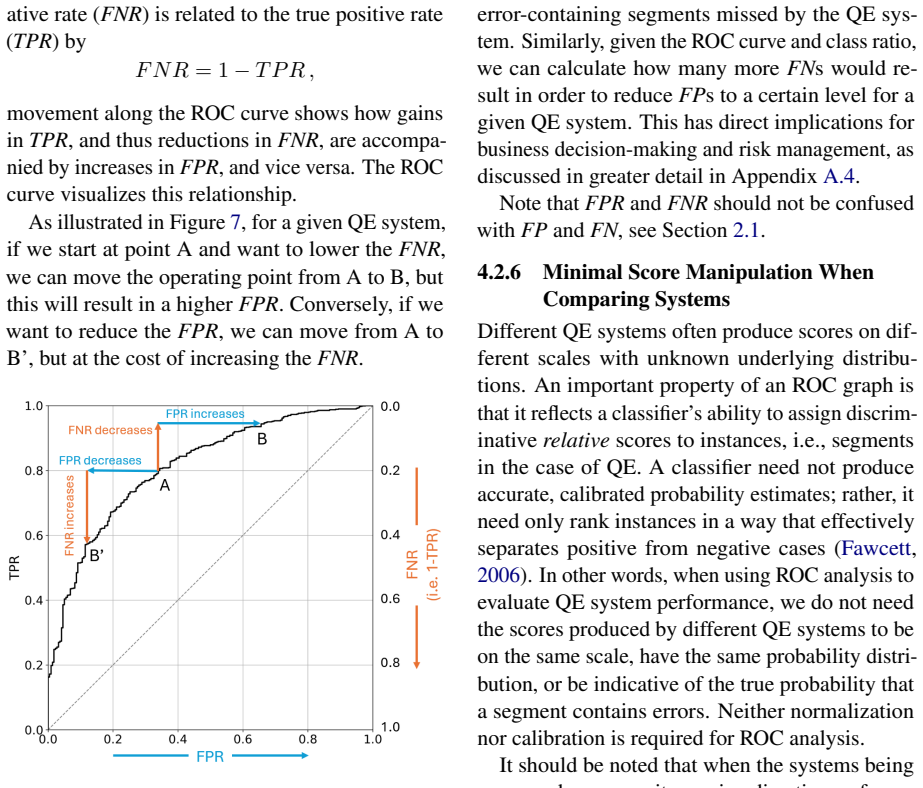
Receiver Operating Characteristic (ROC) curves, which evaluate how well a quality estimator separates acceptable from unacceptable translations across varying decision thresholds.
If this is right
- ROC analysis yields performance evaluations that align with those from current standard methods.
- The approach supplies explicit trade-off information between true and false positive rates at different thresholds.
- These insights enable direct support for business decisions such as choosing or tuning a quality estimator for production use.
- Thresholding the estimator outputs becomes a core part of the evaluation rather than an afterthought.
Where Pith is reading between the lines
- The same ROC framing could be tested on quality estimators for other language technologies beyond translation.
- Business users might combine ROC-derived thresholds with cost models to set operating points that minimize total expense.
- If QE systems output continuous scores, ROC could be applied to compare multiple estimators on the same dataset without needing new ground-truth labels.
Load-bearing premise
The outputs of translation quality estimation systems can be meaningfully thresholded and evaluated using ROC curves in a way that reveals advantages over prevalent methods for business decisions.
What would settle it
A side-by-side test on the same set of QE outputs where standard metrics and ROC disagree on which estimator is preferable for a concrete business metric such as cost per acceptable translation.
Figures
read the original abstract
The increasing use of automated translation quality estimation (QE) systems calls for practical, decision-oriented methods for evaluating their performance. We propose that Receiver Operating Characteristic (ROC) analysis is a useful approach for this purpose. Our study shows that ROC analysis not only produces results consistent with currently prevalent methods, but also offers several important advantages, including actionable performance insights that support business decision-making.
Editorial analysis
A structured set of objections, weighed in public.
Referee Report
Summary. The manuscript proposes Receiver Operating Characteristic (ROC) analysis as a practical, decision-oriented method for evaluating translation quality estimation (QE) systems. It asserts that an empirical study demonstrates ROC analysis produces results consistent with prevalent methods (such as Pearson correlation or fixed-threshold F1) while offering advantages including actionable performance insights that support business decision-making.
Significance. If the claimed empirical results were present and reproducible, the work could provide a useful alternative evaluation framework for QE systems that emphasizes threshold-based operating points over scalar metrics. However, the absence of any methods, datasets, QE systems tested, baselines, quantitative results, or error analysis means the central claim of consistency and business advantages currently has no visible grounding, limiting significance to a methodological suggestion without demonstrated value.
major comments (1)
- [Abstract] Abstract (and throughout): The central claim that 'our study shows' ROC analysis yields consistent results and actionable advantages rests on an unshown empirical study. No datasets, QE systems, prevalent baselines (e.g., Pearson correlation, F1 at fixed threshold), AUC values, operating-point comparisons, or error analysis appear in the manuscript, so the assertion of consistency and superiority for business decisions lacks any empirical support.
Simulated Author's Rebuttal
We thank the referee for the review and for identifying the central issue with our submission. We address the major comment below and outline our planned revisions.
read point-by-point responses
-
Referee: [Abstract] Abstract (and throughout): The central claim that 'our study shows' ROC analysis yields consistent results and actionable advantages rests on an unshown empirical study. No datasets, QE systems, prevalent baselines (e.g., Pearson correlation, F1 at fixed threshold), AUC values, operating-point comparisons, or error analysis appear in the manuscript, so the assertion of consistency and superiority for business decisions lacks any empirical support.
Authors: We agree with the referee that the submitted manuscript contains no empirical study, methods section, datasets, QE systems, baselines, AUC values, or quantitative comparisons. The abstract statement 'Our study shows...' is unsupported by any content in the paper. This is a clear omission. We will revise the manuscript to remove all references to an empirical study and its claimed results. The revised version will present ROC analysis strictly as a methodological proposal without unsubstantiated performance claims. If the authors later conduct and report a full empirical evaluation, that will be submitted as a separate or extended work. revision: yes
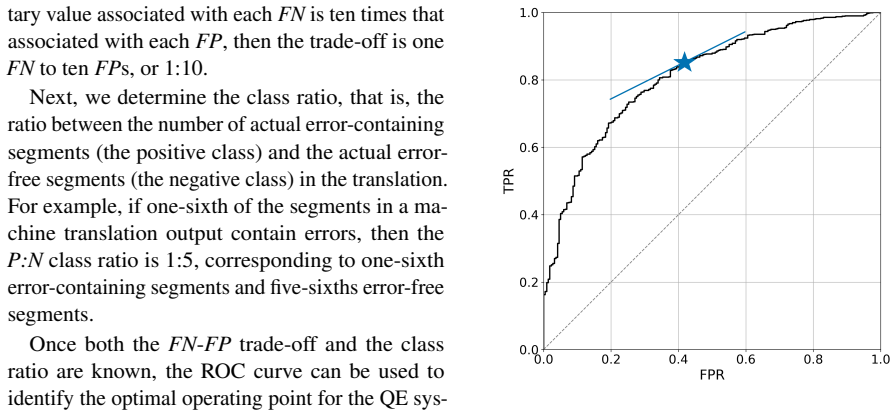
- The manuscript contains no empirical data, so we cannot supply the requested datasets, systems, baselines, or quantitative results to demonstrate consistency with Pearson correlation or fixed-threshold F1.
Circularity Check
No circularity: proposal contains no equations, fits, or self-referential derivations
full rationale
The manuscript proposes ROC analysis as an evaluation method for translation QE systems and asserts consistency with prevalent methods plus business advantages. No equations, parameters, fitted quantities, or derivation steps appear in the abstract or described content. The central claim rests on an empirical study whose details are not shown here, but nothing reduces by construction to its own inputs, self-citations, or renamed known results. The paper is therefore self-contained against external benchmarks with no load-bearing circular steps.
Axiom & Free-Parameter Ledger
Reference graph
Works this paper leans on
-
[1]
online" 'onlinestring :=
ENTRY address archivePrefix author booktitle chapter edition editor eid eprint eprinttype howpublished institution journal key month note number organization pages publisher school series title type volume year doi pubmed url lastchecked label extra.label sort.label short.list INTEGERS output.state before.all mid.sentence after.sentence after.block STRING...
-
[2]
write newline
" write newline "" before.all 'output.state := FUNCTION n.dashify 't := "" t empty not t #1 #1 substring "-" = t #1 #2 substring "--" = not "--" * t #2 global.max substring 't := t #1 #1 substring "-" = "-" * t #2 global.max substring 't := while if t #1 #1 substring * t #2 global.max substring 't := if while FUNCTION word.in bbl.in capitalize " " * FUNCT...
-
[3]
Guerreiro, Diptesh Kanojia, Jos \'e G
Frederic Blain, Chrysoula Zerva, Ricardo Rei, Nuno M. Guerreiro, Diptesh Kanojia, Jos \'e G. C. de Souza, Beatriz Silva, T \^a nia Vaz, Yan Jingxuan, Fatemeh Azadi, Constantin Orasan, and Andr \'e Martins. 2023. https://doi.org/10.18653/v1/2023.wmt-1.52 Findings of the WMT 2023 shared task on quality estimation . In Proceedings of the Eighth Conference on...
-
[4]
John Blatz, Erin Fitzgerald, George Foster, Simona Gandrabur, Cyril Goutte, Alex Kulesza, Alberto Sanchis, and Nicola Ueffing. 2004. https://aclanthology.org/C04-1046/ Confidence estimation for machine translation . In COLING 2004: Proceedings of the 20th International Conference on Computational Linguistics , pages 315--321, Geneva, Switzerland. COLING
2004
-
[5]
James Carpenter and John Bithell. 2000. https://doi.org/10.1002/(SICI)1097-0258(20000515)19:9<1141::AID-SIM479>3.0.CO;2-F Bootstrap confidence intervals: when, which, what? A practical guide for medical statisticians . Statistics in Medicine, 19(9):1141--1164
-
[6]
Bradley Efron. 1979. https://doi.org/10.1214/aos/1176344552 Bootstrap methods: Another look at the jackknife . The Annals of Statistics, 7(1):1--26
-
[7]
Tom Fawcett. 2006. https://doi.org/10.1016/j.patrec.2005.10.010 An introduction to ROC analysis . Pattern Recognition Letters, 27(8):861--874
-
[8]
Markus Freitag, Nitika Mathur, Daniel Deutsch, Chi-Kiu Lo, Eleftherios Avramidis, Ricardo Rei, Brian Thompson, Frederic Blain, Tom Kocmi, Jiayi Wang, David Ifeoluwa Adelani, Marianna Buchicchio, Chrysoula Zerva, and Alon Lavie. 2024. https://doi.org/10.18653/v1/2024.wmt-1.2 Are LLM s breaking MT metrics? R esults of the WMT 24 metrics shared task . In Pro...
-
[9]
Markus Freitag, Nitika Mathur, Chi-kiu Lo, Eleftherios Avramidis, Ricardo Rei, Brian Thompson, Tom Kocmi, Frederic Blain, Daniel Deutsch, Craig Stewart, Chrysoula Zerva, Sheila Castilho, Alon Lavie, and George Foster. 2023. https://aclanthology.org/2023.wmt-1.51 Results of WMT23 metrics shared task: Metrics might be guilty but references are not innocent ...
2023
-
[10]
James A. Hanley and Barbara J. McNeil. 1982. https://doi.org/10.1148/radiology.143.1.7063747 The meaning and use of the area under a receiver operating characteristic ( ROC ) curve . Radiology, 143(1):29--36
-
[11]
Lajos Horv \'a th, Zsuzsanna Horv \'a th, and Wang Zhou. 2008. https://doi.org/10.1016/j.jspi.2007.07.009 Confidence bands for ROC curves . Journal of Statistical Planning and Inference, 138(6):1894--1904
-
[12]
Tom Kocmi, Eleftherios Avramidis, Rachel Bawden, Ond r ej Bojar, Anton Dvorkovich, Christian Federmann, Mark Fishel, Markus Freitag, Thamme Gowda, Roman Grundkiewicz, Barry Haddow, Philipp Koehn, Benjamin Marie, Christof Monz, Makoto Morishita, Kenton Murray, Makoto Nagata, Toshiaki Nakazawa, Martin Popel, and 2 others. 2023. https://aclanthology.org/2023...
2023
-
[13]
Alon Lavie, Greg Hanneman, Sweta Agrawal, Diptesh Kanojia, Chi-Kiu Lo, Vil \'e m Zouhar, Frederic Blain, Chrysoula Zerva, Eleftherios Avramidis, Sourabh Deoghare, Archchana Sindhujan, Jiayi Wang, David Ifeoluwa Adelani, Brian Thompson, Tom Kocmi, Markus Freitag, and Daniel Deutsch. 2025. https://doi.org/10.18653/v1/2025.wmt-1.24 Findings of the WMT 25 sha...
-
[14]
Chi-kiu Lo and Michel Simard. 2019. https://doi.org/10.18653/v1/K19-1020 Fully unsupervised crosslingual semantic textual similarity metric based on BERT for identifying parallel data . In Proceedings of the 23rd Conference on Computational Natural Language Learning (CoNLL), pages 206--215, Hong Kong, China. Association for Computational Linguistics
-
[15]
Arle Lommel, Serge Gladkoff, Alan Melby, Sue Ellen Wright, Ingemar Strandvik, Katerina Gasova, Angelika Vaasa, Andy Benzo, Romina Marazzato Sparano, Monica Foresi, Johani Innis, Lifeng Han, and Goran Nenadic. 2024. https://arxiv.org/abs/2405.16969 The multi-range theory of translation quality measurement: MQM scoring models and statistical quality control...
-
[16]
Fabian Pedregosa, Ga \"e l Varoquaux, Alexandre Gramfort, Vincent Michel, Bertrand Thirion, Olivier Grisel, Mathieu Blondel, Peter Prettenhofer, Ron Weiss, Vincent Dubourg, Jake Vanderplas, Alexandre Passos, David Cournapeau, Matthieu Brucher, Matthieu Perrot, and \'E douard Duchesnay. 2011. http://jmlr.org/papers/v12/pedregosa11a.html Scikit-learn: Machi...
2011
-
[17]
Foster Provost and Tom Fawcett. 1998. Robust classification systems for imprecise environments. In Proceedings of the Fifteenth National Conference on Artificial Intelligence (AAAI-98), pages 706--713, Menlo Park, CA. AAAI Press
1998
-
[18]
Foster Provost and Tom Fawcett. 2001. https://doi.org/10.1023/A:1007601015854 Robust classification for imprecise environments . Machine Learning, 42:203--231
-
[19]
Greenbaum, Hannah Carter, Morten Nielsen, and Bjoern Peters
Eve Richardson, Raphael Trevizani, Jason A. Greenbaum, Hannah Carter, Morten Nielsen, and Bjoern Peters. 2024. https://doi.org/10.1016/j.patter.2024.100994 The receiver operating characteristic curve accurately assesses imbalanced datasets . Patterns, 5(6):100994
-
[20]
John A. Swets. 1988. https://doi.org/10.1126/science.3287615 Measuring the accuracy of diagnostic systems . Science, 240(4857):1285--1293
-
[21]
Jin Chu Wu, Alvin F. Martin, and Raghu N. Kacker. 2016. https://doi.org/10.1080/03610918.2015.1065327 Validation of nonparametric two-sample bootstrap in ROC analysis on large datasets . Communications in Statistics: Simulation and Computation, 45(5):1689--1703
-
[22]
Chrysoula Zerva, Frederic Blain, Jos \'e G. C. De Souza, Diptesh Kanojia, Sourabh Deoghare, Nuno M. Guerreiro, Giuseppe Attanasio, Ricardo Rei, Constantin Orasan, Matteo Negri, Marco Turchi, Rajen Chatterjee, Pushpak Bhattacharyya, Markus Freitag, and Andr \'e Martins. 2024. https://doi.org/10.18653/v1/2024.wmt-1.3 Findings of the quality estimation share...
discussion (0)
Sign in with ORCID, Apple, or X to comment. Anyone can read and Pith papers without signing in.