Optimizing Multidimensional Scaling in Gini Metric Spaces
Pith reviewed 2026-06-30 11:51 UTC · model grok-4.3
The pith
Gini multidimensional scaling replaces Euclidean distance with a rank-and-value pseudo-distance to improve embeddings on noisy data.
A machine-rendered reading of the paper's core claim, the machinery that carries it, and where it could break.
Core claim
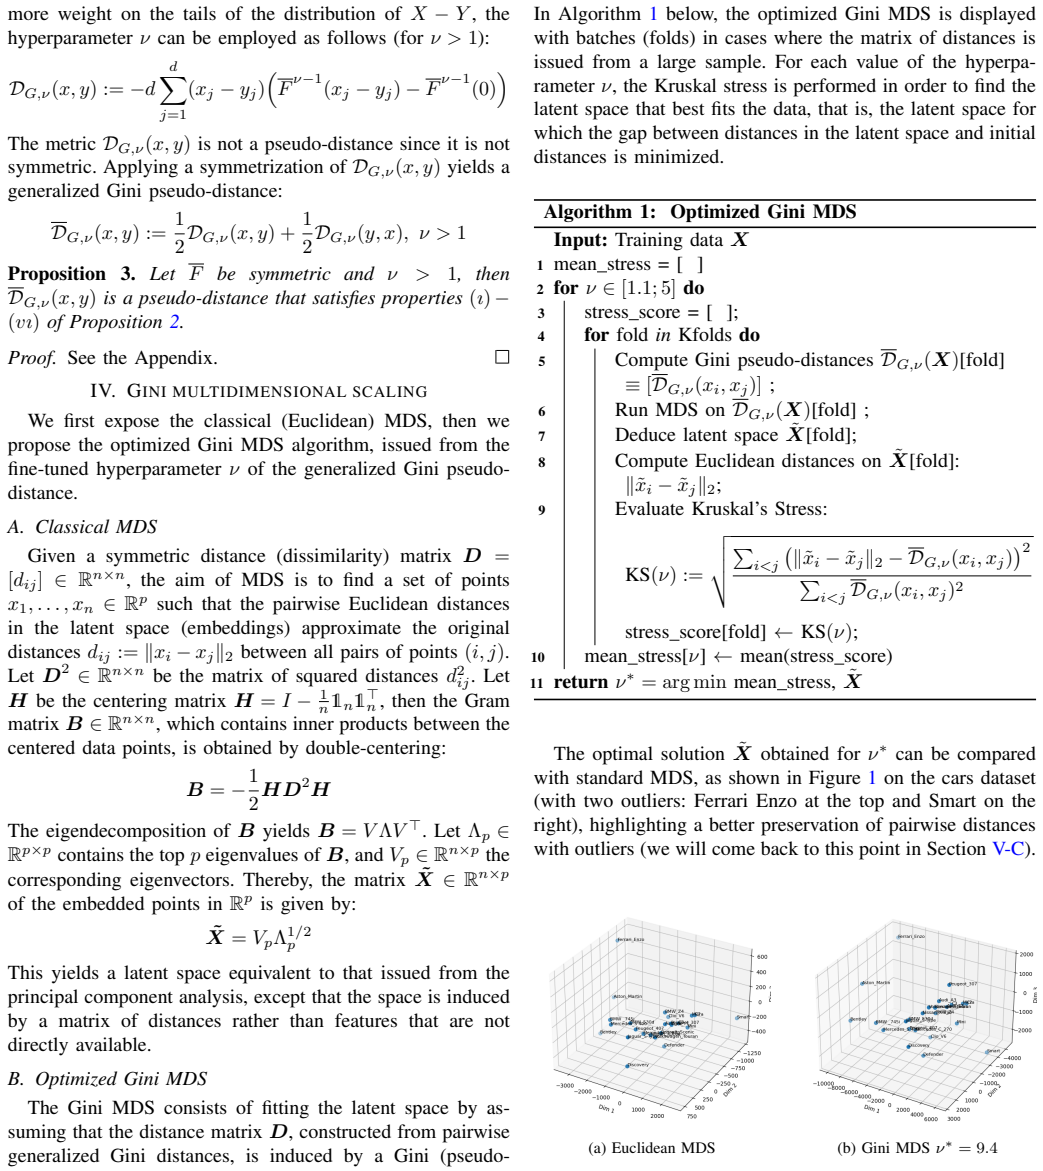
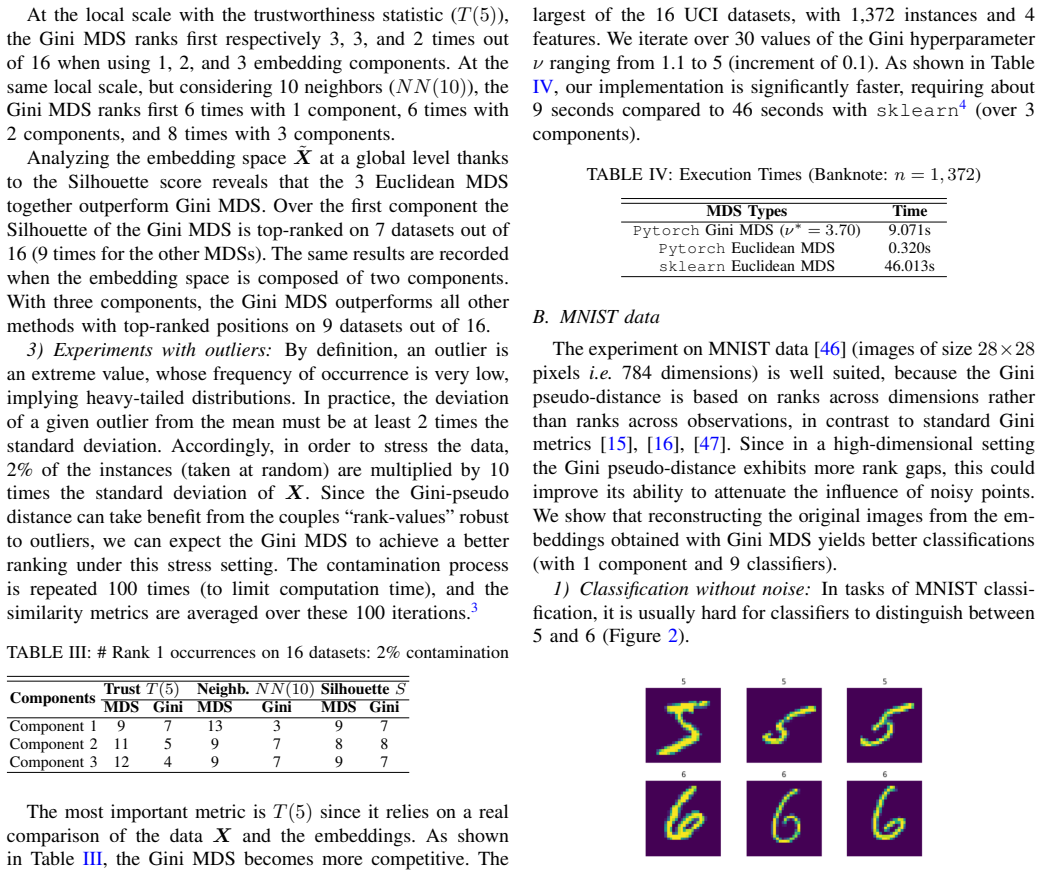
The Gini MDS framework extends Euclidean MDS by replacing the distance with a Gini pseudo-distance based on values and ranks that depends on a tunable hyperparameter. This allows better matching of observed dissimilarities in the presence of noise and outliers, as demonstrated by superior performance on 16 UCI datasets and MNIST images compared to standard MDS.
What carries the argument
The Gini pseudo-distance, which combines value information with rank information via a tunable hyperparameter to measure dissimilarity between points.
If this is right
- Embeddings preserve observed dissimilarities more accurately when data includes outliers or additive noise.
- The tensor-based PyTorch code yields faster computation than standard MDS implementations for large point sets.
- A single hyperparameter lets users explore different latent arrangements without changing the underlying model.
- The method applies directly to any dissimilarity matrix derived from real measurements that may contain errors.
Where Pith is reading between the lines
- The same pseudo-distance construction could be substituted into other embedding or clustering algorithms that currently rely on Euclidean distances.
- Performance gains might appear in downstream tasks such as visualization or nearest-neighbor search on noisy sensor data.
- Systematic sweeps of the hyperparameter on new image or tabular collections could map how different noise regimes favor different rank-value balances.
Load-bearing premise
The Gini pseudo-distance based on values and their ranks depends on a fine-tunable hyperparameter that allows flexible exploration of latent configurations enabling embeddings that best match observed dissimilarities.
What would settle it
Running Gini MDS and Euclidean MDS on additional datasets with controlled levels of noise or outliers and finding no consistent improvement in embedding quality or stress would falsify the robustness claim.
Figures
read the original abstract
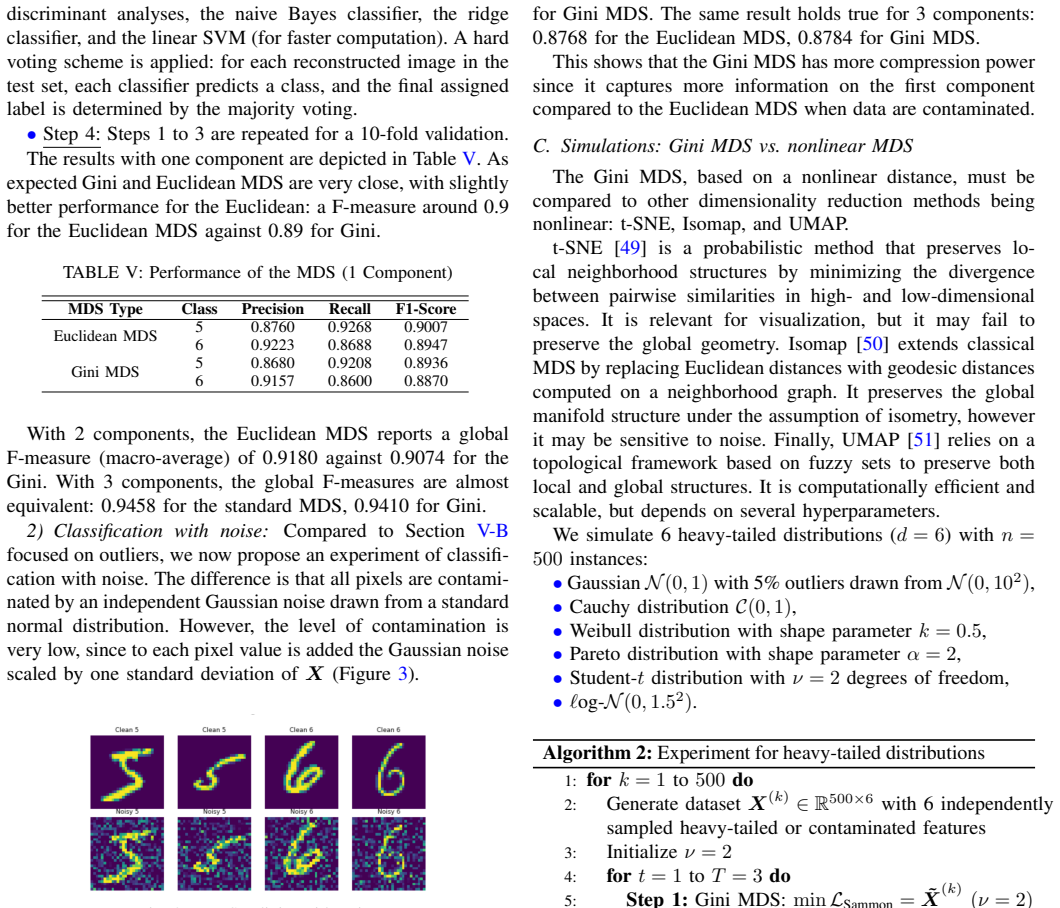
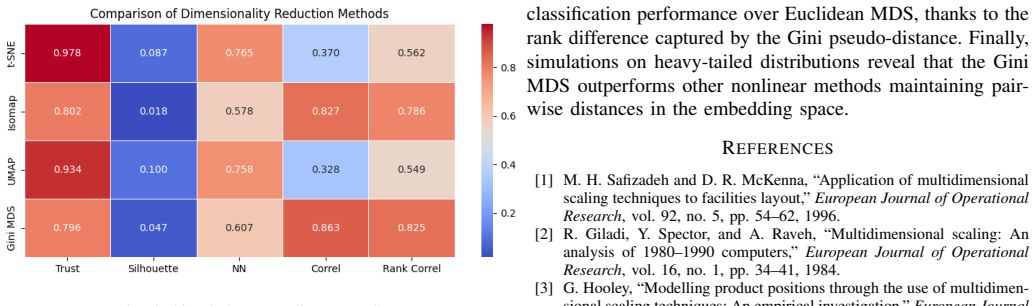
The Gini Multidimensional Scaling (Gini MDS) framework extends the Euclidean multidimensional scaling. We introduce a Gini pseudo-distance based on values and their ranks that depends on a fine-tunable hyperparameter. This pseudo-distance allows flexible exploration of latent configurations, enabling embeddings that best match observed dissimilarities. The Gini MDS is shown to be robust to noise and outliers, making it well-suited for real-world applications. We provide experiments on 16 UCI datasets with outliers and on MNIST images with noise to show that the Gini MDS outperforms the Euclidean MDS on noisy data. Finally, a tensor-based implementation in \texttt{PyTorch} provides GPU acceleration and efficient computation compared to the standard MDS of the \texttt{sklearn} library.
Editorial analysis
A structured set of objections, weighed in public.
Referee Report
Summary. The paper introduces Gini MDS as an extension of classical Euclidean MDS. It defines a Gini pseudo-distance that combines value and rank information via a tunable hyperparameter, allowing flexible matching of observed dissimilarities. The central empirical claim is that this construction yields embeddings that are more robust to noise and outliers than standard MDS, supported by experiments on 16 UCI datasets containing outliers and on MNIST images with added noise; a PyTorch implementation is also provided for computational efficiency.
Significance. If the reported gains can be shown to arise from the Gini construction itself rather than from the extra hyperparameter degree of freedom, the method could offer a practical alternative for MDS on noisy real-world data. The tensor-based GPU implementation is a concrete engineering contribution that would be useful if the robustness claim holds under controlled evaluation protocols.
major comments (3)
- [Abstract] Abstract: the claim that Gini MDS 'outperforms the Euclidean MDS on noisy data' is load-bearing for the paper's contribution, yet the abstract supplies no information on how the tunable hyperparameter of the Gini pseudo-distance is selected (grid search, cross-validation, fixed default, or otherwise), whether selection occurs inside or outside the reported test sets, or whether any statistical tests or error bars accompany the comparisons on the 16 UCI datasets and MNIST.
- [Experiments] Experiments (UCI and MNIST sections): because the Gini pseudo-distance is explicitly described as depending on a 'fine-tunable hyperparameter' that 'allows flexible exploration of latent configurations,' any performance advantage must be shown to be independent of that tuning step; the manuscript provides no protocol demonstrating that the Euclidean baseline receives equivalent tuning effort or that a fixed default Gini hyperparameter was also evaluated.
- [Gini pseudo-distance definition] § on Gini pseudo-distance definition: the central object is a hyperparameter-controlled pseudo-distance whose value is chosen to best match observed dissimilarities; without an explicit statement that hyperparameter selection is performed on held-out data or via a protocol that does not leak test information, the robustness claim risks circularity with the fitting step itself.
minor comments (2)
- [Abstract] The abstract states that a tensor-based PyTorch implementation provides 'efficient computation compared to the standard MDS of the sklearn library,' but no timing tables, complexity analysis, or hardware specifications are referenced in the provided text.
- [Method] Notation for the Gini pseudo-distance should be introduced with an explicit equation number so that later claims about its rank/value weighting can be traced directly to the definition.
Simulated Author's Rebuttal
We thank the referee for the constructive comments highlighting the need for greater transparency on hyperparameter selection and evaluation protocols. We will revise the manuscript to provide explicit details on these procedures while preserving the core contribution of the Gini pseudo-distance.
read point-by-point responses
-
Referee: [Abstract] Abstract: the claim that Gini MDS 'outperforms the Euclidean MDS on noisy data' is load-bearing for the paper's contribution, yet the abstract supplies no information on how the tunable hyperparameter of the Gini pseudo-distance is selected (grid search, cross-validation, fixed default, or otherwise), whether selection occurs inside or outside the reported test sets, or whether any statistical tests or error bars accompany the comparisons on the 16 UCI datasets and MNIST.
Authors: We agree the abstract should be more informative. The revised abstract will state that the hyperparameter is selected via grid search with cross-validation on held-out validation splits (separate from test data), that comparisons include standard deviation error bars over 10 runs, and that statistical significance is assessed via paired t-tests. revision: yes
-
Referee: [Experiments] Experiments (UCI and MNIST sections): because the Gini pseudo-distance is explicitly described as depending on a 'fine-tunable hyperparameter' that 'allows flexible exploration of latent configurations,' any performance advantage must be shown to be independent of that tuning step; the manuscript provides no protocol demonstrating that the Euclidean baseline receives equivalent tuning effort or that a fixed default Gini hyperparameter was also evaluated.
Authors: Euclidean MDS has no tunable hyperparameter analogous to the Gini one. We will add a new subsection reporting results for Gini MDS using a fixed default hyperparameter (the value 0.5) across all datasets to isolate the effect of the construction itself from extensive tuning. The original tuned results will remain for comparison. revision: partial
-
Referee: [Gini pseudo-distance definition] § on Gini pseudo-distance definition: the central object is a hyperparameter-controlled pseudo-distance whose value is chosen to best match observed dissimilarities; without an explicit statement that hyperparameter selection is performed on held-out data or via a protocol that does not leak test information, the robustness claim risks circularity with the fitting step itself.
Authors: We will expand the Gini pseudo-distance definition section to explicitly describe the cross-validation protocol: the hyperparameter is optimized on training/validation folds only, with test data held completely out of the selection process. This clarification will remove any ambiguity regarding information leakage. revision: yes
Circularity Check
Robustness to noise/outliers may be driven by hyperparameter tuning rather than the Gini construction
specific steps
-
fitted input called prediction
[Abstract]
"We introduce a Gini pseudo-distance based on values and their ranks that depends on a fine-tunable hyperparameter. This pseudo-distance allows flexible exploration of latent configurations, enabling embeddings that best match observed dissimilarities."
The hyperparameter is tuned specifically to produce embeddings that best match the observed dissimilarities. The subsequent claim that Gini MDS outperforms Euclidean MDS on noisy data therefore reduces to the effect of this fitted parameter on the same data used for evaluation, rather than an independent property of the Gini metric.
full rationale
The paper's central empirical claim rests on experiments showing Gini MDS outperforming Euclidean MDS on noisy UCI and MNIST data. However, the Gini pseudo-distance is explicitly introduced with a tunable hyperparameter whose purpose is to enable embeddings that best match the observed dissimilarities. When this parameter is selected (via grid search or optimization) to minimize embedding stress or error on the same noisy dissimilarities used for evaluation, the reported gains are consistent with the extra degree of freedom rather than any intrinsic robustness of the rank/value construction. This matches the fitted-input-called-prediction pattern: the hyperparameter is fitted to the evaluation data and then the resulting match is presented as evidence of superiority. No self-citation chain or self-definitional reduction appears in the provided text; the circularity is localized to the experimental validation step.
Axiom & Free-Parameter Ledger
free parameters (1)
- hyperparameter controlling Gini pseudo-distance
invented entities (1)
-
Gini pseudo-distance
no independent evidence
Reference graph
Works this paper leans on
-
[1]
Application of multidimensional scaling techniques to facilities layout,
M. H. Safizadeh and D. R. McKenna, “Application of multidimensional scaling techniques to facilities layout,”European Journal of Operational Research, vol. 92, no. 5, pp. 54–62, 1996
1996
-
[2]
Multidimensional scaling: An analysis of 1980–1990 computers,
R. Giladi, Y . Spector, and A. Raveh, “Multidimensional scaling: An analysis of 1980–1990 computers,”European Journal of Operational Research, vol. 16, no. 1, pp. 34–41, 1984
1980
-
[3]
Modelling product positions through the use of multidimen- sional scaling techniques: An empirical investigation,
G. Hooley, “Modelling product positions through the use of multidimen- sional scaling techniques: An empirical investigation,”European Journal of Operational Research, vol. 111, no. 2, pp. 216–227, 1998
1998
-
[4]
Error structure and identification condition in maximum likelihood nonmetric multidimensional scaling,
M. Abe, “Error structure and identification condition in maximum likelihood nonmetric multidimensional scaling,”European Journal of Operational Research, vol. 111, no. 2, pp. 216–227, 1998
1998
-
[5]
Multi-dimensional scaling from k-nearest neighbour- hood distances,
W. Du and J. Li, “Multi-dimensional scaling from k-nearest neighbour- hood distances,”Journal of Scientific Computing, vol. 101, no. 3, p. 82, 2024
2024
-
[6]
Multiinv: Inverting multidimensional scaling projections and computing decision maps by multilateration,
D. Blumberg, Y . Wang, A. Telea, D. A. Keim, and F. L. Dennig, “Multiinv: Inverting multidimensional scaling projections and computing decision maps by multilateration,”Computers & Graphics, vol. 129, p. 104234, 2025. [Online]. Available: https: //www.sciencedirect.com/science/article/pii/S0097849325000755
2025
-
[7]
Enhancing multidi- mensional scaling through a distributed algorithm,
Z. Gachkooban, R. Alizadeh, and F. Shakeri, “Enhancing multidi- mensional scaling through a distributed algorithm,”The Journal of Supercomputing, vol. 80, no. 26, pp. 22 049–22 068, 2024
2024
-
[8]
Multidimensional scaling for big data,
P. Delicado and C. Pach ´on-Garc´ıa, “Multidimensional scaling for big data,”Advances in Data Analysis and Classification, vol. 18, no. 3, pp. 651–678, 2024
2024
-
[9]
Metric multidimensional scaling for large single-cell datasets using neural networks,
S. Canzar, V . H. Do, S. Jeli ´c, S. Laue, D. Matijevi ´c, and T. Prusina, “Metric multidimensional scaling for large single-cell datasets using neural networks,”Algorithms for Molecular Biology, vol. 19, no. 21, 2024
2024
-
[10]
A globally convergent inertial first-order opti- mization method for multidimensional scaling,
N. Ram and S. Sabach, “A globally convergent inertial first-order opti- mization method for multidimensional scaling,”Journal of Optimization Theory and Applications, vol. 202, pp. 949–974, 2024
2024
-
[11]
Continuous multidimensional scaling,
M. W. Trosset and C. E. Priebe, “Continuous multidimensional scaling,”
-
[12]
Available: https://arxiv.org/abs/2402.04436
[Online]. Available: https://arxiv.org/abs/2402.04436
-
[13]
Geometric multidimensional scaling: Efficient approach for data dimensionality reduction,
G. Dzemyda and M. Sabaliauskas, “Geometric multidimensional scaling: Efficient approach for data dimensionality reduction,”Journal of Global Optimization, vol. 88, pp. 53–77, 2024
2024
-
[14]
Gini regression analysis,
I. Olkin and S. Yitzhaki, “Gini regression analysis,”International Statistical Review, vol. 60, pp. 185–196, 1991
1991
-
[15]
Yitzhaki and E
S. Yitzhaki and E. Schechtman,The Gini methodology: a primer on a statistical methodology. Springer, 2013, vol. 272
2013
-
[16]
Grouped feature screening for ultrahigh- dimensional classification via gini distance correlation,
Y . Sang and X. Dang, “Grouped feature screening for ultrahigh- dimensional classification via gini distance correlation,”Journal of Multivariate Analysis, vol. 204, p. 105360, 2024. [Online]. Available: https://www.sciencedirect.com/science/article/pii/S0047259X24000678
2024
-
[17]
Knn and k-means in gini prametric spaces,
C. Mussard, A. Charpentier, and S. Mussard, “Knn and k-means in gini prametric spaces,” inProceedings of the 27th European Conference on Artificial Intelligence (ECAI 2025), 2025. [Online]. Available: https://arxiv.org/abs/2501.18028
-
[18]
Outlier detection for robust multi- dimensional scaling,
L. Blouvshtein and D. Cohen-Or, “Outlier detection for robust multi- dimensional scaling,”IEEE Transactions on Pattern Analysis and Ma- chine Intelligence, vol. 41, no. 9, pp. 2273–2279, 2019
2019
-
[19]
Sparsity-exploiting robust multidi- mensional scaling,
P. A. Forero and G. B. Giannakis, “Sparsity-exploiting robust multidi- mensional scaling,”IEEE Transactions on Signal Processing, vol. 60, no. 8, pp. 4118–4134, 2012
2012
-
[20]
Orthogonal outlier detection and dimension estimation for improved multidimensional scaling embedding,
W. Li, J. Mironeet al., “Orthogonal outlier detection and dimension estimation for improved multidimensional scaling embedding,”Frontiers in Bioinformatics, vol. 3, p. 1211819, 2023
2023
-
[21]
Robust multidimensional scaling via accelerated alternating projections,
T. Deng and T. Wang, “Robust multidimensional scaling via accelerated alternating projections,” arXiv preprint, 2025, arXiv:2501.02208. [Online]. Available: https://arxiv.org/abs/2501.02208
-
[22]
The proof and measurement of association between two things,
C. Spearman, “The proof and measurement of association between two things,”The American Journal of Psychology, vol. 15, no. 1, pp. 72–101, 1904
1904
-
[23]
J. Durbin, “Errors in variables,”Review of the International Statistical Institute, vol. 22, no. 1/3, pp. 23–32, 1954. [Online]. Available: http://www.jstor.org/stable/1401917
-
[24]
A measure of association based on gini’s mean difference,
E. Schechtman and S. Yitzhaki, “A measure of association based on gini’s mean difference,”Communications in Statistics Theory and Methods, vol. Series A, pp. 207–231, 1987
1987
-
[25]
A family of correlation coefficients based on the extended gini index,
——, “A family of correlation coefficients based on the extended gini index,”The Journal of Economic Inequality, vol. 1, pp. 129–146, 2003
2003
-
[26]
Nonmetric multidimensional scaling: A numerical method,
J. B. Kruskal, “Nonmetric multidimensional scaling: A numerical method,”Psychometrika, vol. 29, no. 2, pp. 115–129, 1964
1964
-
[27]
Multidimensional scaling using majorization: The R package smacof,
J. de Leeuw and P. Mair, “Multidimensional scaling using majorization: The R package smacof,”Journal of Statistical Software, vol. 31, no. 3, pp. 1–30, 2009. [Online]. Available: https://www.jstatsoft.org/v31/i03/
2009
-
[28]
Robust estimation of a location parameter,
P. J. Huber, “Robust estimation of a location parameter,”Annals of Mathematical Statistics, vol. 35, no. 1, pp. 73–101, 1964
1964
-
[29]
A nonlinear mapping for data structure analysis,
J. W. Sammon, “A nonlinear mapping for data structure analysis,”IEEE Transactions on Computers, vol. C-18, no. 5, pp. 401–409, 1969
1969
-
[30]
Convergence of correction matrix algorithms for multidimensional scaling,
J. de Leeuw and W. J. Heiser, “Convergence of correction matrix algorithms for multidimensional scaling,”Geometric Representations of Relational Data, pp. 735–752, 1977
1977
-
[31]
Statlog (australian credit approval) [dataset],
R. Quinlan, “Statlog (australian credit approval) [dataset],” https://doi. org/10.24432/C59012, 1987, uCI Machine Learning Repository
-
[32]
UCI Machine Learning Repository
V . Lohweg, “Banknote Authentication,” UCI Machine Learning Repos- itory, 2012, DOI: https://doi.org/10.24432/C55P57
-
[33]
Mangasarian Olvi, W., S.: Breast Cancer Wisconsin (Diagnostic)
W. Wolberg, O. Mangasarian, N. Street, and W. Street, “Breast can- cer wisconsin (diagnostic) [dataset],” https://doi.org/10.24432/C5DW2B, 1993, uCI Machine Learning Repository
-
[34]
V . Sigillito, S. Wing, L. Hutton, and K. Baker, “Ionosphere [dataset],” https://doi.org/10.24432/C5W01B, 1989, uCI Machine Learning Repos- itory
-
[35]
R. Fisher, “Iris [dataset],” https://doi.org/10.24432/C56C76, 1936, uCI Machine Learning Repository
-
[36]
Statlog (german credit data) [dataset],
H. Hofmann, “Statlog (german credit data) [dataset],” https://doi.org/10. 24432/C5NC77, 1994, uCI Machine Learning Repository
1994
-
[37]
Glass identification [dataset],
B. German, “Glass identification [dataset],” https://doi.org/10.24432/ C5WW2P, 1987, uCI Machine Learning Repository
1987
-
[38]
A. Janosi, W. Steinbrunn, M. Pfisterer, and R. Detrano, “Heart disease [dataset],” https://doi.org/10.24432/C52P4X, 1989, uCI Machine Learn- ing Repository
-
[39]
Qsar biodegradation [dataset],
K. Mansouri, T. Ringsted, D. Ballabio, R. Todeschini, and V . Consonni, “Qsar biodegradation [dataset],” https://doi.org/10.24432/C5H60M, 2013, uCI Machine Learning Repository
-
[40]
Singh, G., Gehr, T., P ¨uschel, M., and Vechev, M
T. Sejnowski and R. Gorman, “Connectionist bench (sonar, mines vs. rocks) [dataset],” https://doi.org/10.24432/C5T01Q, 1988, uCI Machine Learning Repository
-
[41]
Statlog (vehicle silhouettes) [dataset],
P. Mowforth and B. Shepherd, “Statlog (vehicle silhouettes) [dataset],” https://doi.org/10.24432/C5HG6N, uCI Machine Learning Repository
-
[42]
Wine [dataset],
S. Aeberhard and M. Forina, “Wine [dataset],” https://doi.org/10.24432/ C5PC7J, 1992, uCI Machine Learning Repository
1992
-
[43]
R. Siegler, “Balance scale [dataset],” https://doi.org/10.24432/C5488X, 1976, uCI Machine Learning Repository
-
[44]
Haberman’s survival [dataset],
S. Haberman, “Haberman’s survival [dataset],” https://doi.org/10.24432/ C5XK51, 1976, uCI Machine Learning Repository
1976
-
[45]
Wholesale customers [dataset],
M. Cardoso, “Wholesale customers [dataset],” https://doi.org/10.24432/ C5030X, 2013, uCI Machine Learning Repository
2013
-
[46]
Ilpd (indian liver patient dataset) [dataset],
B. Ramana and N. Venkateswarlu, “Ilpd (indian liver patient dataset) [dataset],” https://doi.org/10.24432/C5D02C, 2022, uCI Machine Learn- ing Repository
-
[47]
Gradient-based learning applied to document recognition,
Y . LeCun, L. Bottou, Y . Bengio, and P. Haffner, “Gradient-based learning applied to document recognition,”Proceedings of the IEEE, vol. 86, no. 11, pp. 2278–2324, 1998. [Online]. Available: http://yann.lecun.com/exdb/mnist/
1998
-
[48]
The relationship between the absolute deviation from a quantile and gini’s mean difference,
S. Yitzhaki and P. Lambert, “The relationship between the absolute deviation from a quantile and gini’s mean difference,”METRON, vol. 71, pp. 97–104, 2013
2013
-
[49]
Using the nystr ¨om method to speed up kernel machines,
C. K. I. Williams and M. Seeger, “Using the nystr ¨om method to speed up kernel machines,” inAdvances in Neural Information Processing Systems (NIPS), 2001, pp. 682–688
2001
-
[50]
Visualizing data using t-sne,
L. van der Maaten and G. Hinton, “Visualizing data using t-sne,”Journal of Machine Learning Research, vol. 9, no. Nov, pp. 2579–2605, 2008
2008
-
[51]
A global geometric framework for nonlinear dimensionality reduction,
J. B. Tenenbaum, V . de Silva, and J. C. Langford, “A global geometric framework for nonlinear dimensionality reduction,”Science, vol. 290, no. 5500, pp. 2319–2323, 2000
2000
-
[52]
L. McInnes, J. Healy, N. Saul, and L. Großberger, “Umap: Uniform manifold approximation and projection,”Journal of Open Source Software, vol. 3, no. 29, p. 861, 2018. [Online]. Available: https://doi.org/10.21105/joss.00861
-
[53]
G. H. Hardy, J. E. Littlewood, and G. P ´olya,Inequalities, 2nd ed. Cambridge: Cambridge University Press, 1952. VII. APPENDIXA: PROOF Proof of Proposition 1: (ı)It comes: ∥λx∥G =D G(λx,0 d) = dX j=1 λxj R(λxj)− d+ 1 2 SinceR(·)is an homogeneous function of degree zero ifλ≥ 0,i.e.R(λx) =R(x), then: ∥λx∥G = dX j=1 λxj R(xj)− d+ 1 2 =λ dX j=1 xj R(xj)− ...
1952
discussion (0)
Sign in with ORCID, Apple, or X to comment. Anyone can read and Pith papers without signing in.