A Statistical Physics View of the S&P 500: Pairwise Interactions and Time-Varying Dynamics
Pith reviewed 2026-06-29 23:13 UTC · model grok-4.3
The pith
Static and kinetic Ising models applied to S&P 500 binary movements reveal sector-organized networks and slow regime shifts around major perturbations.
A machine-rendered reading of the paper's core claim, the machinery that carries it, and where it could break.
Core claim
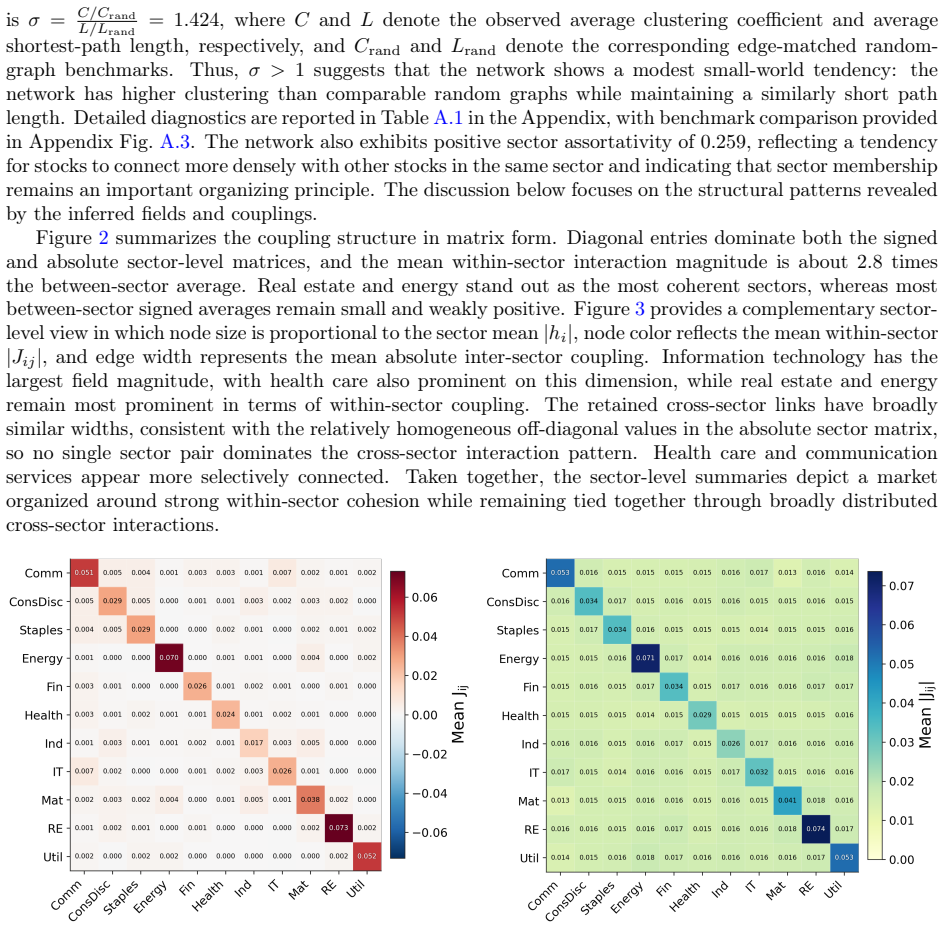
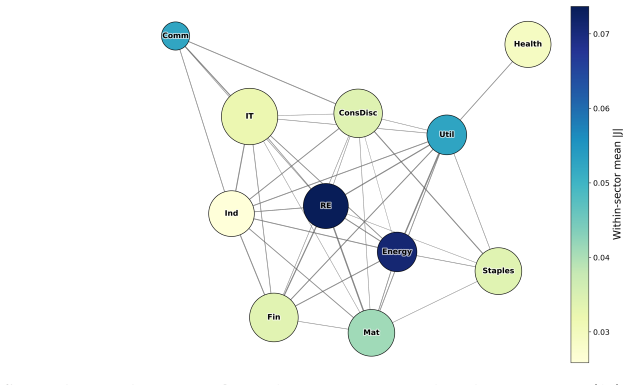
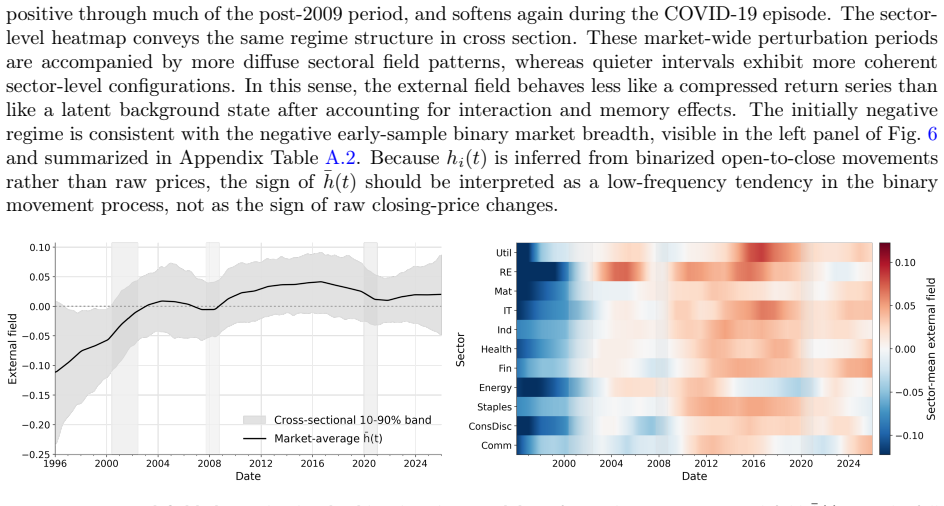
The authors establish that daily binary movements of S&P 500 stocks can be represented with complementary static and kinetic Ising models. The static pairwise model provides a long-run maximum-entropy summary of low-order dependence and reveals a sectorally organized interaction network with modest small-world structure and within-sector couplings about 2.8 times stronger than between-sector couplings, with especially coherent real estate and energy sectors. The kinetic model incorporates smooth time-varying external fields, self-memory, and directed lagged couplings to describe next-day dynamics and reveals slow field-regime shifts around three major market-wide perturbations—the dot-com bu
What carries the argument
Ising model with pairwise couplings (static case) and time-varying fields plus directed lags (kinetic case) applied to binary stock-movement states.
If this is right
- The static model captures persistent market organization through a sectorally organized network with modest small-world structure.
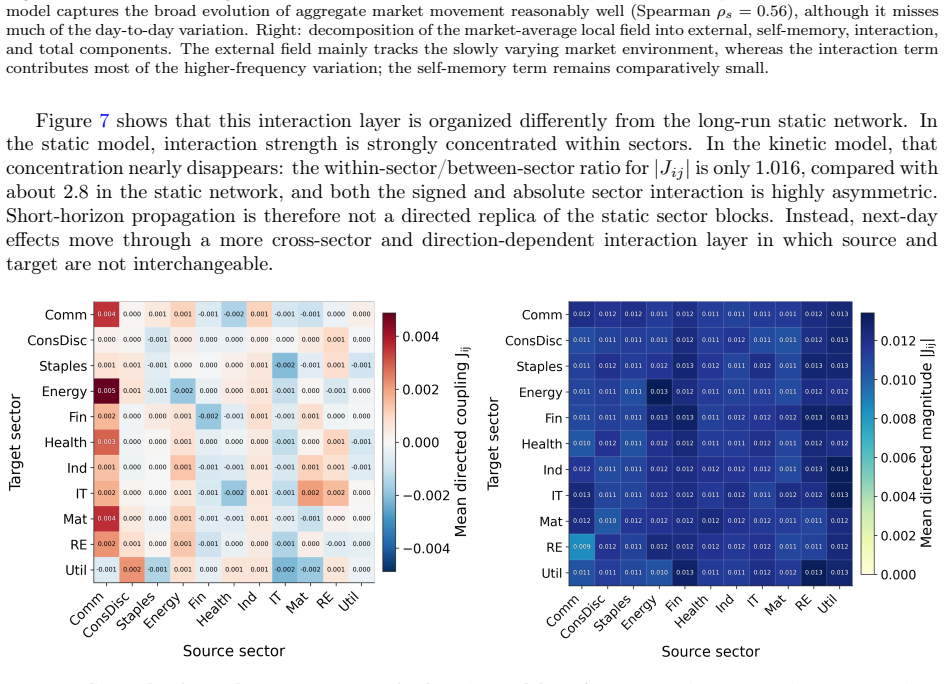
- Within-sector couplings are about 2.8 times stronger than between-sector couplings.
- Real estate and energy sectors show especially coherent internal interactions.
- The kinetic model identifies slow field-regime shifts around the dot-com bust, global financial crisis, and COVID-19.
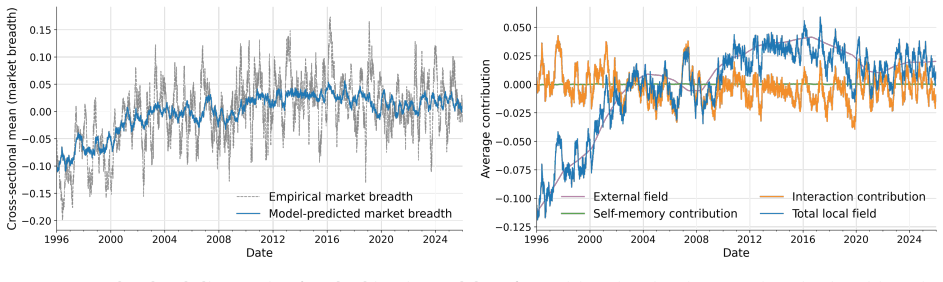
- Self-memory is generally weak while directed couplings remain asymmetric and less sector-concentrated yet reproduce aggregate movement.
Where Pith is reading between the lines
- If the extracted time-varying fields track market stress, they could be monitored for early signals of aggregate shifts before standard indices register them.
- Stronger within-sector couplings imply that shocks originating inside one sector may remain more contained or amplified internally than cross-sector shocks.
- The kinetic model could be tested for out-of-sample predictive accuracy on data after 2026 to check whether the directed-lag structure adds forecasting value.
- The same static-plus-kinetic approach could be applied to other equity indices or asset classes to compare how interaction structure and regime persistence differ across markets.
Load-bearing premise
Daily binary open-to-close movements of S&P 500 stocks can be faithfully represented as Ising model states whose parameters capture both static dependence and next-day dynamics.
What would settle it
A direct check showing that the maximum-entropy pairwise model does not reproduce the empirical pairwise correlations among the binary movements, or that the kinetic model fails to place regime shifts around the dot-com bust, global financial crisis, and COVID-19 periods, would falsify the claims.
Figures
read the original abstract
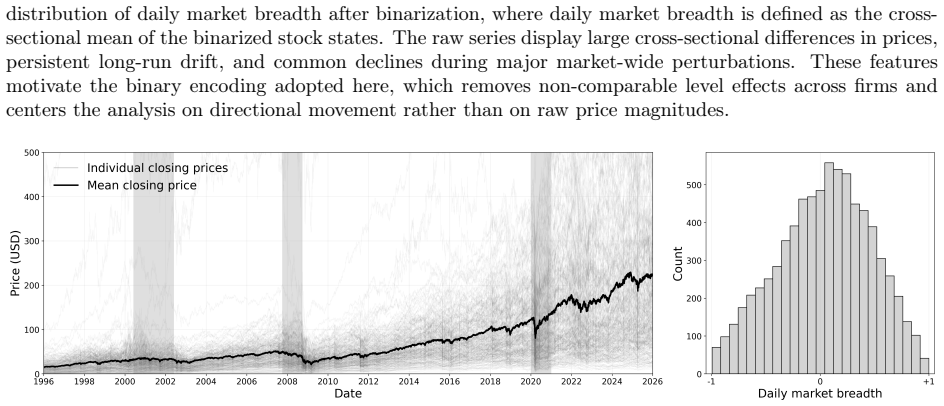
We analyze a fixed panel of S\&P 500 stocks from 1996 to 2026 using complementary static and kinetic Ising models applied to daily binary open-to-close movements. The static pairwise model provides a long-run maximum-entropy summary of low-order dependence and reveals a sectorally organized interaction network with modest small-world structure and within-sector couplings about 2.8 times stronger than between-sector couplings, with especially coherent real estate and energy sectors. The kinetic model incorporates smooth time-varying external fields, self-memory, and directed lagged couplings to describe next-day dynamics. It reveals slow field-regime shifts around three major market-wide perturbations -- the dot-com bust, the global financial crisis, and the COVID-19 episode. Self-memory is generally weak, and the directed coupling structure is much less sector-concentrated and more asymmetric than the static network, while still reproducing the broad evolution of aggregate market movement. Taken together, the two complementary models characterize both persistent market organization and short-horizon cross-stock dynamics, providing a compact statistical physics view of interaction structure and time-varying behavior in the S\&P 500.
Editorial analysis
A structured set of objections, weighed in public.
Referee Report
Summary. The paper fits static and kinetic Ising models to daily binary open-to-close movements of a fixed panel of S&P 500 stocks (1996–2026). The static pairwise maximum-entropy model is used to extract a long-run interaction network that is reported to be sectorally organized, modestly small-world, and to exhibit within-sector couplings ~2.8 times stronger than between-sector couplings (especially coherent in real estate and energy). The kinetic extension adds smooth time-varying fields, self-memory, and directed lagged couplings; it is reported to recover slow field-regime shifts around the dot-com bust, GFC, and COVID-19, while reproducing aggregate market evolution.
Significance. If the pairwise Ising representation is adequate, the work supplies a compact, interpretable statistical-physics description of both persistent cross-stock dependence and short-horizon dynamics in a major equity index. The separation into static network structure and time-varying kinetic parameters, together with the reported sector asymmetries and event-driven field shifts, could be useful for stylized-fact generation and for testing whether low-order maximum-entropy models suffice for financial co-movement data.
major comments (3)
- [Abstract and model-application paragraphs] The central quantitative claims (sectoral organization, 2.8-fold within/between coupling ratio, regime shifts around three named events) rest on the assumption that the binarized daily returns are well-described by an Ising model whose parameters capture the relevant dependence. No diagnostics are supplied for residual higher-order correlations (e.g., three-stock or larger co-movements beyond those induced by the fitted J_ij), likelihood-ratio tests against models with explicit three-body terms, or goodness-of-fit measures on held-out data. This omission directly affects the load-bearing claim that the extracted network and kinetic parameters faithfully summarize the interaction structure.
- [Abstract] The abstract states that standard Ising models were fitted and produced the quoted numerical results, yet provides no information on the fitting procedure (maximum-likelihood, pseudolikelihood, mean-field, etc.), regularization, convergence criteria, robustness to data-exclusion rules, or uncertainty quantification (error bars or bootstrap intervals) for the reported coupling ratios, small-world metrics, or field-regime timings. Without these, it is impossible to assess whether the 2.8-fold ratio or the identified regime shifts are statistically distinguishable from noise or from alternative specifications.
- [Kinetic-model description] The kinetic model claims to reproduce the broad evolution of aggregate market movement via time-varying fields, self-memory, and directed lags. No quantitative out-of-sample prediction metrics (e.g., next-day accuracy, log-likelihood on test periods, or comparison against simpler autoregressive baselines) are reported, nor are residual correlation checks after conditioning on the fitted fields. This leaves open whether the added kinetic parameters are necessary or merely overfit the three named market episodes.
minor comments (2)
- [Abstract] The time span “1996 to 2026” in the abstract extends into the future; clarify whether the panel ends in 2024 or whether 2026 denotes a projection or typographical error.
- [Model definition] Notation for the time-varying fields h(t), self-memory coefficients, and directed lag matrix should be introduced with explicit equations rather than descriptive prose to allow direct comparison with standard kinetic Ising formulations.
Simulated Author's Rebuttal
We thank the referee for the constructive and detailed comments, which highlight important aspects of model validation and reporting. We address each major comment below and will revise the manuscript to incorporate additional diagnostics, methodological details, and quantitative metrics.
read point-by-point responses
-
Referee: [Abstract and model-application paragraphs] The central quantitative claims (sectoral organization, 2.8-fold within/between coupling ratio, regime shifts around three named events) rest on the assumption that the binarized daily returns are well-described by an Ising model whose parameters capture the relevant dependence. No diagnostics are supplied for residual higher-order correlations (e.g., three-stock or larger co-movements beyond those induced by the fitted J_ij), likelihood-ratio tests against models with explicit three-body terms, or goodness-of-fit measures on held-out data. This omission directly affects the load-bearing claim that the extracted network and kinetic parameters faithfully summarize the interaction structure.
Authors: We agree that explicit validation for higher-order effects would strengthen the claims. In the revised manuscript we will add a dedicated validation subsection that computes three-point correlation residuals on held-out periods and compares them to the pairwise model's predictions. Likelihood comparisons to three-body models will be reported where computationally tractable (noting the prohibitive cost for ~500 variables); otherwise we will use held-out log-likelihood as a goodness-of-fit proxy. These additions directly address the concern about whether the reported network faithfully summarizes dependence. revision: yes
-
Referee: [Abstract] The abstract states that standard Ising models were fitted and produced the quoted numerical results, yet provides no information on the fitting procedure (maximum-likelihood, pseudolikelihood, mean-field, etc.), regularization, convergence criteria, robustness to data-exclusion rules, or uncertainty quantification (error bars or bootstrap intervals) for the reported coupling ratios, small-world metrics, or field-regime timings. Without these, it is impossible to assess whether the 2.8-fold ratio or the identified regime shifts are statistically distinguishable from noise or from alternative specifications.
Authors: We will expand the Methods section to specify that both models are fitted via pseudolikelihood maximization with L2 regularization, including convergence tolerances and robustness checks across data-exclusion windows. Bootstrap-derived standard errors (or credible intervals) will be added for the within/between coupling ratio, small-world coefficients, and the timing of field-regime shifts, allowing readers to evaluate statistical distinguishability from noise. revision: yes
-
Referee: [Kinetic-model description] The kinetic model claims to reproduce the broad evolution of aggregate market movement via time-varying fields, self-memory, and directed lags. No quantitative out-of-sample prediction metrics (e.g., next-day accuracy, log-likelihood on test periods, or comparison against simpler autoregressive baselines) are reported, nor are residual correlation checks after conditioning on the fitted fields. This leaves open whether the added kinetic parameters are necessary or merely overfit the three named market episodes.
Authors: We will add quantitative out-of-sample evaluation for the kinetic model, reporting next-day binary prediction accuracy and test-period log-likelihood on a post-2015 hold-out window, together with direct comparisons against simpler AR(1) and constant-field baselines on the aggregate market series. Residual pairwise correlation checks after conditioning on the fitted time-varying fields will also be included to demonstrate that the kinetic terms capture the reported dynamics beyond the three named episodes. revision: yes
Circularity Check
No circularity; parameters and statistics are direct empirical outputs
full rationale
The paper fits standard maximum-entropy Ising parameters (pairwise couplings, time-varying fields, self-memory, directed lags) to binarized daily S&P 500 returns and reports derived network statistics (sector coupling ratios, small-world metrics, regime shifts). These quantities are computed from the data via the model equations; no step defines a target quantity in terms of itself, renames a fitted input as a prediction, or relies on a self-citation chain for a uniqueness theorem or ansatz. The derivation chain is self-contained against the external stock-movement data.
Axiom & Free-Parameter Ledger
free parameters (3)
- pairwise coupling matrix J_ij
- time-varying external fields h(t)
- self-memory and directed lag coefficients
axioms (2)
- domain assumption Binary open-to-close movements are adequately represented as Ising spins whose joint distribution is captured by low-order interactions.
- domain assumption The kinetic model with smooth time-varying fields and directed lags is sufficient to describe next-day conditional probabilities.
Reference graph
Works this paper leans on
-
[1]
Aunifyingframeworkformean-fieldtheories of asymmetric kinetic Ising systems.Nature Communications, 12(1):1197, February 2021
MiguelAguilera, S.AminMoosavi, andHideakiShimazaki. Aunifyingframeworkformean-fieldtheories of asymmetric kinetic Ising systems.Nature Communications, 12(1):1197, February 2021. ISSN 2041-
2021
-
[2]
URLhttps://www.nature.com/articles/s41467-021-208 90-5
doi: 10.1038/s41467-021-20890-5. URLhttps://www.nature.com/articles/s41467-021-208 90-5. 11
-
[3]
yfinance: Download market data from yahoo! finance api
Ran Aroussi. yfinance: Download market data from yahoo! finance api. GitHub repository:https: //github.com/ranaroussi/yfinance, 2026. Version 1.2.0
2026
-
[4]
Inverse Ising inference using all the data
Erik Aurell and Magnus Ekeberg. Inverse ising inference using all the data.Physical Review Letters, 108(9), March 2012. ISSN 00319007. doi: 10.1103/PhysRevLett.108.090201. arXiv: 1107.3536
work page internal anchor Pith review Pith/arXiv arXiv doi:10.1103/physrevlett.108.090201 2012
-
[5]
The physics of financial networks
Marco Bardoscia, Paolo Barucca, Stefano Battiston, Fabio Caccioli, Giulio Cimini, Diego Garlaschelli, Fabio Saracco, Tiziano Squartini, and Guido Caldarelli. The physics of financial networks.Nature Reviews Physics, 3(7):490–507, July 2021. ISSN 25225820. doi: 10.1038/s42254-021-00322-5. arXiv: 2103.05623
-
[6]
Market structure explained by pairwise interactions
Thomas Bury. Market structure explained by pairwise interactions.Physica A: Statistical Mechanics and its Applications, 392(6):1375–1385, March 2013. ISSN 03784371. doi: 10.1016/j.physa.2012.10.046. arXiv: 1210.8380
work page internal anchor Pith review Pith/arXiv arXiv doi:10.1016/j.physa.2012.10.046 2013
-
[7]
Statistical pairwise interaction model of stock market
Thomas Bury. Statistical pairwise interaction model of stock market.European Physical Journal B, 86 (3), March 2013. ISSN 14346028. doi: 10.1140/epjb/e2013-30598-1. arXiv: 1206.4420
work page internal anchor Pith review Pith/arXiv arXiv doi:10.1140/epjb/e2013-30598-1 2013
-
[8]
Carlo Campajola, Domenico Di Gangi, Fabrizio Lillo, and Daniele Tantari. Modelling time-varying interactions in complex systems: the Score Driven Kinetic Ising Model.Scientific Reports, 12(1):19339, November 2022. ISSN 2045-2322. doi: 10.1038/s41598-022-23770-0. URLhttps://www.nature.com /articles/s41598-022-23770-0
-
[9]
Dragos Gorduza, Stefan Zohren, and Xiaowen Dong. Understanding stock market instability via graph auto-encoders.EPJ Data Science, 14(1):13, February 2025. ISSN 2193-1127. doi: 10.1140/epjds/s136 88-025-00523-3. URLhttps://epjdatascience.springeropen.com/articles/10.1140/epjds/s13 688-025-00523-3
-
[10]
E. T. Jaynes. Information Theory and Statistical Mechanics.Physical Review, 106(4):620–630, May
-
[11]
Information theory and statistical mechanics
ISSN 0031-899X. doi: 10.1103/PhysRev.106.620. URLhttps://link.aps.org/doi/10.1103/P hysRev.106.620
-
[12]
Kenett, Michele Tumminello, Asaf Madi, Gitit Gur-Gershgoren, Rosario N
Dror Y. Kenett, Michele Tumminello, Asaf Madi, Gitit Gur-Gershgoren, Rosario N. Mantegna, and Eshel Ben-Jacob. Dominating Clasp of the Financial Sector Revealed by Partial Correlation Analysis of the Stock Market.PLoS ONE, 5(12):e15032, December 2010. ISSN 1932-6203. doi: 10.1371/journa l.pone.0015032. URLhttps://dx.plos.org/10.1371/journal.pone.0015032
-
[13]
Yup Kim, Hong Joo Kim, and Soon Hyung Yook. Agent-based spin model for financial markets on complex networks: Emergence of two-phase phenomena.Physical Review E - Statistical, Nonlinear, and Soft Matter Physics, 78(3), September 2008. ISSN 15393755. doi: 10.1103/PhysRevE.78.036115
-
[14]
Social dynamics of financial networks.EPJ Data Science, 7(1):15, December 2018
Teruyoshi Kobayashi and Taro Takaguchi. Social dynamics of financial networks.EPJ Data Science, 7(1):15, December 2018. ISSN 2193-1127. doi: 10.1140/epjds/s13688-018-0143-y. URLhttps: //epjdatascience.springeropen.com/articles/10.1140/epjds/s13688-018-0143-y
-
[15]
American Mathematical Soc., 2017
David A Levin and Yuval Peres.Markov chains and mixing times, volume 107. American Mathematical Soc., 2017
2017
-
[16]
R.N. Mantegna. Hierarchical structure in financial markets.The European Physical Journal B, 11(1): 193–197, September 1999. ISSN 1434-6028. doi: 10.1007/s100510050929. URLhttp://link.springe r.com/10.1007/s100510050929
-
[17]
maxent_toolbox: Maximum entropy toolbox for matlab, version 1.0.2,
Ori Maoz and Elad Schneidman. maxent_toolbox: Maximum entropy toolbox for matlab, version 1.0.2,
-
[18]
URLhttps://orimaoz.github.io/maxent_toolbox. 12
-
[19]
M Mézard and J Sakellariou. Exact mean-field inference in asymmetric kinetic Ising systems.Journal of Statistical Mechanics: Theory and Experiment, 2011(07):L07001, July 2011. ISSN 1742-5468. doi: 10.1088/1742-5468/2011/07/L07001. URLhttps://iopscience.iop.org/article/10.1088/1742-5 468/2011/07/L07001
-
[20]
Chau Nguyen, Riccardo Zecchina, and Johannes Berg
H. Chau Nguyen, Riccardo Zecchina, and Johannes Berg. Inverse statistical problems: from the inverse Ising problem to data science.Advances in Physics, 66(3):197–261, July 2017. ISSN 14606976. doi: 10.1080/00018732.2017.1341604. arXiv: 1702.01522
-
[21]
Long-range Ising model for regional-scale seismic risk analysis
Sebin Oh, Sangri Yi, and Ziqi Wang. Long-range Ising model for regional-scale seismic risk analysis. Earthquake Engineering & Structural Dynamics, 53(12):3904–3923, 2024
2024
-
[22]
Phase Transitions in Collective Damage of Civil Structures under Natural Hazards
Sebin Oh, Jinyan Zhao, Raul Rincon, Jamie E. Padgett, and Ziqi Wang. Phase Transitions in Collective Damage of Civil Structures under Natural Hazards, February 2026. URLhttp://arxiv.org/abs/26 02.16195. arXiv:2602.16195 [stat]
work page internal anchor Pith review Pith/arXiv arXiv 2026
-
[23]
J.-P. Onnela, A. Chakraborti, K. Kaski, J. Kertész, and A. Kanto. Dynamics of market correlations: Taxonomy and portfolio analysis.Physical Review E, 68(5):056110, November 2003. ISSN 1063-651X, 1095-3787. doi: 10.1103/PhysRevE.68.056110. URLhttps://link.aps.org/doi/10.1103/PhysRev E.68.056110
-
[24]
Mahmudul Islam Rakib, Ashadun Nobi, and Jae Woo Lee. Structure and dynamics of financial networks by feature ranking method.Scientific Reports, 11(1):17618, September 2021. ISSN 2045-2322. doi: 10.1038/s41598-021-97100-1. URLhttps://www.nature.com/articles/s41598-021-97100-1
-
[25]
Yasser Roudi and John Hertz. Dynamical TAP equations for non-equilibrium Ising spin glasses.Journal of Statistical Mechanics: Theory and Experiment, 2011(03):P03031, March 2011. ISSN 1742-5468. doi: 10.1088/1742-5468/2011/03/P03031. URLhttps://iopscience.iop.org/article/10.1088/1742-5 468/2011/03/P03031
-
[26]
Berry, Ronen Segev, and William Bialek
Elad Schneidman, Michael J. Berry, Ronen Segev, and William Bialek. Weak pairwise correlations imply strongly correlated network states in a neural population.Nature, 440(7087):1007–1012, April
-
[27]
Weak pairwise correlations imply strongly correlated network states in a neural population
ISSN 14764687. doi: 10.1038/nature04701. arXiv: q-bio/0512013
work page internal anchor Pith review Pith/arXiv arXiv doi:10.1038/nature04701
-
[28]
Global industry classification standard (gics®) methodology, October 2025
S&P Dow Jones Indices and MSCI. Global industry classification standard (gics®) methodology, October 2025. URLhttps://www.spglobal.com/spdji/en/documents/methodologies/methodolog y-gics.pdf. Accessed: 2026-03-17
2025
-
[29]
Yong Tang, Jason Jie Xiong, Zi Yang Jia, and Yi Cheng Zhang. Complexities in financial network topological dynamics: Modeling of emerging and developed stock markets.Complexity, 2018, 2018. ISSN 10990526. doi: 10.1155/2018/4680140
-
[30]
Michele Tumminello, Fabrizio Lillo, and Rosario N. Mantegna. Correlation, hierarchies, and networks in financial markets.Journal of Economic Behavior & Organization, 75(1):40–58, July 2010. ISSN 01672681. doi: 10.1016/j.jebo.2010.01.004. URLhttps://linkinghub.elsevier.com/retrieve/pii /S0167268110000077
-
[31]
Collective dynamics of ‘small-world’networks.nature, 393 (6684):440–442, 1998
Duncan J Watts and Steven H Strogatz. Collective dynamics of ‘small-world’networks.nature, 393 (6684):440–442, 1998
1998
-
[32]
Financial price dynamics and phase transitions in the stock markets.The European Physical Journal B, 96(3):35, 2023
Ditian Zhang, Yangyang Zhuang, Pan Tang, Hongjuan Peng, and Qingying Han. Financial price dynamics and phase transitions in the stock markets.The European Physical Journal B, 96(3):35, 2023. 13 F unding Declaration The authors declare no relevant funding. Data availability The raw daily open and close price data analyzed in this study were obtained from Y...
2023
discussion (0)
Sign in with ORCID, Apple, or X to comment. Anyone can read and Pith papers without signing in.