How galaxies acquire their stellar mass at high redshift: High star formation efficiencies and the relative roles of dust and initial mass function
Pith reviewed 2026-06-29 21:18 UTC · model grok-4.3
The pith
Massive high-redshift galaxies formed stars at efficiencies of 0.8-0.9 before dropping to 0.2-0.3, requiring variable IMFs when dust is accounted for
A machine-rendered reading of the paper's core claim, the machinery that carries it, and where it could break.
Core claim
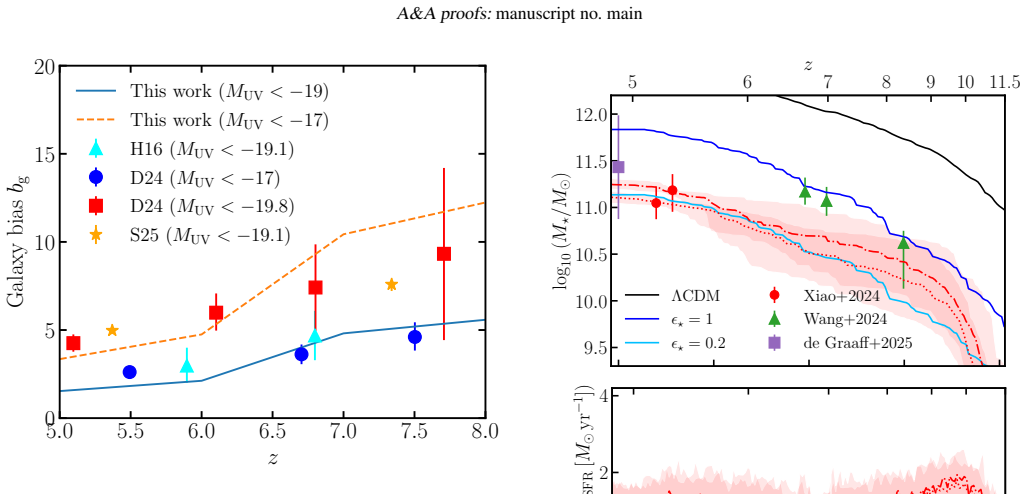
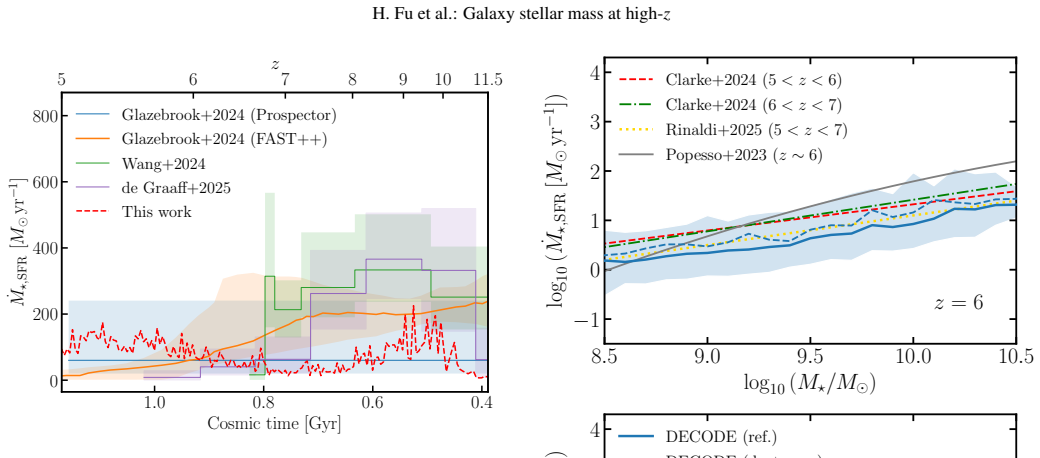
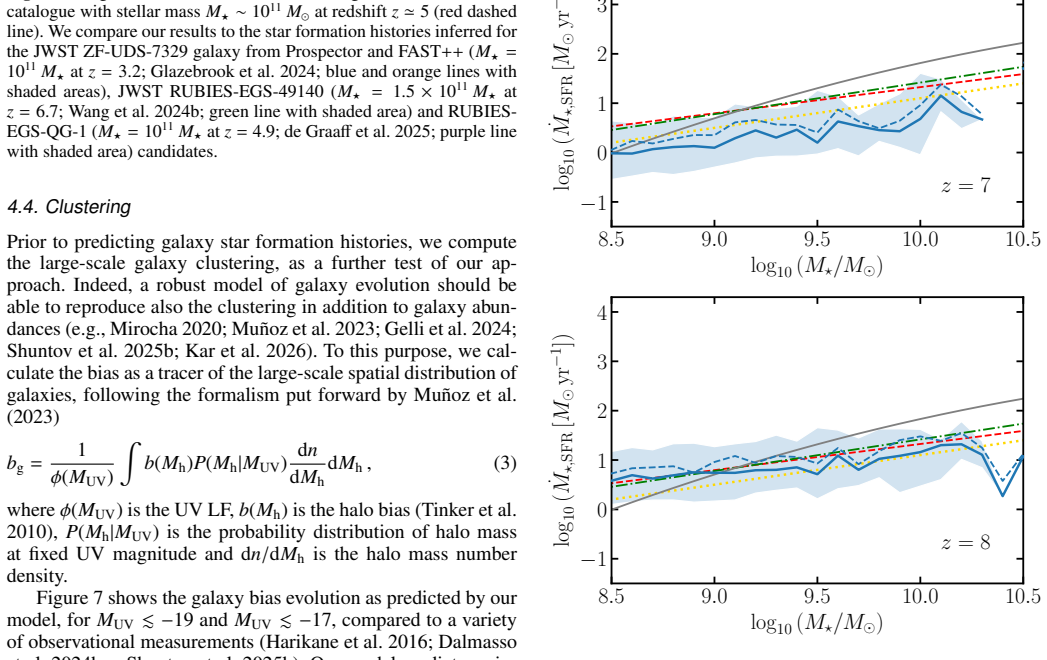
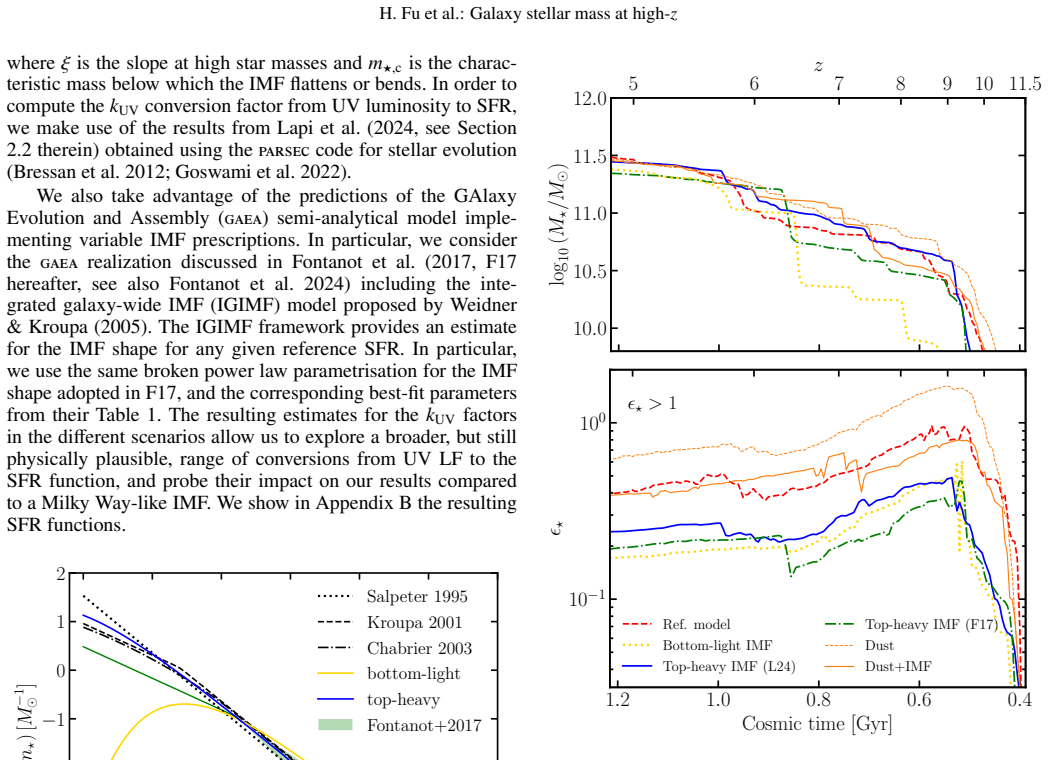
Massive galaxies grew their stellar mass with a bursty star formation at z∼9-10, with the SFE reaching high peaks of 0.8-0.9 at z>9 and lowering to standard values of 0.2-0.3 below z≲9. The presence of dust could enhance the predicted SFRs at z≲8, and switching to top-heavy IMFs reduces the SFEs by a factor of 2-3, highlighting the need for a variable IMF to avoid unphysical SFEs, especially in the presence of dust.
What carries the argument
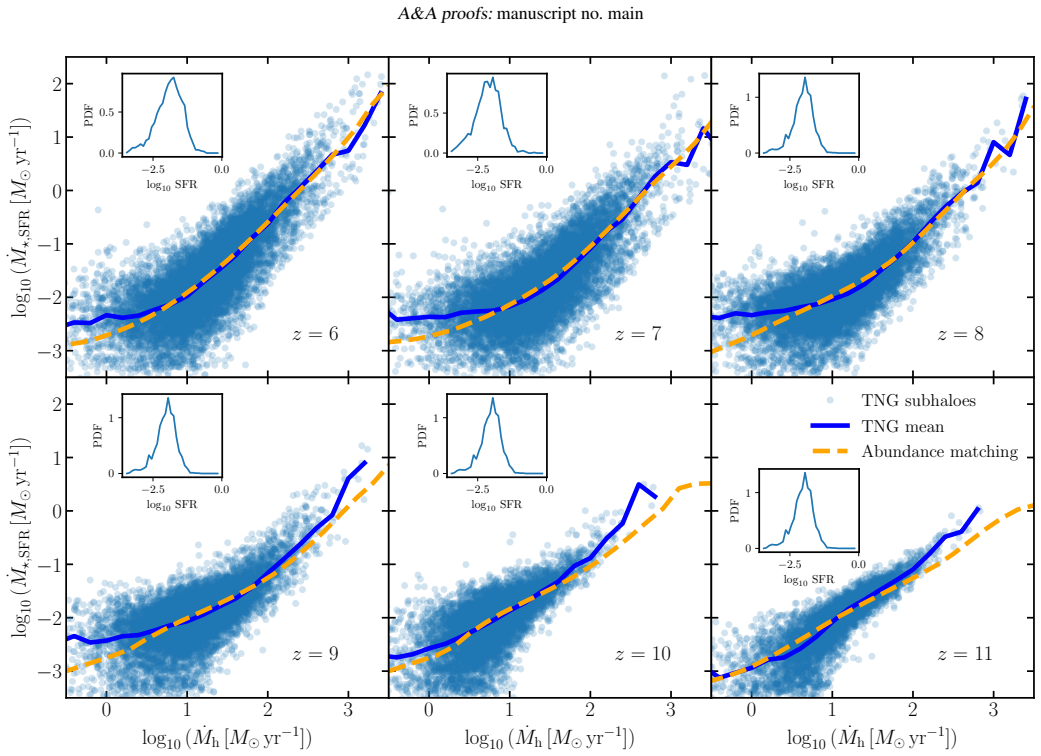
The SFR-halo accretion rate relation obtained via abundance matching of observed UV luminosity functions to dark matter halo accretion rate distributions.
Load-bearing premise
The abundance matching between UV luminosity functions and halo accretion rates correctly assigns the star formation rates to halos without needing to model cooling, feedback, or stochastic processes.
What would settle it
Measurements of the initial mass function or direct star formation efficiencies in z>9 galaxies showing no need for top-heavy IMFs or efficiencies remaining below 0.5 would falsify the requirement for variable IMFs and high efficiencies.
Figures
read the original abstract
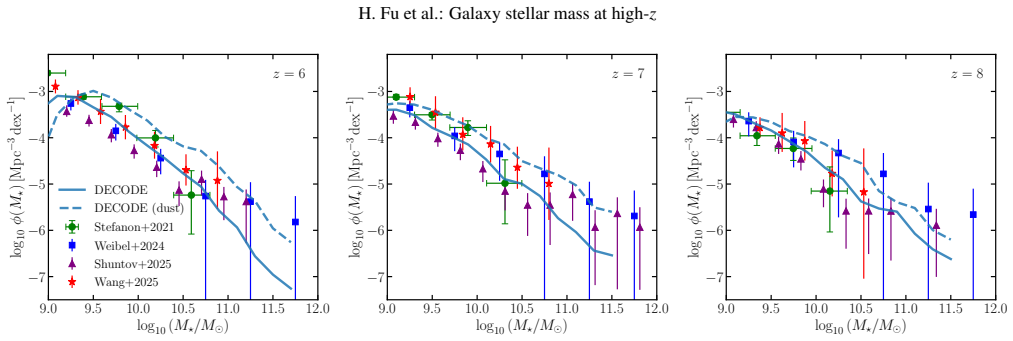
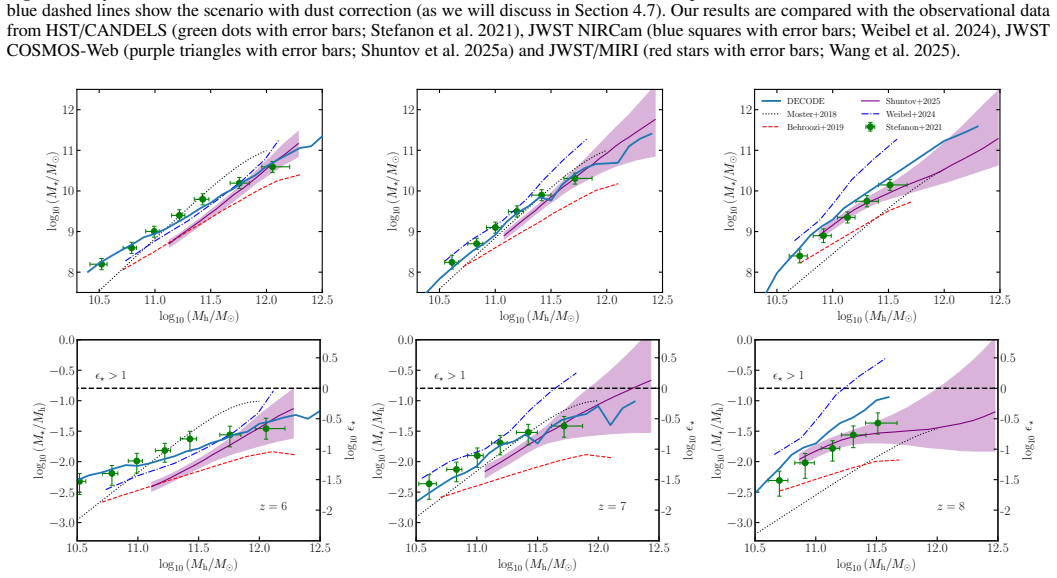
JWST has measured an unprecedented abundance of galaxies above $z\gtrsim 4-5$, whose formation and evolution are still difficult to reconcile within traditional galaxy evolution models in a $\Lambda$CDM framework. Here, we present a study on the star formation histories of these high-redshift galaxies between $z\simeq5-12$ via a data-driven semi-empirical model that uses the observed UV LFs as input to retrieve SFRs, naturally bypassing any uncertain modelling of cooling, feedback and/or stochastic processes. Galaxy stellar masses are progressively built in time by integrating their SFRs assigned along their progenitor haloes via the SFR-halo accretion rate relation, derived from abundance matching between the input observed UV LFs with the dark matter halo accretion rate distributions at each redshift. This makes the SFEs a full prediction of the model rather than a tuned input, serving as a natural baseline to test burstiness, dust attenuation, or IMF variations. Our approach naturally reproduces the total stellar mass function, the large-scale clustering, and the star-forming main sequence. We find that massive galaxies grew their stellar mass with a bursty star formation at $z\sim9-10$, broadly in agreement with the star formation histories inferred from spectral energy distribution fitting, with the SFE reaching high peaks of $0.8-0.9$ at $z>9$ and lowering to standard values of $0.2-0.3$ below $z\lesssim9$. We find that the presence of dust could enhance the predicted SFRs at $z\lesssim8$, better reproducing the observed SFRs of massive dusty galaxies, and increase the SFEs to values close to or even above unity at $z \gtrsim 8$. Finally, switching to top-heavy IMFs reduces the SFEs by a factor of $2-3$, highlighting the need for a variable IMF as an inevitable ingredient in the evolution of galaxies at high redshifts to avoid unphysical SFEs, especially in the presence of dust.
Editorial analysis
A structured set of objections, weighed in public.
Referee Report
Summary. The manuscript presents a data-driven semi-empirical model that derives SFRs for high-redshift galaxies by abundance matching observed UV luminosity functions to dark matter halo accretion rate distributions at each redshift, then integrates these SFRs along progenitor halo tracks to construct stellar mass assembly histories between z~5-12. The model claims this approach yields SFEs as predictions rather than inputs, reproduces the stellar mass function, large-scale clustering, and star-forming main sequence, and finds bursty star formation in massive galaxies at z~9-10 with SFEs peaking at 0.8-0.9 at z>9 before declining to 0.2-0.3 at z≲9; it further argues that dust attenuation and top-heavy IMFs are required to avoid unphysical SFEs near or above unity.
Significance. If the abundance-matching step is robust and the monotonic mapping assumption holds, the work supplies a useful empirical baseline for high-z galaxy growth that highlights the potential necessity of variable IMFs and bursty SF at early times, while matching several key observables without explicit tuning of feedback or cooling. This could inform interpretations of JWST data on early stellar mass buildup.
major comments (2)
- [Abstract] Abstract and description of the SFR-halo accretion rate relation: the relation is obtained by abundance matching the input observed UV LFs to halo accretion distributions, after which the same UV LFs are used to assign SFRs and integrate stellar masses. This makes the reported SFE peaks (0.8-0.9 at z>9) effectively the conversion factors needed to match the input data by construction, undermining the claim that SFEs are independent predictions of the model.
- [Abstract] Abstract and results on burstiness and SFE: the model concludes bursty SF at z~9-10 from the derived histories, yet the abundance-matching procedure assumes a monotonic, tight UV-to-halo-accretion mapping that may not hold under bursty SF (where instantaneous UV luminosity need not trace time-averaged accretion). No test of this assumption or error propagation on the matching step is reported, which is load-bearing for the quantitative SFE values and the necessity of variable IMF.
minor comments (1)
- The abstract states the model reproduces the star-forming main sequence but provides no quantitative comparison metrics or redshift range for this reproduction.
Simulated Author's Rebuttal
We thank the referee for the constructive feedback on our manuscript. We address each major comment below and have made revisions to the manuscript to improve clarity regarding the model's assumptions and methodology.
read point-by-point responses
-
Referee: [Abstract] Abstract and description of the SFR-halo accretion rate relation: the relation is obtained by abundance matching the input observed UV LFs to halo accretion distributions, after which the same UV LFs are used to assign SFRs and integrate stellar masses. This makes the reported SFE peaks (0.8-0.9 at z>9) effectively the conversion factors needed to match the input data by construction, undermining the claim that SFEs are independent predictions of the model.
Authors: We clarify that while the SFR-halo accretion rate relation is derived via abundance matching to the observed UV LFs, the SFEs are not input parameters but are calculated as the ratio of the assigned SFR to the expected baryonic accretion rate. This allows the model to predict stellar mass growth without presupposing the efficiency. The claim of 'predictions' refers to the fact that no functional form or redshift evolution for SFE was assumed a priori. We have revised the abstract to better articulate this point. revision: partial
-
Referee: [Abstract] Abstract and results on burstiness and SFE: the model concludes bursty SF at z~9-10 from the derived histories, yet the abundance-matching procedure assumes a monotonic, tight UV-to-halo-accretion mapping that may not hold under bursty SF (where instantaneous UV luminosity need not trace time-averaged accretion). No test of this assumption or error propagation on the matching step is reported, which is load-bearing for the quantitative SFE values and the necessity of variable IMF.
Authors: The potential inconsistency between the monotonic mapping assumption and bursty star formation is a valid concern. Our model uses the mean relation at each redshift, and the bursty appearance in the assembly histories stems from the varying accretion rates of individual haloes. We did not include a dedicated test or error propagation in the original submission. To address this, we have added text in the methods and discussion sections noting this limitation and its implications for the quantitative SFE values and the interpretation of IMF variations. This revision acknowledges the approximation while maintaining the utility of the mean relations derived. revision: yes
Circularity Check
SFE peaks presented as predictions but obtained directly via abundance matching to the input UV LFs
specific steps
-
fitted input called prediction
[Abstract]
"This makes the SFEs a full prediction of the model rather than a tuned input, serving as a natural baseline to test burstiness, dust attenuation, or IMF variations. ... Galaxy stellar masses are progressively built in time by integrating their SFRs assigned along their progenitor haloes via the SFR-halo accretion rate relation, derived from abundance matching between the input observed UV LFs with the dark matter halo accretion rate distributions at each redshift."
The SFR-halo relation is obtained by abundance matching the same observed UV LFs that supply the SFRs; the resulting SFEs are therefore the numerical factors needed to match the input UV LF abundances to halo accretion rates at each z. Reporting these SFEs as model predictions and concluding bursty SF or variable IMF necessity from their high values is circular because the values are forced by the matching step itself.
full rationale
The paper derives the SFR-halo accretion rate relation by abundance matching the observed UV luminosity functions (the sole data input) to halo accretion rate distributions, then assigns SFRs along progenitor tracks and integrates to obtain stellar masses and SFEs. The reported SFE values (0.8-0.9 at z>9) are therefore the exact conversion factors required to reproduce the input UV LF number densities at each redshift; labeling them 'full predictions' and using them to infer burstiness or variable IMF necessity is a fitted-input-called-prediction pattern. The model does reproduce other observables (SMF, clustering) by construction from the same matching, but the central SFE claim reduces to the input data rather than an independent derivation.
Axiom & Free-Parameter Ledger
axioms (1)
- domain assumption Abundance matching between observed UV luminosity functions and dark matter halo accretion rate distributions at each redshift accurately assigns SFRs to haloes while bypassing modelling of cooling, feedback and stochastic processes.
Reference graph
Works this paper leans on
-
[1]
, " * write output.state after.block = add.period write newline
ENTRY address archiveprefix author booktitle chapter edition editor howpublished institution eprint journal key month note number organization pages publisher school series title type volume year label extra.label sort.label short.list INTEGERS output.state before.all mid.sentence after.sentence after.block FUNCTION init.state.consts #0 'before.all := #1 ...
-
[2]
write newline
" write newline "" before.all 'output.state := FUNCTION n.dashify 't := "" t empty not t #1 #1 substring "-" = t #1 #2 substring "--" = not "--" * t #2 global.max substring 't := t #1 #1 substring "-" = "-" * t #2 global.max substring 't := while if t #1 #1 substring * t #2 global.max substring 't := if while FUNCTION word.in bbl.in " " * FUNCTION format....
-
[3]
J., Conselice , C
Adams , N. J., Conselice , C. J., Austin , D., et al. 2024, , 965, 169
2024
-
[4]
B., Casey , C
Akins , H. B., Casey , C. M., Lambrides , E., et al. 2025, , 991, 37
2025
-
[5]
Algera , H. S. B., Inami , H., Oesch , P. A., et al. 2023, , 518, 6142
2023
-
[6]
2015, , 810, 74
Aversa , R., Lapi , A., de Zotti , G., Shankar , F., & Danese , L. 2015, , 810, 74
2015
-
[7]
M., Valentino , F., Lagos , C
Baker , W. M., Valentino , F., Lagos , C. d. P., et al. 2025, , 702, A270
2025
-
[8]
H., Hearin , A
Behroozi , P., Wechsler , R. H., Hearin , A. P., & Conroy , C. 2019, , 488, 3143
2019
-
[9]
R., Drory , N., & Sheth , R
Bernardi , M., Dom \' nguez S \'a nchez , H., Brownstein , J. R., Drory , N., & Sheth , R. K. 2019, , 489, 5633
2019
-
[10]
B., et al
Bernardi , M., Shankar , F., Hyde , J. B., et al. 2010, , 404, 2087
2010
-
[11]
& Fritze-v
Bicker , J. & Fritze-v. Alvensleben , U. 2005, , 443, L19
2005
-
[12]
2023, , 954, 97
Boco , L., Lapi , A., Shankar , F., et al. 2023, , 954, 97
2023
-
[13]
2025, , 984, 117
Bosi , M., Lapi , A., Boco , L., et al. 2025, , 984, 117
2025
-
[14]
2015, , 575, A56
Bournaud , F., Daddi , E., Wei , A., et al. 2015, , 575, A56
2015
-
[15]
2023, , 523, 1009
Bouwens , R., Illingworth , G., Oesch , P., et al. 2023, , 523, 1009
2023
-
[16]
J., Illingworth , G., Ellis , R
Bouwens , R. J., Illingworth , G., Ellis , R. S., Oesch , P., & Stefanon , M. 2022, , 940, 55
2022
-
[17]
J., Illingworth , G
Bouwens , R. J., Illingworth , G. D., Oesch , P. A., et al. 2015, , 803, 34
2015
-
[18]
J., Oesch , P
Bouwens , R. J., Oesch , P. A., Stefanon , M., et al. 2021, , 162, 47
2021
-
[19]
Bowler , R. A. A., Dunlop , J. S., McLure , R. J., et al. 2015, , 452, 1817
2015
-
[20]
2023, Nature Astronomy, 7, 731
Boylan-Kolchin , M. 2023, Nature Astronomy, 7, 731
2023
-
[21]
2012, , 427, 127
Bressan , A., Marigo , P., Girardi , L., et al. 2012, , 427, 127
2012
-
[22]
& Shankar , F
Buchan , S. & Shankar , F. 2016, , 462, 2001
2016
-
[23]
2026, arXiv e-prints, arXiv:2602.18068
Calabr \`o , A., Pentericci , L., Llerena , M., et al. 2026, arXiv e-prints, arXiv:2602.18068
-
[24]
C., et al
Calzetti , D., Armus , L., Bohlin , R. C., et al. 2000, , 533, 682
2000
-
[25]
2006, , 366, 1126
Cappellari , M., Bacon , R., Bureau , M., et al. 2006, , 366, 1126
2006
-
[26]
C., Begley , R., McLeod , D
Carnall , A. C., Begley , R., McLeod , D. J., et al. 2023, , 518, L45
2023
-
[27]
C., Cullen , F., McLure , R
Carnall , A. C., Cullen , F., McLure , R. J., et al. 2024, , 534, 325
2024
-
[28]
2003, , 115, 763
Chabrier , G. 2003, , 115, 763
2003
-
[29]
& Fall , S
Charlot , S. & Fall , S. M. 2000, , 539, 718
2000
-
[30]
E., Sanders , R
Clarke , L., Shapley , A. E., Sanders , R. L., et al. 2024, , 977, 133
2024
-
[31]
2026, Journal of High Energy Astrophysics, 53, 100626
Comini , L., Vagnozzi , S., & Loeb , A. 2026, Journal of High Energy Astrophysics, 53, 100626
2026
-
[32]
& van Dokkum , P
Conroy , C. & van Dokkum , P. G. 2012, , 760, 71
2012
-
[33]
J., McLure , R
Cullen , F., McLeod , D. J., McLure , R. J., et al. 2024, , 531, 997
2024
-
[34]
2023, , 518, 425
Curti , M., D'Eugenio , F., Carniani , S., et al. 2023, , 518, 425
2023
-
[35]
2023, Nature Astronomy, 7, 622
Curtis-Lake , E., Carniani , S., Cameron , A., et al. 2023, Nature Astronomy, 7, 622
2023
-
[36]
2024 a , , 533, 2391
Dalmasso , N., Leethochawalit , N., Trenti , M., & Boyett , K. 2024 a , , 533, 2391
2024
-
[37]
2024 b , , 528, 898
Dalmasso , N., Trenti , M., & Leethochawalit , N. 2024 b , , 528, 898
2024
-
[38]
2019, , 486, 2827
Dav \'e , R., Angl \'e s-Alc \'a zar , D., Narayanan , D., et al. 2019, , 486, 2827
2019
-
[39]
J., Brammer , G., et al
de Graaff , A., Setton , D. J., Brammer , G., et al. 2025, Nature Astronomy, 9, 280
2025
-
[40]
& Birnboim , Y
Dekel , A. & Birnboim , Y. 2006, , 368, 2
2006
-
[41]
2009, , 457, 451
Dekel , A., Birnboim , Y., Engel , G., et al. 2009, , 457, 451
2009
-
[42]
2025, , 544, 160
Dekel , A., Mandelker , N., Li , Z., et al. 2025, , 544, 160
2025
-
[43]
C., Birnboim , Y., Mandelker , N., & Li , Z
Dekel , A., Sarkar , K. C., Birnboim , Y., Mandelker , N., & Li , Z. 2023, , 523, 3201
2023
-
[44]
T., McLure , R
Donnan , C. T., McLure , R. J., Dunlop , J. S., et al. 2024, , 533, 3222
2024
-
[45]
2019 a , , 489, 3036
Donnari , M., Pillepich , A., Nelson , D., et al. 2019 a , , 489, 3036
2019
-
[46]
2019 b , , 485, 4817
Donnari , M., Pillepich , A., Nelson , D., et al. 2019 b , , 485, 4817
2019
-
[47]
2025, , 982, L12
Dou , J., Peng , Y., Gu , Q., et al. 2025, , 982, L12
2025
-
[48]
2023, , 519, 2199
Eisert , L., Pillepich , A., Nelson , D., et al. 2023, , 519, 2199
2023
-
[49]
Empirical estimates of how massive galaxies can be in {\Lambda}CDM
Enr \' quez-Vargas , M., Rodr \' guez-Puebla , A., Manuwal , A., et al. 2026, arXiv e-prints, arXiv:2605.08353
work page internal anchor Pith review Pith/arXiv arXiv 2026
-
[50]
2025, , 697, A1
Euclid Collaboration , Mellier , Y., Abdurro'uf , et al. 2025, , 697, A1
2025
-
[51]
2026, , 998, 178
Fakhry , S., Shiravand , M., & Del Popolo , A. 2026, , 998, 178
2026
-
[52]
2024, , 684, A207
Ferrara , A. 2024, , 684, A207
2024
-
[53]
2025 a , The Open Journal of Astrophysics, 8, 140
Ferrara , A., Manzoni , D., & Ntormousi , E. 2025 a , The Open Journal of Astrophysics, 8, 140
2025
-
[54]
2023, , 522, 3986
Ferrara , A., Pallottini , A., & Dayal , P. 2023, , 522, 3986
2023
-
[55]
2025 b , , 694, A286
Ferrara , A., Pallottini , A., & Sommovigo , L. 2025 b , , 694, A286
2025
-
[56]
2022, , 512, 58
Ferrara , A., Sommovigo , L., Dayal , P., et al. 2022, , 512, 58
2022
-
[57]
L., Bagley , M
Finkelstein , S. L., Bagley , M. B., Ferguson , H. C., et al. 2023, , 946, L13
2023
-
[58]
L., Leung , G
Finkelstein , S. L., Leung , G. C. K., Bagley , M. B., et al. 2024, , 969, L2
2024
-
[59]
Fitzpatrick , E. L. & Massa , D. 1986, , 307, 286
1986
-
[60]
2017, , 464, 3812
Fontanot , F., De Lucia , G., Hirschmann , M., et al. 2017, , 464, 3812
2017
-
[61]
2026, arXiv e-prints, arXiv:2603.22405
Fontanot , F., De Lucia , G., Xie , L., et al. 2026, arXiv e-prints, arXiv:2603.22405
-
[62]
2024, , 686, A302
Fontanot , F., La Barbera , F., De Lucia , G., et al. 2024, , 686, A302
2024
-
[63]
2025 a , , 695, A252
Fu , H., Boco , L., Shankar , F., et al. 2025 a , , 695, A252
2025
-
[64]
2022, , 516, 3206
Fu , H., Shankar , F., Ayromlou , M., et al. 2022, , 516, 3206
2022
-
[65]
2024, , 532, 177
Fu , H., Shankar , F., Ayromlou , M., et al. 2024, , 532, 177
2024
-
[66]
2025 b , , 704, A244
Fu , H., Shankar , F., Yuan , F., et al. 2025 b , , 704, A244
2025
-
[67]
Gelli , V., Mason , C., & Hayward , C. C. 2024, , 975, 192
2024
-
[68]
2000, , 141, 371
Girardi , L., Bressan , A., Bertelli , G., & Chiosi , C. 2000, , 141, 371
2000
-
[69]
2024, , 628, 277
Glazebrook , K., Nanayakkara , T., Schreiber , C., et al. 2024, , 628, 277
2024
-
[70]
2022, , 663, A1
Goswami , S., Silva , L., Bressan , A., et al. 2022, , 663, A1
2022
-
[71]
2020, , 643, A8
Gruppioni , C., B \'e thermin , M., Loiacono , F., et al. 2020, , 643, A8
2020
-
[72]
J., Shankar , F., Leja , J., et al
Grylls , P. J., Shankar , F., Leja , J., et al. 2020, , 491, 634
2020
-
[73]
J., Shankar , F., Zanisi , L., & Bernardi , M
Grylls , P. J., Shankar , F., Zanisi , L., & Bernardi , M. 2019, , 483, 2506
2019
-
[74]
K., Ellis , R
Harikane , Y., Inoue , A. K., Ellis , R. S., et al. 2025, , 980, 138
2025
-
[75]
2023, , 265, 5
Harikane , Y., Ouchi , M., Oguri , M., et al. 2023, , 265, 5
2023
-
[76]
2016, , 821, 123
Harikane , Y., Ouchi , M., Ono , Y., et al. 2016, , 821, 123
2016
-
[77]
Hopkins , A. M. 2018, , 35, e039
2018
-
[78]
F., Quataert , E., & Murray , N
Hopkins , P. F., Quataert , E., & Murray , N. 2011, , 417, 950
2011
-
[79]
K., Li , W., & Ho , L
Inayoshi , K., Harikane , Y., Inoue , A. K., Li , W., & Ho , L. C. 2022, , 938, L10
2022
-
[80]
M., Tyson , J
Ivezi \'c , Z ., Kahn , S. M., Tyson , J. A., et al. 2019, , 873, 111
2019
discussion (0)
Sign in with ORCID, Apple, or X to comment. Anyone can read and Pith papers without signing in.