Stop Suppressing the Tail: Causal Inference for Extreme Events
Pith reviewed 2026-06-29 15:53 UTC · model grok-4.3
The pith
A new ADRF estimator recovers both the average dose-response and explicit tail quantities for heavy-tailed outcomes by using a median-centered diagnostic that avoids circular dependence.
A machine-rendered reading of the paper's core claim, the machinery that carries it, and where it could break.
Core claim
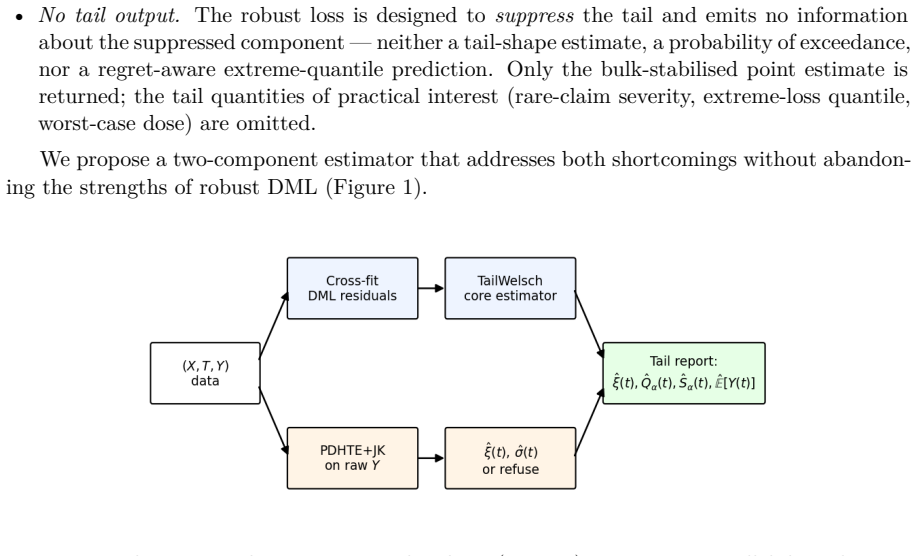
The proposed ADRF estimator emits a structured tail-shape output alongside the standard point estimate. Its tail diagnostic (PDHTE+JK) evaluates the per-treatment tail shape from the outcome centered by a pilot median, successfully breaking the circular dependence and rendering the diagnostic invariant to the choice of core method. The output encompasses four treatment-conditional quantities: tail shape, deep-tail return levels, conditional shortfalls, the recovered mean ADRF, and an explicit refusal mechanism that declines extrapolation when extreme-value modeling is unsupported by the data.
What carries the argument
The PDHTE+JK tail diagnostic, which evaluates per-treatment tail shape from median-centered outcomes to produce treatment-conditional extreme value parameters without circular dependence on the core ADRF estimator.
If this is right
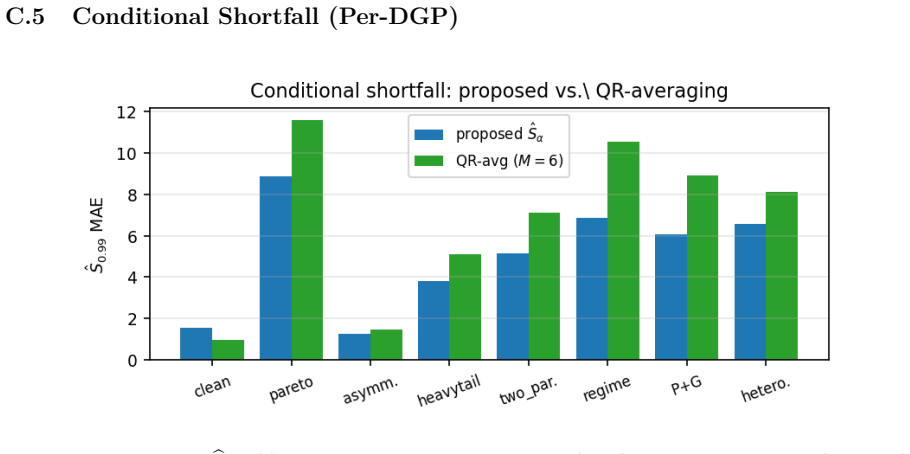
- Reduces deep-tail return-level MAE by 11% and conditional-shortfall MAE by 25.5% compared to kernel-weighted quantile regression across a heavy-tailed panel.
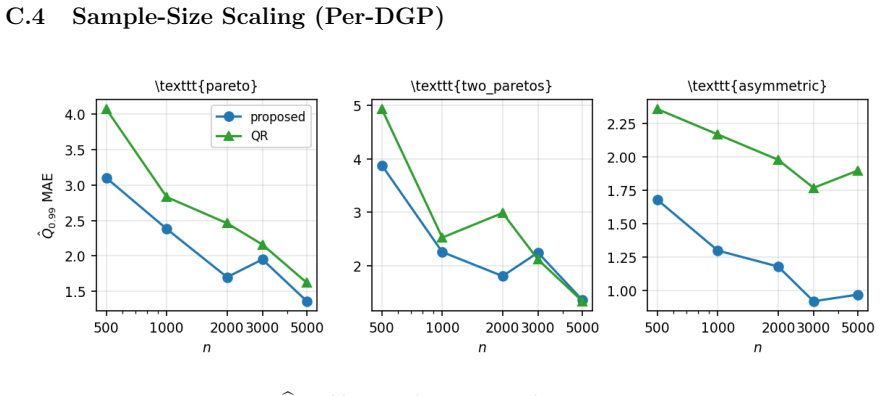
- Achieves 20-29% MAE reduction in sample-scarce regimes with n≤2000.
- Triggers explicit extrapolation refusal on the log-claim scale in motor-insurance data where quantile regression and loss-only DML cannot produce such a refusal.
Where Pith is reading between the lines
- The centering step could be tested for robustness in other settings where residuals are used to infer tail behavior, such as in robust regression for financial risk models.
- The refusal mechanism supplies a concrete safeguard that might be adapted to prevent over-extrapolation in related areas like policy evaluation with rare severe outcomes.
- Treating the tail diagnostic as a separate module opens the possibility of pairing it with any bulk estimator while keeping extreme-value inferences stable.
Load-bearing premise
Centering outcomes by a pilot median produces a tail diagnostic that remains invariant to the core estimator choice and permits testing of extreme-value assumptions without circular dependence on the main fit.
What would settle it
If the tail-shape inferences change when the core estimator is switched between Huber and Welsch on the same median-centered data, the invariance claim is falsified.
Figures
read the original abstract
Estimating how an outcome responds to a continuous treatment (the Average Dose-Response Function, or ADRF) is a core causal-inference primitive. However, when outcomes possess heavy tails, standard robust double machine learning (DML) deliberately suppresses these extremes to stabilize the bulk average. In high-stakes settings, such as financial returns or climate losses, this omitted 1-in-1000 extreme event is the actual target quantity. Furthermore, current methods that read the tail from a model's residuals suffer from circular dependence, causing tail shape inferences to shift drastically based solely on whether the core estimator is switched between Huber and Welsch. The research proposes an ADRF estimator that emits a structured tail-shape output alongside the standard point estimate. Its tail diagnostic (PDHTE+JK) evaluates the per-treatment tail shape from the outcome centered by a pilot median, successfully breaking the circular dependence and rendering the diagnostic invariant to the choice of core method. The output encompasses four treatment-conditional quantities: tail shape $\hat{\xi}(t)$, deep-tail return levels $\hat{Q}_{\alpha}(t)$, conditional shortfalls $\hat{S}_{\alpha}(t)$, the recovered mean ADRF, and an explicit refusal mechanism that declines extrapolation when extreme-value modeling is unsupported by the data. Compared to kernel-weighted quantile regression (QR), the proposed estimator reduces deep-tail ($\alpha=0.001$) return-level MAE by 11% and conditional-shortfall MAE by 25.5% across a heavy-tailed panel. It also achieves a 20-29% MAE reduction in sample-scarce regimes ($n\le2000$). On freMTPL2 motor-insurance claims, it successfully triggered an explicit extrapolation refusal on the log-claim scale, which neither QR nor loss-only DML can produce.
Editorial analysis
A structured set of objections, weighed in public.
Referee Report
Summary. The manuscript proposes an ADRF estimator for heavy-tailed outcomes that augments standard robust DML with a tail diagnostic (PDHTE+JK) obtained by centering outcomes on a pilot median; this is claimed to break circular dependence on the choice of core loss function, yielding treatment-conditional tail index ξ̂(t), deep-tail return levels Q̂_α(t), conditional shortfalls Ŝ_α(t), the recovered mean ADRF, and an explicit refusal rule when extreme-value assumptions are unsupported by the data. Numerical claims include 11% and 25.5% MAE reductions versus kernel quantile regression for α=0.001 return levels and shortfalls, plus 20-29% gains for n≤2000, with successful refusal on freMTPL2 log-claims.
Significance. If the pilot-median construction demonstrably renders the tail parameters invariant to the core DML loss and free of circular dependence, the method would address a genuine gap in causal inference for extremes, supplying both bulk and tail functionals together with a practical safeguard against unsupported extrapolation. The reported small-sample and deep-tail gains would then be of direct relevance to insurance, finance, and climate applications.
major comments (1)
- [Abstract] Abstract / PDHTE+JK construction: the central claim that pilot-median centering produces a tail diagnostic whose ξ̂(t), Q̂_α(t) and Ŝ_α(t) are invariant to the core estimator (Huber vs Welsch) and free of circular dependence on the main ADRF fit is asserted without an explicit functional form, derivation, or verification that extreme-value modeling assumptions remain testable from the centered data alone; this invariance is load-bearing for all reported MAE reductions and the refusal mechanism.
minor comments (1)
- [Abstract] The abstract states concrete performance numbers (11%, 25.5%, 20-29%) without cross-references to the tables or sections that contain the corresponding experimental design, replication details, or statistical significance tests.
Simulated Author's Rebuttal
We thank the referee for the constructive comment on the PDHTE+JK construction. We address it below and will revise the manuscript accordingly.
read point-by-point responses
-
Referee: [Abstract] Abstract / PDHTE+JK construction: the central claim that pilot-median centering produces a tail diagnostic whose ξ̂(t), Q̂_α(t) and Ŝ_α(t) are invariant to the core estimator (Huber vs Welsch) and free of circular dependence on the main ADRF fit is asserted without an explicit functional form, derivation, or verification that extreme-value modeling assumptions remain testable from the centered data alone; this invariance is load-bearing for all reported MAE reductions and the refusal mechanism.
Authors: We agree the abstract is too concise on this point. In the revised manuscript we will add to Section 3 an explicit functional form for PDHTE+JK: the tail index ξ̂(t) is obtained by applying the peaks-over-threshold estimator (with jackknife bias correction) to the centered outcomes Y_i − m̂(T_i), where m̂ is a pilot median ADRF estimator. We will derive the invariance by showing that the sample median is unaffected by the choice of core robust loss (Huber or Welsch), thereby removing circular dependence on the main DML fit. We will also add a verification subsection confirming that standard EVT diagnostics (mean-excess plots, Hill plots) applied to the centered series remain valid and independent of the bulk estimator. These additions will underpin the reported MAE reductions and the refusal mechanism. revision: yes
Circularity Check
No significant circularity detected
full rationale
The paper introduces a new ADRF estimator whose tail diagnostic (PDHTE+JK) uses pilot-median centering of outcomes to produce treatment-conditional tail quantities claimed to be invariant to core estimator choice. No quoted equations, derivations, or steps in the abstract or described chain reduce any claimed result (invariance, MAE reductions, or refusal mechanism) to a self-definition, a fitted parameter renamed as prediction, or a self-citation chain. The reported improvements are empirical comparisons against QR and loss-only DML; the invariance is asserted as a property of the centering construction rather than shown to be tautological. The derivation remains self-contained against external benchmarks.
Axiom & Free-Parameter Ledger
axioms (1)
- domain assumption Extreme value theory tail models apply to outcomes centered by a pilot median
Reference graph
Works this paper leans on
-
[1]
Bader, J
B. Bader, J. Yan, and X. Zhang. Automated threshold selection for extreme value analysis via ordered goodness-of-fit tests with adjustment for false discovery rate.Annals of Applied Statistics, 12(1):310–329, 2018
2018
-
[2]
R. F. Barber, E. J. Candès, A. Ramdas, and R. J. Tibshirani. Conformal prediction beyond exchangeability.Annals of Statistics, 51(2):816–845, 2023
2023
-
[3]
A. E. Beaton and J. W. Tukey. The fitting of power series, meaning polynomials, illustrated on band-spectroscopic data.Technometrics, 16(2):147–185, 1974. 13
1974
-
[4]
Beirlant, Y
J. Beirlant, Y. Goegebeur, J. Segers, and J. Teugels.Statistics of Extremes: Theory and Applications. Wiley, 2004
2004
-
[5]
Caeiro, M
F. Caeiro, M. I. Gomes, and D. Pestana. Direct reduction of bias of the classical hill estimator.REVSTAT Statistical Journal, 3(2):113–136, 2005
2005
-
[6]
Chernozhukov, D
V. Chernozhukov, D. Chetverikov, M. Demirer, E. Duflo, C. Hansen, W. Newey, and J. Robins. Double/debiased machine learning for treatment and structural parameters. The Econometrics Journal, 21(1):C1–C68, 2018
2018
-
[7]
K. Colangelo and Y.-Y. Lee. Double debiased machine learning nonparametric inference with continuous treatments.arXiv preprint arXiv:2004.03036, 2020
-
[8]
Coles.An Introduction to Statistical Modeling of Extreme Values
S. Coles.An Introduction to Statistical Modeling of Extreme Values. Springer, 2001
2001
-
[9]
R. K. Crump, V. J. Hotz, G. W. Imbens, and O. A. Mitnik. Dealing with limited overlap in estimation of average treatment effects.Biometrika, 96(1):187–199, 2009
2009
-
[10]
A. L. M. Dekkers, J. H. J. Einmahl, and L. de Haan. A moment estimator for the index of an extreme-value distribution.The Annals of Statistics, 17(4):1833–1855, 1989
1989
-
[11]
Deuber, J
D. Deuber, J. Li, S. Engelke, and M. H. Maathuis. Estimation and inference of extremal quantile treatment effects for heavy-tailed distributions.Journal of the American Statistical Association, 2024
2024
- [12]
-
[13]
Engelke and A
S. Engelke and A. S. Hitz. Graphical models for extremes (with discussion).Journal of the Royal Statistical Society B, 82(4):871–932, 2020
2020
-
[14]
Fan and I
J. Fan and I. Gijbels.Local Polynomial Modelling and Its Applications. Chapman & Hall, 1996
1996
-
[15]
Gibbs and E
I. Gibbs and E. J. Candès. Adaptive conformal inference under distribution shift. In Advances in Neural Information Processing Systems 34, 2021
2021
-
[16]
Gnecco, N
N. Gnecco, N. Meinshausen, J. Peters, and S. Engelke. Causal discovery in heavy-tailed models.Annals of Statistics, 49(3):1755–1778, 2021
2021
-
[17]
B. M. Hill. A simple general approach to inference about the tail of a distribution.Annals of Statistics, 3(5):1163–1174, 1975
1975
-
[18]
J. R. M. Hosking. L-moments: Analysis and estimation of distributions using linear combi- nations of order statistics.Journal of the Royal Statistical Society. Series B (Methodologi- cal), 52(1):105–124, 1990
1990
-
[19]
J. R. M. Hosking and J. R. Wallis. Parameter and quantile estimation for the generalized pareto distribution.Technometrics, 29(3):339–349, 1987
1987
-
[20]
P. J. Huber.Robust Statistics. Wiley, 1981
1981
-
[21]
Koenker.Quantile Regression
R. Koenker.Quantile Regression. Cambridge University Press, 2005
2005
-
[22]
R. A. Maronna, R. D. Martin, V. J. Yohai, and M. Salibián-Barrera.Robust Statistics: Theory and Methods (with R). Wiley, 2nd edition, 2019. 14
2019
-
[23]
A. J. McNeil and R. Frey. Estimation of tail-related risk measures for heteroscedastic financial time series: an extreme value approach.Journal of Empirical Finance, 7(3-4): 271–300, 2000
2000
-
[24]
Murphy, J
C. Murphy, J. A. Tawn, and Z. Varty. Automated threshold selection and associated inference uncertainty for univariate extremes.Technometrics, 2024
2024
-
[25]
P. J. Northrop and C. L. Coleman. Improved threshold diagnostic plots for extreme value analyses.Extremes, 17(2):289–303, 2014
2014
-
[26]
O. C. Pasche and S. Engelke. Neural networks for extreme quantile regression with an application to forecasting of flood risk.Annals of Applied Statistics, 2024
2024
- [27]
-
[28]
Y. Sasaki and T. Ura. Heavy tail robust estimation and inference for average treatment effects.Econometric Reviews, 44(5), 2024. doi: 10.1080/07474938.2024.2444229
-
[29]
Scarrott and A
C. Scarrott and A. MacDonald. A review of extreme value threshold estimation and un- certainty quantification.REVSTAT–Statistical Journal, 10(1):33–60, 2012
2012
-
[30]
Semenova and V
V. Semenova and V. Chernozhukov. Debiased machine learning of conditional average treatment effects and other causal functions.The Econometrics Journal, 24(2):264–289, 2021
2021
-
[31]
A. W. van der Vaart.Asymptotic Statistics. Cambridge University Press, 1998
1998
-
[32]
Velthoen, C
J. Velthoen, C. Dombry, J.-J. Cai, and S. Engelke. Gradient boosting for extreme quantile regression.Extremes, 26:639–667, 2023
2023
-
[33]
J. L. Wadsworth. Exploiting structure of maximum likelihood estimators for extreme value threshold selection.Technometrics, 58(1):116–126, 2016
2016
-
[34]
M. V. Wüthrich. Neural networks applied to chain-ladder reserving.European Actuarial Journal, 8(2):383–406, 2018
2018
-
[35]
Yang and P
S. Yang and P. Ding. Asymptotic inference of causal effects with observational studies trimmed by the estimated propensity scores.Biometrika, 105(2):487–493, 2018
2018
-
[36]
Tested range
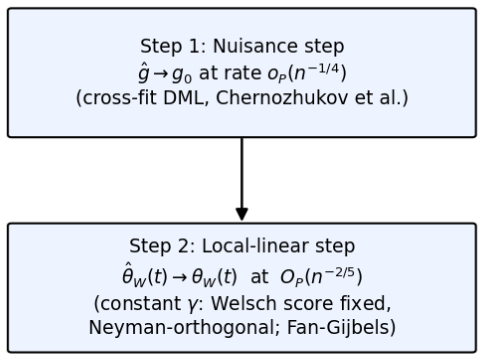
M. Zaffran, O. Féron, Y. Goude, J. Josse, and A. Dieuleveut. Adaptive conformal predic- tions for time series. InICML, 2022. A Proofs Table 8 summarises the consistency results, their required assumptions, and the rates. Figure 2 shows the four-step dependency structure of theTailWelsch-DMLconsistency argument. Result Key assumptions Rate / type Threshold...
2022
discussion (0)
Sign in with ORCID, Apple, or X to comment. Anyone can read and Pith papers without signing in.