Steering Tropical Cyclones Using Small Perturbations in an AI Weather Model
Pith reviewed 2026-06-29 00:12 UTC · model grok-4.3
The pith
Small targeted thermodynamic perturbations can produce track deviations exceeding 500 km after seven days in a tropical cyclone simulation.
A machine-rendered reading of the paper's core claim, the machinery that carries it, and where it could break.
Core claim
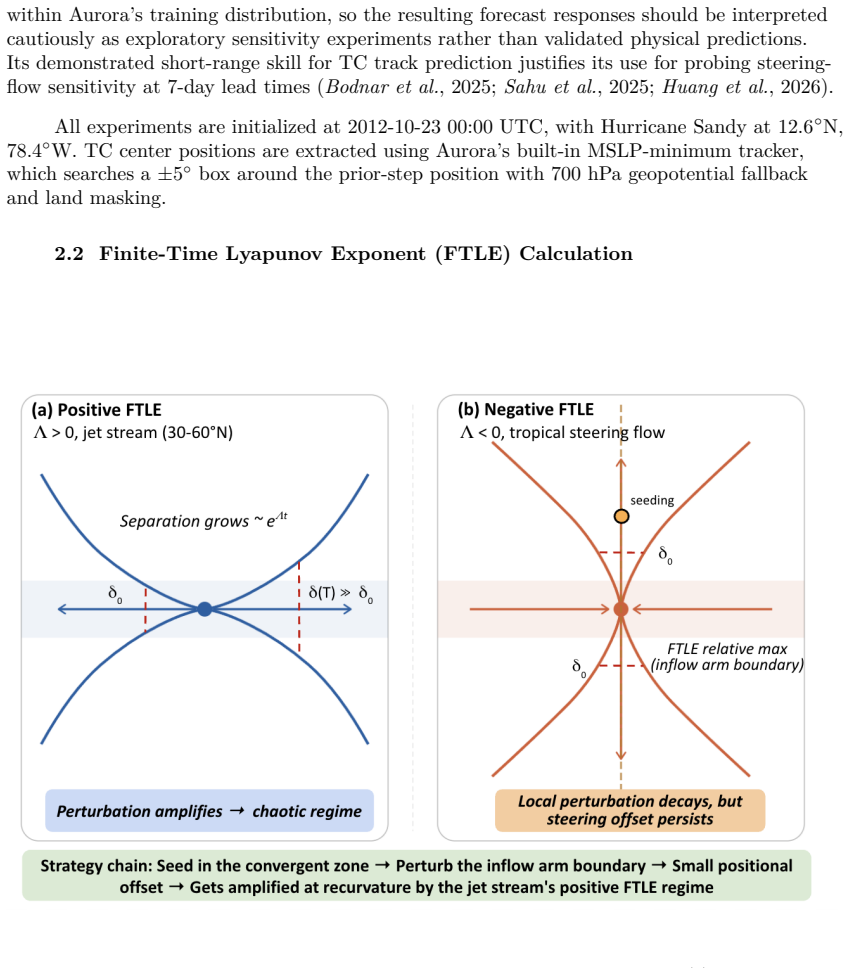
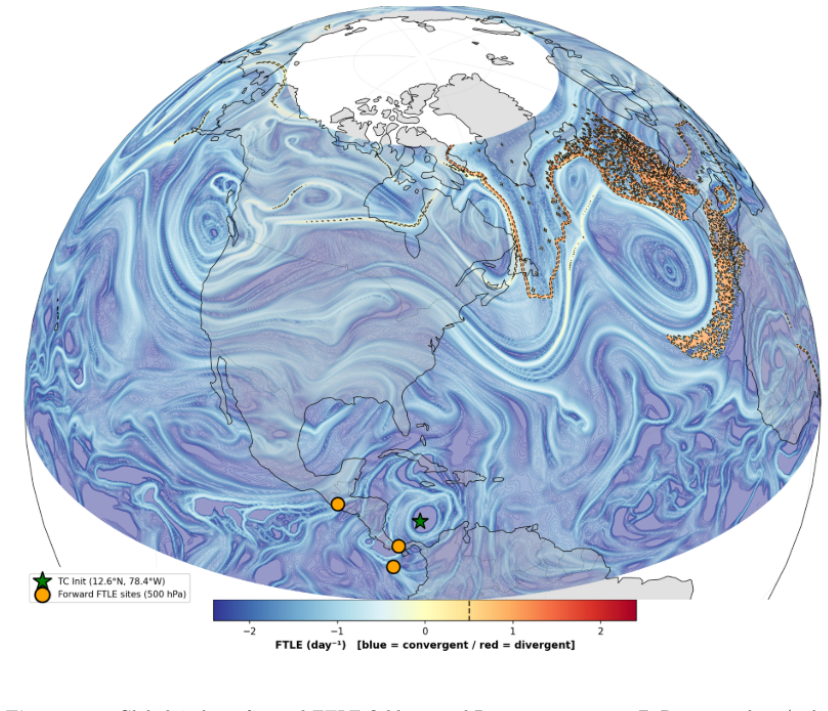
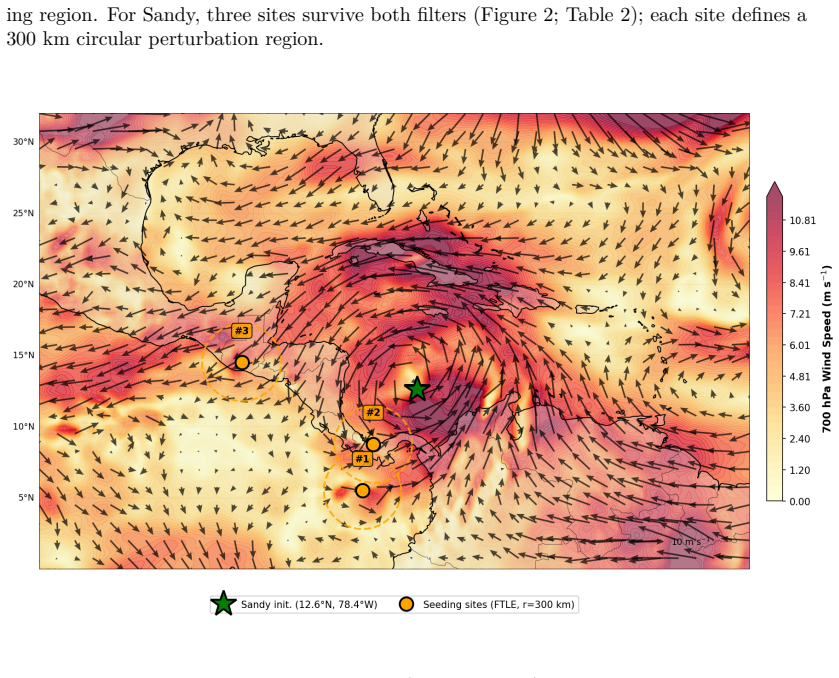
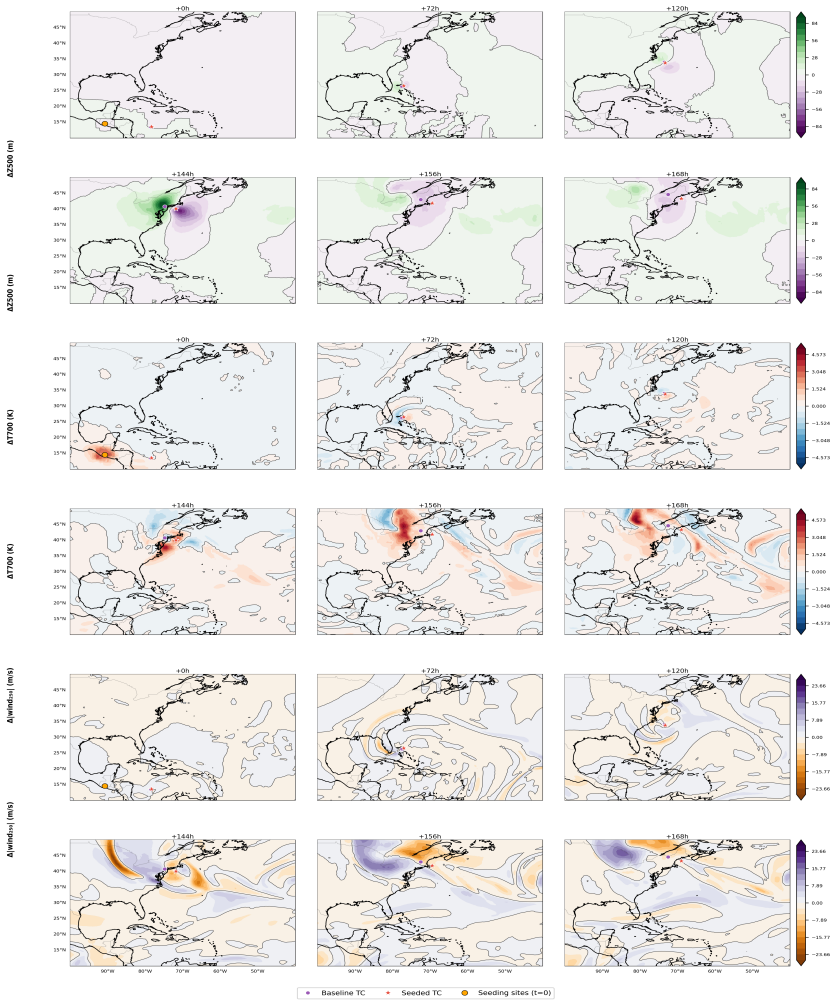
In an AI weather model, small thermodynamic perturbations placed either in Caribbean regions flagged by forward finite-time Lyapunov exponent fields or in a Pacific corridor near 165 W generate modest initial trajectory offsets that are rapidly amplified once Sandy enters its highly sensitive recurvature region; both pathways produce track deviations exceeding 500 km after seven days, providing a proof-of-concept that targeted perturbations can be amplified through atmospheric dynamics.
What carries the argument
The shared amplification mechanism in which modest early trajectory offsets grow rapidly when the cyclone reaches the sensitive recurvature region.
If this is right
- Perturbations placed according to forward finite-time Lyapunov exponent diagnostics produce substantially larger track responses than randomly placed perturbations.
- Perturbations in the Pacific corridor near 165 W reach the storm via Rossby-wave teleconnections, confirmed by Takaya-Nakamura wave-activity flux.
- Both regimes, despite different physical routes, rely on the same amplification inside the recurvature region.
- The largest experiments reach track deviations exceeding 500 km after seven days.
- The work is presented as a theoretical sensitivity analysis because the required perturbation magnitudes exceed current cloud-seeding capabilities.
Where Pith is reading between the lines
- If the model's sensitivity patterns hold in observations, targeted sampling of initial conditions in those regions could improve ensemble spread in operational forecasts.
- The same amplification logic could be tested on other recurving tropical cyclones to map how common the mechanism is across basins.
- Advances in perturbation technology would be required before the demonstrated sensitivity could translate into any practical steering capability.
Load-bearing premise
The AI weather model correctly reproduces the real atmosphere's response to the described thermodynamic perturbations and the identified sensitive regions and wave teleconnections.
What would settle it
Running the identical perturbations inside a conventional high-resolution physics-based forecast model and checking whether the resulting track deviations match those found in the AI model.
Figures
read the original abstract
Tropical cyclone (TC) trajectories are governed by large-scale steering flows and exhibit sensitive dependence on atmospheric initial conditions. Using Hurricane Sandy (2012) in the Aurora AI weather model, we investigate whether targeted thermodynamic perturbations can induce meaningful track deviations. Two distinct perturbation regimes emerge. In the Caribbean, forward finite-time Lyapunov exponent (FTLE) diagnostics identify dynamically sensitive regions within Sandy's steering flow, where perturbations produce substantially larger responses than random placement. In the Pacific, a preferred corridor near 165W influences Sandy through Rossby wave teleconnections, confirmed using Takaya-Nakamura wave activity flux diagnostics. Despite their different physical pathways, both regimes share a common amplification mechanism: small initial perturbations generate modest trajectory offsets that are rapidly amplified when Sandy enters the highly sensitive recurvature region. The largest experiments produce track deviations exceeding 500 km after seven days. These results provide a proof-of-concept demonstration of the Weather Jiu-Jitsu framework, illustrating how targeted perturbations can be amplified through atmospheric dynamics in an AI weather model. Because the required perturbations exceed current operational cloud-seeding capabilities, the experiments should be interpreted as a theoretical sensitivity analysis rather than an operational weather modification strategy.
Editorial analysis
A structured set of objections, weighed in public.
Referee Report
Summary. The paper claims that in the Aurora AI weather model, small targeted thermodynamic perturbations applied to Hurricane Sandy (2012) can produce track deviations exceeding 500 km after seven days. Two regimes are identified: FTLE-diagnosed sensitive regions in the Caribbean that amplify responses, and a Pacific corridor near 165W that acts via Rossby-wave teleconnections (diagnosed with Takaya-Nakamura flux). Both pathways converge on amplification once Sandy reaches the recurvature region. The work is explicitly framed as a proof-of-concept demonstration of the Weather Jiu-Jitsu framework inside the AI model and as a theoretical sensitivity analysis, not an operational weather-modification claim.
Significance. If the reported model-internal behaviors hold, the study provides a concrete illustration of how modest initial thermodynamic perturbations can be dynamically amplified through identified sensitive regions and teleconnection pathways. The explicit disclaimer of operational relevance and the focus on forward-model experiments rather than fitted parameters or self-referential claims allow the central result to stand as an internal statement about Aurora's dynamics. This contributes a reproducible example of sensitivity analysis in an AI weather model, which may be useful for future theoretical work on TC steering even if direct real-atmosphere extrapolation is not asserted.
major comments (1)
- [Abstract and §4] Abstract and §4 (results): the quantitative claim that 'the largest experiments produce track deviations exceeding 500 km after seven days' is presented without reported ensemble spread, error bars, or the precise perturbation amplitudes used; because this number is the headline metric for the amplification mechanism, the absence of these details makes it impossible to judge whether the offset is robust or an outlier within the model.
minor comments (3)
- [Methods] Methods: the precise thermodynamic perturbation fields (vertical structure, horizontal scale, magnitude in K or g/kg) are not fully specified; adding a table or equation with these values would allow readers to reproduce the experiments.
- [Figures] Figure captions: several panels lack explicit labels for the control run versus perturbed members and do not indicate the integration length shown; this reduces clarity when comparing the two regimes.
- [Discussion] Discussion: the paper correctly disclaims operational relevance, but a short paragraph contrasting the required perturbation sizes with known cloud-seeding limits would strengthen the framing without altering the central claim.
Simulated Author's Rebuttal
We thank the referee for the constructive comment and the recommendation of minor revision. We will revise the manuscript to address the concern about the headline quantitative claim.
read point-by-point responses
-
Referee: [Abstract and §4] Abstract and §4 (results): the quantitative claim that 'the largest experiments produce track deviations exceeding 500 km after seven days' is presented without reported ensemble spread, error bars, or the precise perturbation amplitudes used; because this number is the headline metric for the amplification mechanism, the absence of these details makes it impossible to judge whether the offset is robust or an outlier within the model.
Authors: We agree that the manuscript would benefit from explicit reporting of the perturbation amplitudes and clarification of the experimental design. In the revised version we will state the precise thermodynamic perturbation magnitudes applied in each regime (temperature and moisture increments within the identified sensitive regions) and note that the 500 km figure is the maximum track deviation observed across the targeted deterministic forward integrations. We will also add a sentence clarifying that no ensemble spread or error bars are reported because the experiments consist of single deterministic runs intended to illustrate the amplification mechanism rather than to provide statistical robustness estimates. These additions will allow readers to assess the scale of the perturbations relative to the reported response. revision: yes
Circularity Check
No significant circularity; results from forward model experiments
full rationale
The paper's derivation chain consists of forward simulations inside the Aurora AI weather model, applying FTLE diagnostics to identify sensitive regions and Takaya-Nakamura flux to confirm teleconnections, then measuring track deviations from initial perturbations. These steps are not reduced by the paper's own equations to fitted inputs or prior self-citations; the central claim is an internal statement about model behavior under the described perturbations, explicitly framed as a theoretical sensitivity analysis rather than a derivation that collapses to its own assumptions. No load-bearing step equates a prediction to a fit or renames a known result via self-citation.
Axiom & Free-Parameter Ledger
axioms (2)
- domain assumption The Aurora AI weather model faithfully represents atmospheric dynamics for perturbation experiments on Hurricane Sandy.
- standard math Forward FTLE fields correctly locate dynamically sensitive regions within the steering flow.
Reference graph
Works this paper leans on
-
[1]
Bi, K., L. Xie, H. Zhang, X. Chen, X. Gu, and Q. Tian (2023), Accurate medium- range global weather forecasting with 3D neural networks,Nature,619, 533–538, doi:10.1038/s41586-023-06185-3
-
[2]
Blake, E. S., T. B. Kimberlain, R. J. Berg, J. P. Cangialosi, and J. L. Beven II (2013), Tropical cyclone report: Hurricane sandy (AL182012), 22–29 october 2012,Tech. rep., –19– National Hurricane Center, NOAA/NWS
2013
-
[3]
Bodnar, C., W. P. Bruinsma, A. Lucic, R. Keisler, A. Mandhane, K. Lenc, P. Mirowski, S. Mohamed, P. Battaglia, and et al. (2025), A foundation model for the Earth system, Nature,641, 1180–1187, doi:10.1038/s41586-025-09005-y
-
[4]
Cooper, W. A., R. T. Bruintjes, and G. K. Mather (1997), Calculations pertaining to hygroscopic seeding with flares,Journal of Applied Meteorology and Climatology,36, 1449–1469, doi:10.1175/1520-0450(1997)036⟨1449:CPTHSW⟩2.0.CO;2. European Centre for Medium-Range Weather Forecasts (2019), ERA5 reanalysis (ECMWF reanalysis v5)
-
[5]
Galarneau, T. J., C. A. Davis, and M. A. Shapiro (2013), Intensification of hurricane sandy (2012) through extratropical warm core seclusion,Monthly Weather Review,141, 4296–4321, doi:10.1175/MWR-D-13-00181.1
-
[6]
Garaboa-Paz, D., J. Ni˜ nez-Salgado, F. Huhn, and V. P´ erez-Mu˜ nuzuri (2015), La- grangian coherent structures along atmospheric rivers,Chaos,25, 063,105, doi: 10.1063/1.4919768
-
[7]
George, J. E., and W. M. Gray (1976), Tropical cyclone motion and surround- ing parameter relationships,Journal of Applied Meteorology,15, 1252–1264, doi: 10.1175/1520-0450(1976)015⟨1252:TCMASP⟩2.0.CO;2
-
[8]
Hakim, G. J., and A. Agrawal (2026), Gray swan factory: Making extreme events from ordinary cyclones, doi:10.48550/arXiv.2604.00348
-
[9]
Haller, G. (2015), Lagrangian coherent structures,Annual Review of Fluid Mechanics,47, 137–162, doi:10.1146/annurev-fluid-010313-141322
-
[10]
Haller, G., and G. Yuan (2000), Lagrangian coherent structures and mixing in two- dimensional turbulence,Physica D: Nonlinear Phenomena,147, 352–370, doi: 10.1016/S0167-2789(00)00142-1
-
[11]
Huang, Q., M. Liu, and U. Lall (2025), Weather Jiu-Jitsu: Climate adaptation for the 21st century, doi:10.48550/arXiv.2508.09376
-
[12]
Huang, Q., M. Liu, Y. Kwon, and U. Lall (2026), Evaluating the predictability of selected weather extremes with aurora, an AI weather forecast model, doi: 10.48550/arXiv.2603.06516
-
[13]
Knapp, K. R., M. C. Kruk, D. H. Levinson, H. J. Diamond, and C. J. Neumann (2010), The international best track archive for climate stewardship (IBTrACS),Bulletin of the American Meteorological Society,91, 363–376, doi:10.1175/2009BAMS2755.1. kwon, Y. (2025), Hurricane perturbation with aurora, presentation slides and Google Colab code, unpublished
-
[14]
Learning skillful medium-range global weather forecasting
Lam, R., A. Sanchez-Gonzalez, M. Willson, P. Wirnsberger, M. Fortunato, F. Alet, S. Ravuri, T. Ewalds, Z. Eaton-Rosen, W. Hu, A. Merose, S. Hoyer, G. Holland, O. Vinyals, J. Stott, A. Pritzel, S. Mohamed, and P. Battaglia (2023), Learning skillful medium-range global weather forecasting,Science,382, 1416–1421, doi: 10.1126/science.adi2336
-
[15]
Liu, M., Q. Huang, and U. Lall (2025a), Targeted adaptive chaos control of regimes and eddy strength in two Lorenz models,EGUsphere, doi:10.5194/egusphere-2025-3997, preprint: egusphere-2025-3997
-
[16]
Liu, M., Q. Huang, and U. Lall (2025b), Regime identification and control of ex- tremes in the non-autonomous Lorenz model with chaos and intransitivity, doi: 10.48550/arXiv.2510.26005
-
[17]
Instability-Aware Steering of an Extreme Atmospheric River in an AI Weather Foundation Model
Liu, M., Q. Huang, and U. Lall (2026), Instability-aware perturbation of atmospheric rivers using a deep learning weather forecast model, doi:10.48550/arXiv.2604.18906. –20–
work page internal anchor Pith review Pith/arXiv arXiv doi:10.48550/arxiv.2604.18906 2026
-
[18]
Lorenz, E. N. (1963), Deterministic nonperiodic flow,Journal of Atmospheric Sciences, 20, 130–141, doi:10.1175/1520-0469(1963)020⟨0130:DNF⟩2.0.CO;2
-
[19]
Lorenz, E. N. (1969), The predictability of a flow which possesses many scales of motion, Tellus,21, 289–307, doi:10.3402/tellusa.v21i3.10086
-
[20]
Peng, Y., Y. Zhang, Q. Huang, C. Ye, and J. Yang (2026), A simulation methodology testbed for typhoon sensitivity analysis: Framework development and perturbation- response experiments with the Pangu weather model, doi:10.48550/arXiv.2605.21864
work page internal anchor Pith review Pith/arXiv arXiv doi:10.48550/arxiv.2605.21864 2026
-
[21]
Price, I., A. Sanchez-Gonzalez, F. Alet, S. Ravuri, T. Ewalds, Z. Eaton-Rosen, W. Hu, A. Merose, S. Hoyer, G. Holland, O. Vinyals, J. Stott, A. Pritzel, S. Mohamed, and P. Battaglia (2025), Probabilistic weather forecasting with machine learning,Nature, 637, 84–90, doi:10.1038/s41586-024-08252-9
-
[22]
Sahu, P. L., S. Sandeep, and H. Kodamana (2025), Evaluating global machine learn- ing models for tropical cyclone dynamics and thermodynamics,Journal of Geo- physical Research: Machine Learning and Computation,2, e2025JH000,594, doi: 10.1029/2025JH000594
-
[23]
Sawada, Y., M. Minamide, Y. Yan, K. Hashimoto, and L. Duc (2026), Data-driven exploration of tropical cyclone’s controllability,Geophysical Research Letters,53, e2025GL120,393, doi:10.1029/2025GL120393
-
[24]
Shadden, S. C., F. Lekien, and J. E. Marsden (2005), Definition and properties of La- grangian coherent structures from finite-time Lyapunov exponents in two-dimensional aperiodic flows,Physica D,212, 271–304, doi:10.1016/j.physd.2005.10.007
-
[25]
Willoughby, H. E., D. P. Jorgensen, R. A. Black, and S. L. Rosenthal (1985), Project STORMFURY: A scientific chronicle 1962–1983,Bulletin of the American Meteorologi- cal Society,66, 505–514, doi:10.1175/1520-0477(1985)066⟨0505:PSASC⟩2.0.CO;2. World Meteorological Organization (2018), Guidelines on the quality and application of weather modification,Tech....
-
[26]
Zhou, L., R.-H. Zhang, and L. Tao (2026), AI-enabled conditional nonlinear optimal per- turbation enhances ensemble prediction of extreme El Ni˜ no events,npj Climate and Atmospheric Science,9, 30, doi:10.1038/s41612-025-01303-6. –21–
discussion (0)
Sign in with ORCID, Apple, or X to comment. Anyone can read and Pith papers without signing in.