A Novel Computer Vision Approach for Assessing Fish Responses to Intrusive Objects in Aquaculture
Pith reviewed 2026-06-28 23:42 UTC · model grok-4.3
The pith
A computer vision pipeline tracks fish caudal fins in sea cages to measure responses to intrusive objects.
A machine-rendered reading of the paper's core claim, the machinery that carries it, and where it could break.
Core claim
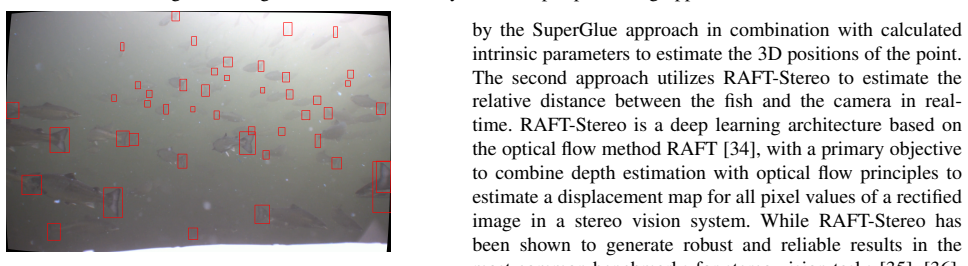
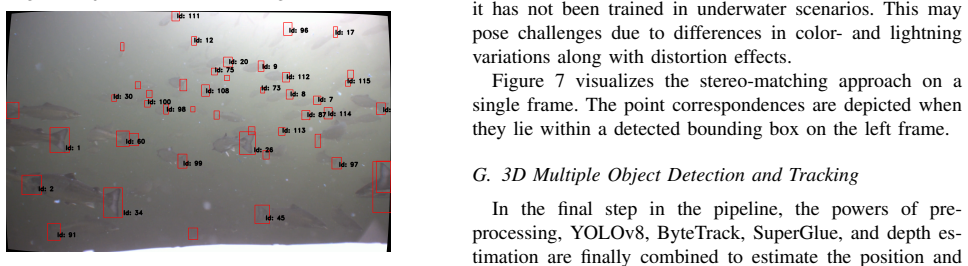
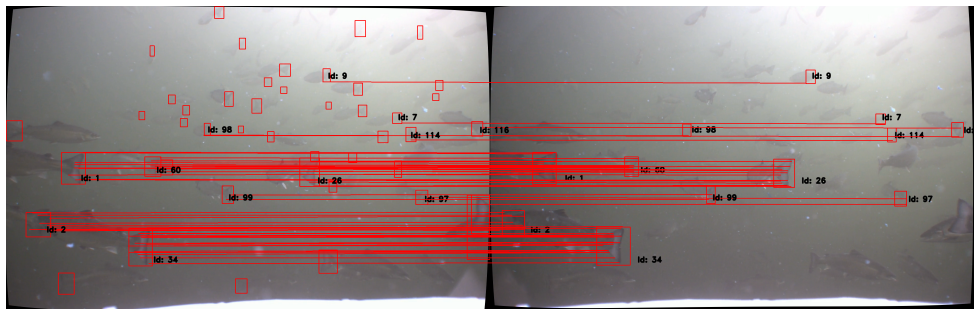
The central claim is that a caudal-fin tracking pipeline trained on manually labeled images, using YOLOv8 with ByteTrack for detection and tracking, SuperGlue for stereo matching, and triangulation for 3D reconstruction, produces usable measurements of fish kinematics on industrial-scale datasets and thereby reveals behavioral responses to intrusive objects on both individual and group levels.
What carries the argument
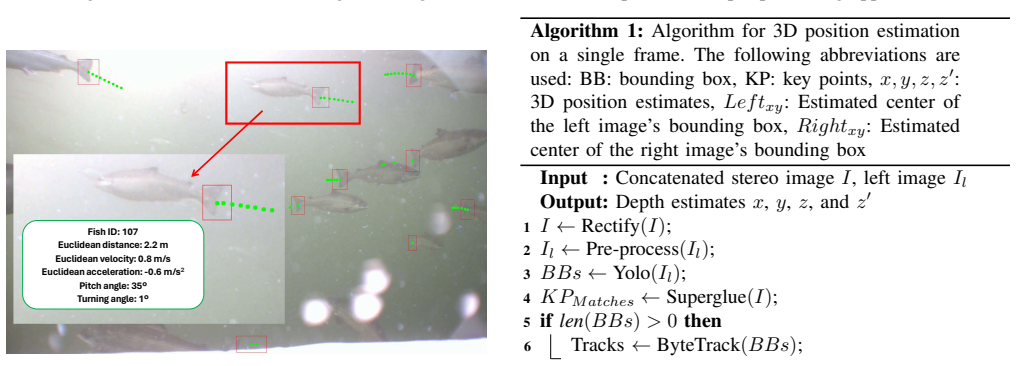
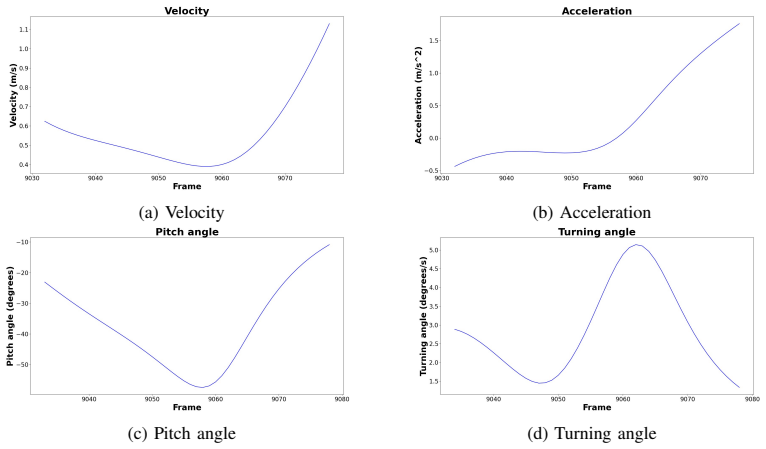
The stereo-vision pipeline that detects and tracks caudal fins then triangulates their 3D positions to obtain velocities, accelerations, and orientation angles.
If this is right
- The tracking data can quantify impacts of objects on fish behavior at both individual and group scales.
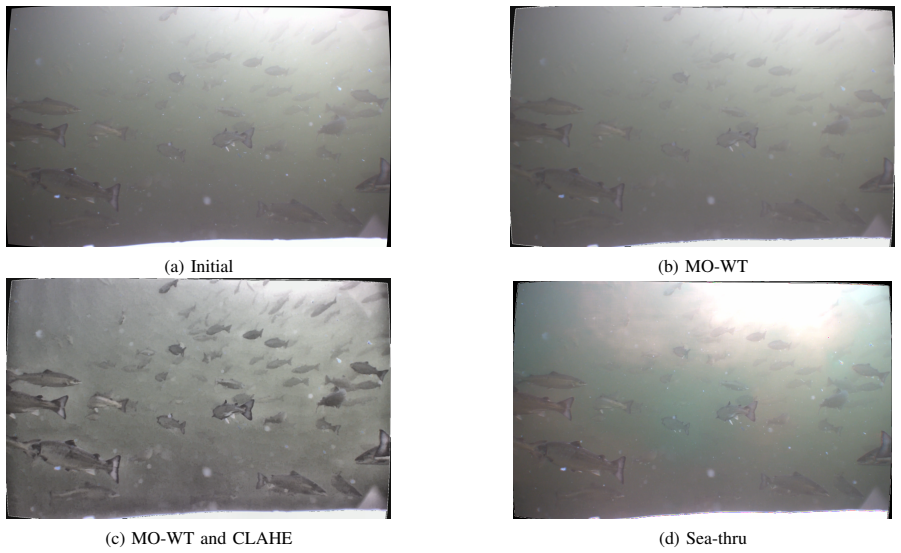
- Different image pre-processing and augmentation steps can be compared to improve detection under underwater conditions.
- The resulting kinematic measures (velocity, acceleration, turning, pitch) can be used to compare responses across object shapes, sizes, and colors.
- Performance matches or exceeds prior methods while adding 3D reconstruction suited to sea-cage environments.
Where Pith is reading between the lines
- The 3D trajectory data could support automated alerts when fish show avoidance patterns around certain structures.
- The same caudal-fin approach might be extended to track responses to other variables such as feeding or water flow changes.
- Longer recordings could allow statistical comparison of group-level dynamics across multiple cages.
Load-bearing premise
Manually labeled caudal-fin detections from a limited training set will continue to work accurately under the variable lighting, turbidity, and high fish densities of real industrial sea cages.
What would settle it
A clear drop in detection precision, tracking continuity, or 3D position accuracy when the trained model is run on new sea-cage video recorded under different lighting or density conditions.
Figures
read the original abstract
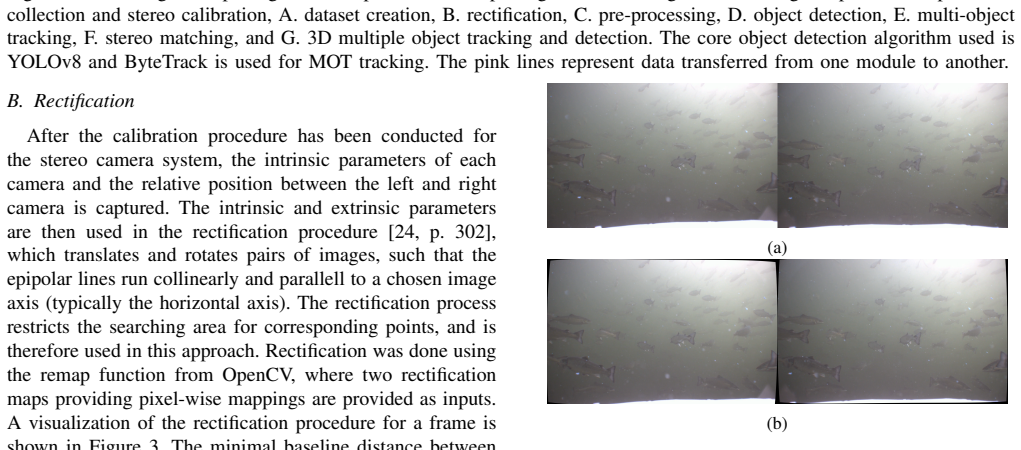
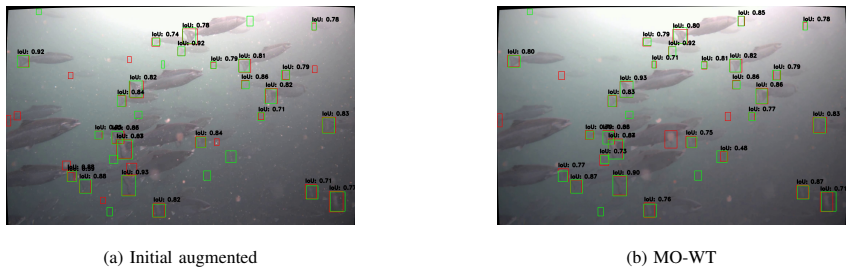
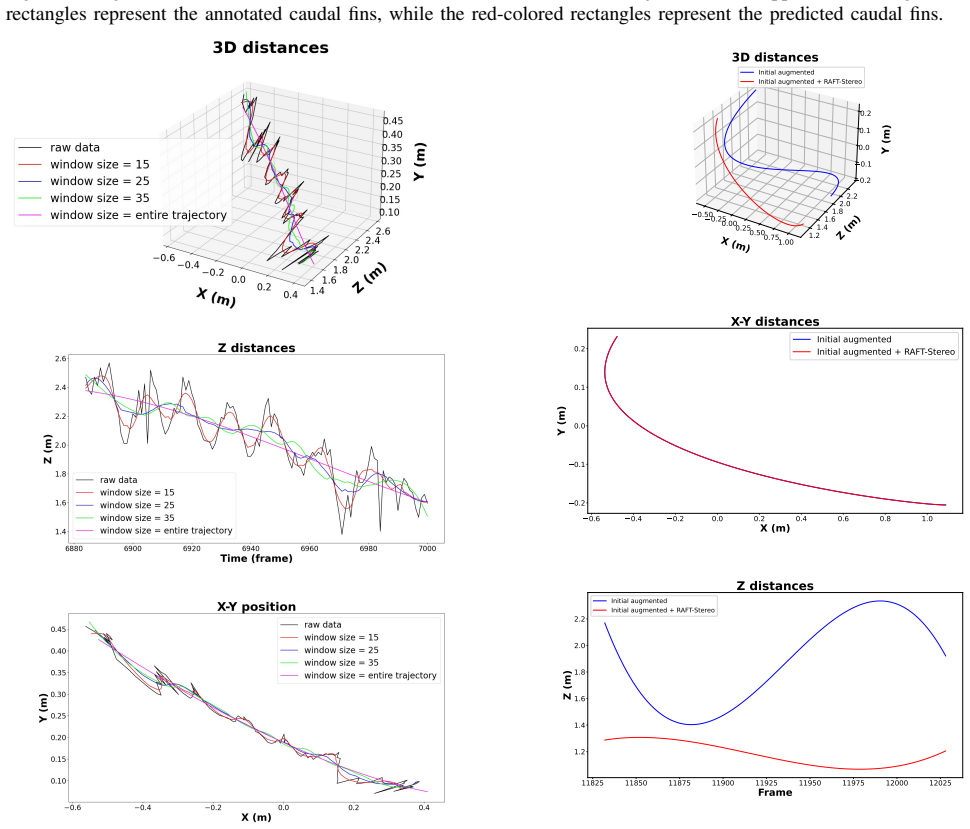
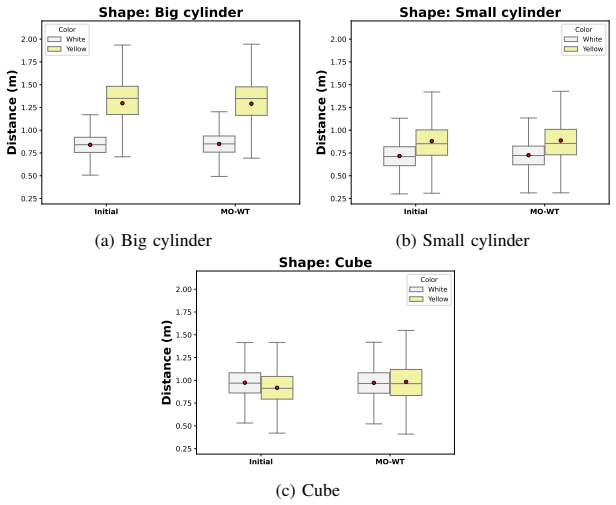
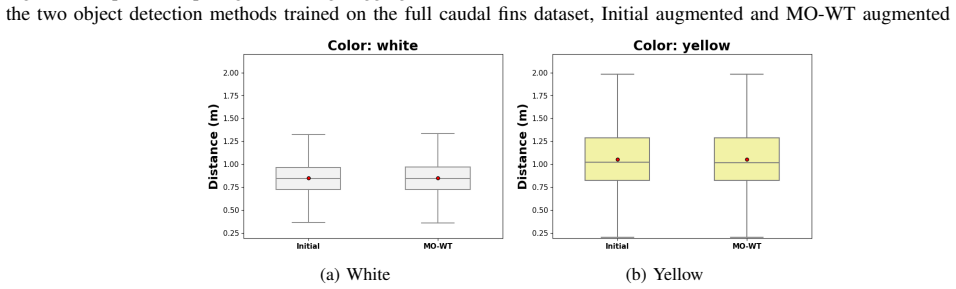
The aquaculture industry needs to address several challenges to secure sustainable seafood production that can serve an increasing global demand. One major challenge is to ensure good fish health and acceptable welfare during production since the improvement of fish welfare is of vital importance in current and future production systems. In this study, this is addressed by developing and implementing methods to identify fish behaviors in response to intrusive objects both on individual and on a group basis. A novel approach for detecting, tracking, and estimating the 3D position of individual fish has thus been developed, and specifically designed to track the caudal fins of farmed fish in industrial sea cages. The tracking data was subjected to a novel stereo-vision method adapted to estimate fish positions, velocities, accelerations, and turning and pitch angles. Datasets obtained from industrial-scale fish farms were then analyzed to identify the impact of structures of varying shapes, sizes, and colors on fish behavior. The method was trained using manually labeled caudal fins, and used YOLOv8 with ByteTrack as an object detector and tracker, SuperGlue for matching detections in the left and right frames, and triangulation to reconstruct the 3D positions of the fish. Different image pre-processing and augmentation methods for enhancing object detection accuracy were tested and their performance compared, while RAFT-Stereo was tested for depth estimation purposes. The obtained results both validate the method's performance against previous research efforts, and demonstrate the novelty and potential of this method in providing more insight into behavioral dynamics in sea-cages.
Editorial analysis
A structured set of objections, weighed in public.
Referee Report
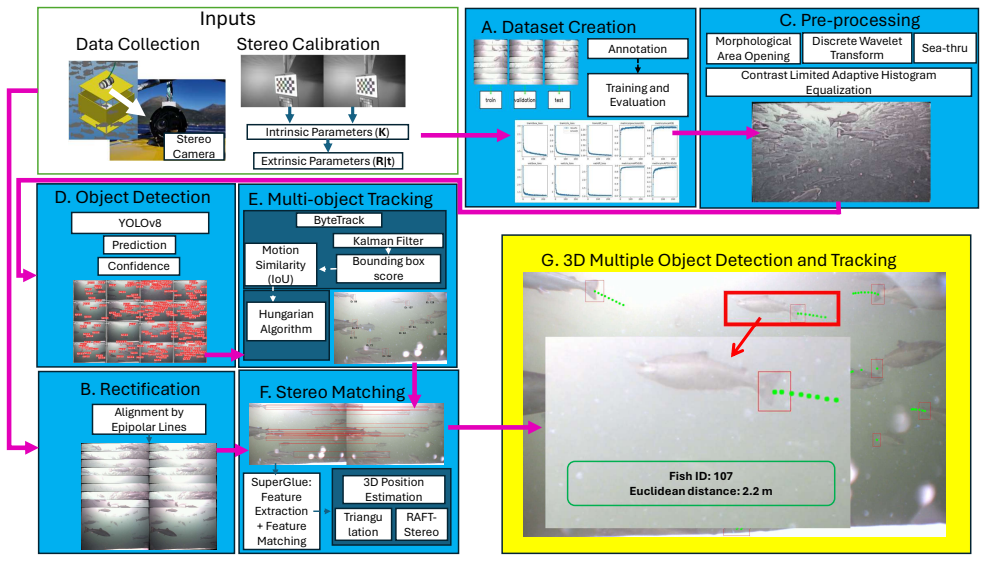
Summary. The manuscript develops a computer vision pipeline (YOLOv8 + ByteTrack for caudal-fin detection and tracking, SuperGlue for stereo matching, and triangulation for 3D reconstruction) to quantify individual and group fish responses to intrusive objects of varying shapes, sizes, and colors in industrial sea cages. It reports testing image pre-processing and augmentation strategies plus RAFT-Stereo for depth, and claims that the obtained results validate performance against prior work while demonstrating novelty for behavioral analysis.
Significance. If quantitative validation on industrial data were provided, the approach could supply a practical stereo-vision tool for non-invasive welfare monitoring in aquaculture; the use of off-the-shelf components on real sea-cage video is a pragmatic strength, but the current absence of domain-specific metrics prevents assessment of whether the claimed behavioral insights are supported.
major comments (3)
- [Abstract] Abstract: the statement that 'the obtained results both validate the method's performance against previous research efforts' supplies no quantitative metrics (mAP, MOTA, ID-switch rate, 3D triangulation error, or statistical comparisons) on the target industrial sea-cage data, rendering the central validation claim unsupported.
- [Methods] Methods (training and generalization paragraph): the pipeline is trained on 'manually labeled caudal fins' from a 'limited' set of images, yet no training-set size, validation protocol, or cross-domain performance numbers are reported for the variable lighting, turbidity, and high-density conditions of the industrial datasets; this directly undermines the weakest assumption that detection and 3D reconstruction accuracy will hold.
- [Results] Results (behavioral analysis section): no sample sizes, error bars, or statistical tests are supplied for the reported velocities, accelerations, turning/pitch angles, or group-level responses, so it is impossible to evaluate whether the claimed insights into behavioral dynamics are statistically distinguishable from noise or prior methods.
minor comments (1)
- [Abstract] The abstract and methods would benefit from explicit statements of the number of fish, video duration, and number of intrusive-object trials analyzed.
Simulated Author's Rebuttal
We thank the referee for the detailed and constructive report. We address each major comment below, indicating revisions where the manuscript requires strengthening to support its claims.
read point-by-point responses
-
Referee: [Abstract] Abstract: the statement that 'the obtained results both validate the method's performance against previous research efforts' supplies no quantitative metrics (mAP, MOTA, ID-switch rate, 3D triangulation error, or statistical comparisons) on the target industrial sea-cage data, rendering the central validation claim unsupported.
Authors: We agree that the abstract claim is not supported by quantitative metrics on the industrial sea-cage data. The manuscript provides qualitative discussion of performance relative to prior work but does not report mAP, MOTA, or 3D error numbers on the target domain. We will revise the abstract to remove the unsupported validation phrasing and focus solely on the demonstrated novelty for behavioral analysis in sea cages. revision: yes
-
Referee: [Methods] Methods (training and generalization paragraph): the pipeline is trained on 'manually labeled caudal fins' from a 'limited' set of images, yet no training-set size, validation protocol, or cross-domain performance numbers are reported for the variable lighting, turbidity, and high-density conditions of the industrial datasets; this directly undermines the weakest assumption that detection and 3D reconstruction accuracy will hold.
Authors: The manuscript describes training on manually labeled caudal fins from a limited set but indeed omits exact training-set size, split protocol, and quantitative cross-domain metrics. We will expand the methods section to report the precise training-set size, validation approach used, and any available performance numbers. However, full quantitative evaluation on the unlabeled industrial data was not performed; generalization is supported only by the qualitative results shown in the figures. revision: partial
-
Referee: [Results] Results (behavioral analysis section): no sample sizes, error bars, or statistical tests are supplied for the reported velocities, accelerations, turning/pitch angles, or group-level responses, so it is impossible to evaluate whether the claimed insights into behavioral dynamics are statistically distinguishable from noise or prior methods.
Authors: We acknowledge the absence of sample sizes, error bars, and statistical tests in the behavioral results. This prevents rigorous assessment of the reported differences. We will revise the results section to include sample sizes (number of tracked fish and frames), error bars where applicable, and appropriate statistical tests (e.g., t-tests or ANOVA with p-values) for the velocity, acceleration, and angle measurements to substantiate the behavioral claims. revision: yes
Circularity Check
No circularity: off-the-shelf CV pipeline applied to new data
full rationale
The paper applies existing detectors (YOLOv8), trackers (ByteTrack), matchers (SuperGlue), and stereo methods (RAFT-Stereo, triangulation) to manually labeled caudal-fin video from sea cages. No equations, fitted parameters, or derivations are presented that reduce any claimed result to its own inputs by construction. Validation is stated against prior external research; no self-citation chain or ansatz smuggling is load-bearing. This is the common case of an applied-methods paper whose central claims rest on empirical performance rather than self-referential definitions.
Axiom & Free-Parameter Ledger
axioms (2)
- domain assumption YOLOv8 trained on manually labeled caudal fins produces reliable detections under farm conditions
- domain assumption SuperGlue matching followed by triangulation yields accurate 3D positions from stereo frames
Reference graph
Works this paper leans on
-
[1]
National Aquaculture Sector Overview. Norway,
T. Venvik, “National Aquaculture Sector Overview. Norway,” FAO Fisheries and Aquaculture Division, 2023, accessed: 2023-12-19. [Online]. Available: https://firms.fao.org/fi/website/FIRetrieveAction. do?dom=countrysector&xml=naso norway.xml&lang=en
2023
-
[2]
Exposed aquaculture in norway,
H. V . Bjelland, M. Føre, P. Lader, D. Kristiansen, I. M. Holmen, A. Fredheim, E. I. Grøtli, D. E. Fathi, F. Oppedal, I. B. Utne, and I. Schjølberg, “Exposed aquaculture in norway,” inOCEANS 2015 - MTS/IEEE Washington, 2015, pp. 1–10
2015
-
[3]
Reducing risk in aquaculture through autonomous underwater operations,
I. B. Utne, I. Schjølberg, S. Sandøy, X. Yang, and I. M. Holmen, “Reducing risk in aquaculture through autonomous underwater operations,” 2018. [Online]. Available:{https://iapsam.org/psam14/ proceedings/paper/paper 98 1.pdf}
2018
-
[4]
Precision fish farming: A new framework to improve production in aquaculture,
M. Føre, K. Frank, T. Norton, E. Svendsen, J. A. Alfredsen, T. Demp- ster, H. Eguiraun, W. Watson, A. Stahl, L. M. Sunde, C. Schellewald, K. R. Skøien, M. O. Alver, and D. Berckmans, “Precision fish farming: A new framework to improve production in aquaculture,” 2017
2017
-
[5]
Advanced technology in aquaculture–smart feeding in marine fish farms,
M. Føre, M. O. Alver, K. Frank, and J. A. Alfredsen, “Advanced technology in aquaculture–smart feeding in marine fish farms,” in Smart Livestock Nutrition. Springer, 2023, pp. 227–268
2023
-
[6]
Planning for fish net inspection with an autonomous osv,
T. X. Lin, Q. Tao, and F. Zhang, “Planning for fish net inspection with an autonomous osv,” in2020 International Conference on System Science and Engineering (ICSSE), 2020, pp. 1–5
2020
-
[7]
Kelasidi and E
E. Kelasidi and E. Svendsen,Robotics for Sea-Based Fish Farming. Springer International Publishing, 2023, pp. 1–20
2023
-
[8]
Salmon behavioural response to robots in an aquaculture sea cage,
M. Kruusmaa, R. Gkliva, J. A. Tuhtan, A. Tuvikene, and J. A. Alfredsen, “Salmon behavioural response to robots in an aquaculture sea cage,”Royal Society Open Science, vol. 7, no. 3, p. 191220, 2020
2020
-
[9]
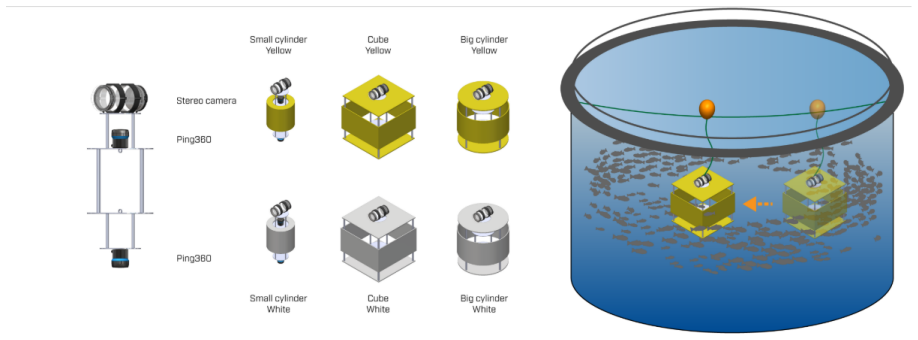
Farmed atlantic salmon (salmo salar l.) avoid intrusive objects in cages: The influence of object shape, size and colour, and fish length,
Q. Zhang, N. Bloecher, L. D. Evjemo, M. Føre, B. Su, E. Eilertsen, M. A. Mulelid, and E. Kelasidi, “Farmed atlantic salmon (salmo salar l.) avoid intrusive objects in cages: The influence of object shape, size and colour, and fish length,”Aquaculture, p. 740429, 2023
2023
-
[10]
Computer vision and robotics techniques in fish farms. robotica,
J. R. Martinez-de Dios, C. Serna , and A. Ollero, “Computer vision and robotics techniques in fish farms. robotica,”Robotica, vol. 21, pp. 233 – 243, 06 2003
2003
-
[13]
Stereoyolo + deepsort: A framework to track fish from underwater stereo camera in situ,
A. Saad, E. Kelasidi, S. Jakobsen, M. A. Mulelid, and M. S. Bondø, “Stereoyolo + deepsort: A framework to track fish from underwater stereo camera in situ,” 2023, presented at the 16th International Conference on Machine Vision. [Online]. Available: https://www.sintef.no/en/publications/publication/2175266/
-
[14]
Aqua3dnet: Real-time 3d pose estimation of livestock in aquaculture by monocular machine vision,
M. E. Koh, M. W. K. Fong, and E. Y . K. Ng, “Aqua3dnet: Real-time 3d pose estimation of livestock in aquaculture by monocular machine vision,”Aquacultural Engineering, vol. 103, p. 102367, 2023
2023
-
[15]
Motion tra- jectory estimation of salmon using stereo vision,
T. A. Nyg ˚ard, J. H. Jahren, C. Schellewald, and A. Stahl, “Motion tra- jectory estimation of salmon using stereo vision,”IFAC-PapersOnLine, vol. 55, no. 31, pp. 363–368, 2022, 14th IFAC Conference on Control Applications in Marine Systems, Robotics, and Vehicles CAMS 2022
2022
-
[16]
High-speed tracking-by- detection without using image information,
E. Bochinski, V . Eiselein, and T. Sikora, “High-speed tracking-by- detection without using image information,” in2017 14th IEEE In- ternational Conference on Advanced Video and Signal Based Surveil- lance (AVSS), 2017, pp. 1–6
2017
-
[17]
Early warning through video monitoring: Dissolved hydrogen sulphide (h2s) affects atlantic salmon swimming behavior in recirculating aquaculture systems,
E. Ciani, B. Kvæstad, M. Stormoen, I. Mayer, S. Gupta, D. Ribi ˇci´c, and R. Netzer, “Early warning through video monitoring: Dissolved hydrogen sulphide (h2s) affects atlantic salmon swimming behavior in recirculating aquaculture systems,”Aquaculture, vol. 581, p. 740201, 2024. [Online]. Available: https://www.sciencedirect.com/ science/article/pii/S0044...
2024
-
[18]
Yolov8 docs,
Ultralytics, “Yolov8 docs,” accessed on 21.08.2023. [Online]. Available: https://docs.ultralytics.com/
2023
-
[19]
Bytetrack: Multi-object tracking by associating every detection box,
Y . Zhang, P. Sun, Y . Jiang, D. Yu, F. Weng, Z. Yuan, P. Luo, W. Liu, and X. Wang, “Bytetrack: Multi-object tracking by associating every detection box,” 2022
2022
-
[20]
SuperGlue: Learning feature matching with graph neural networks,
P.-E. Sarlin, D. DeTone, T. Malisiewicz, and A. Rabinovich, “SuperGlue: Learning feature matching with graph neural networks,” inCVPR, 2020. [Online]. Available: https://arxiv.org/abs/1911.11763
-
[21]
Raft-stereo: Multilevel recurrent field transforms for stereo matching,
L. Lipson, Z. Teed, and J. Deng, “Raft-stereo: Multilevel recurrent field transforms for stereo matching,” 2021
2021
-
[22]
“Ace,” https://www.sintef.no/en/all-laboratories/ace/, accessed: 2023- 12-19
2023
-
[23]
Improving disparity map of a specific object in a stereo image using camera calibration, image rectification, and object segmentation,
H. Syahputra, A. Harjoko, and R. Pulungan, “Improving disparity map of a specific object in a stereo image using camera calibration, image rectification, and object segmentation,”International Journal of Applied Engineering Research, vol. 9, pp. 17 939–17 949, 01 2014
2014
-
[24]
Faugeras, R
O. Faugeras, R. Hartley, and A. Zisserman,Multiple View Geometry in Computer Vision, 2nd ed. Cambridge University Press, 2004. [Online]. Available: https://www.example.com/book/ multiple-view-geometry
2004
-
[25]
Introduction to wavelets and wavelet transforms: A primer,
C. S. Burrus, R. A. Gopinath, and H. Guo, “Introduction to wavelets and wavelet transforms: A primer,” 1998
1998
-
[26]
Morphological area openings and closings for grey-scale images,
L. Vincent, “Morphological area openings and closings for grey-scale images,” inShape in Picture, Y .-L. O, A. Toet, D. Foster, H. J. A. M. Heijmans, and P. Meer, Eds. Berlin, Heidelberg: Springer Berlin Heidelberg, 1994, pp. 197–208
1994
-
[27]
Viii.5. - contrast limited adaptive histogram equaliza- tion,
K. Zuiderveld, “Viii.5. - contrast limited adaptive histogram equaliza- tion,” inGraphics Gems, P. S. Heckbert, Ed. Academic Press, 1994, pp. 474–485
1994
-
[28]
Sea-thru: A method for removing water from underwater images,
D. Akkaynak and T. Treibitz, “Sea-thru: A method for removing water from underwater images,”Proceedings of the IEEE Computer Society Conference on Computer Vision and Pattern Recognition, vol. 2019- June, pp. 1682–1691, 6 2019
2019
-
[29]
“diplib,” https://github.com/DIPlib/diplib, accessed: 2023-09-05
2023
-
[30]
Implementation of sea-thru by derya akkaynak and tali treibitz,
J. Gibson, “Implementation of sea-thru by derya akkaynak and tali treibitz,” https://github.com/hainh/sea-thru, 2020, accessed: 2023-09- 05
2020
-
[31]
Superpoint: Self- supervised interest point detection and description,
D. DeTone, T. Malisiewicz, and A. Rabinovich, “Superpoint: Self- supervised interest point detection and description,” 2018
2018
-
[32]
Attention is all you need,
A. Vaswani, N. Shazeer, N. Parmar, J. Uszkoreit, L. Jones, A. N. Gomez, L. Kaiser, and I. Polosukhin, “Attention is all you need,” 2023
2023
-
[33]
The hungarian method for the assignment problem,
H. W. Kuhn, “The hungarian method for the assignment problem,” Naval Research Logistics Quarterly, vol. 2, no. 1-2, pp. 83–97, 1955
1955
-
[34]
Raft: Recurrent all-pairs field transforms for optical flow,
Z. Teed and J. Deng, “Raft: Recurrent all-pairs field transforms for optical flow,” 2020
2020
-
[35]
Joint 3d estimation of vehicles and scene flow,
M. Menze, C. Heipke, and A. Geiger, “Joint 3d estimation of vehicles and scene flow,”ISPRS Annals of Photogrammetry, Remote Sensing and Spatial Information Sciences, vol. II-3/W5, pp. 427–434, 08 2015
2015
-
[36]
High-resolution stereo datasets with subpixel-accurate ground truth,
D. Scharstein, H. Hirschm ¨uller, Y . Kitajima, G. Krathwohl, N. Neˇsi´c, X. Wang, and P. Westling, “High-resolution stereo datasets with subpixel-accurate ground truth,” vol. 8753, 09 2014, pp. 31–42
2014
-
[37]
Novel tag-based method for measuring tailbeat frequency and variations in amplitude in fish,
F. Warren-Myers, E. Svendsen, M. Føre, O. Folkedal, F. Oppedal, and M. Hvas, “Novel tag-based method for measuring tailbeat frequency and variations in amplitude in fish,”Animal Biotelemetry, vol. 11, no. 1, p. 12, 2023
2023
-
[38]
Smoothing and differentiation of data by simplified least squares procedures
A. Savitzky and M. J. E. Golay, “Smoothing and differentiation of data by simplified least squares procedures.”Analytical Chemistry, vol. 36, no. 8, pp. 1627–1639, 1964. APPENDIXI DISTANCEESTIMATES ANDFPS Shape Color Average minimum distance [m] Initial MO-WT Initial augmented MO-WT augmented Big Cylinder White 1.18 1.16 1.18 1.18 Yellow 1.66 1.53 1.74 1....
1964
discussion (0)
Sign in with ORCID, Apple, or X to comment. Anyone can read and Pith papers without signing in.