Characterising and mitigating Bluetooth and WiFi radio frequency interference at the Parkes Observatory
Pith reviewed 2026-06-28 21:16 UTC · model grok-4.3
The pith
WiFi and Bluetooth interference at Parkes is confined in time and frequency enough that mitigation can open over 90 percent of a 128 MHz band for science.
A machine-rendered reading of the paper's core claim, the machinery that carries it, and where it could break.
Core claim
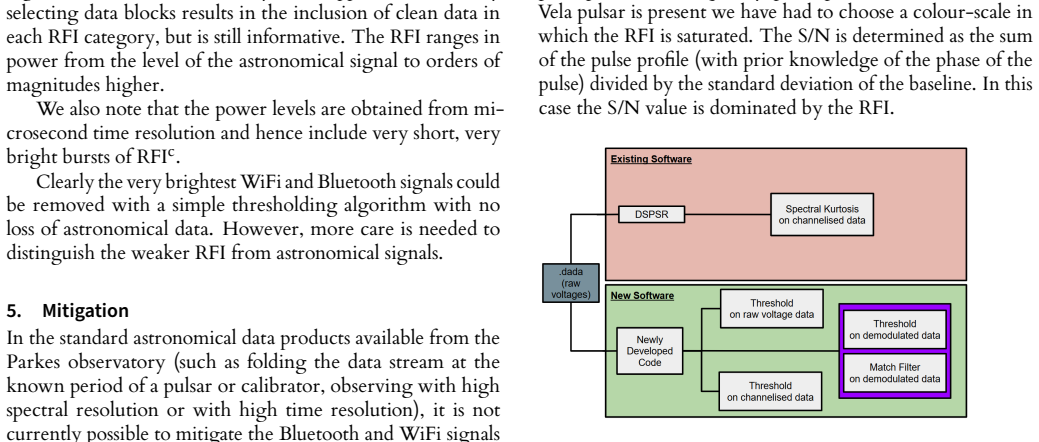
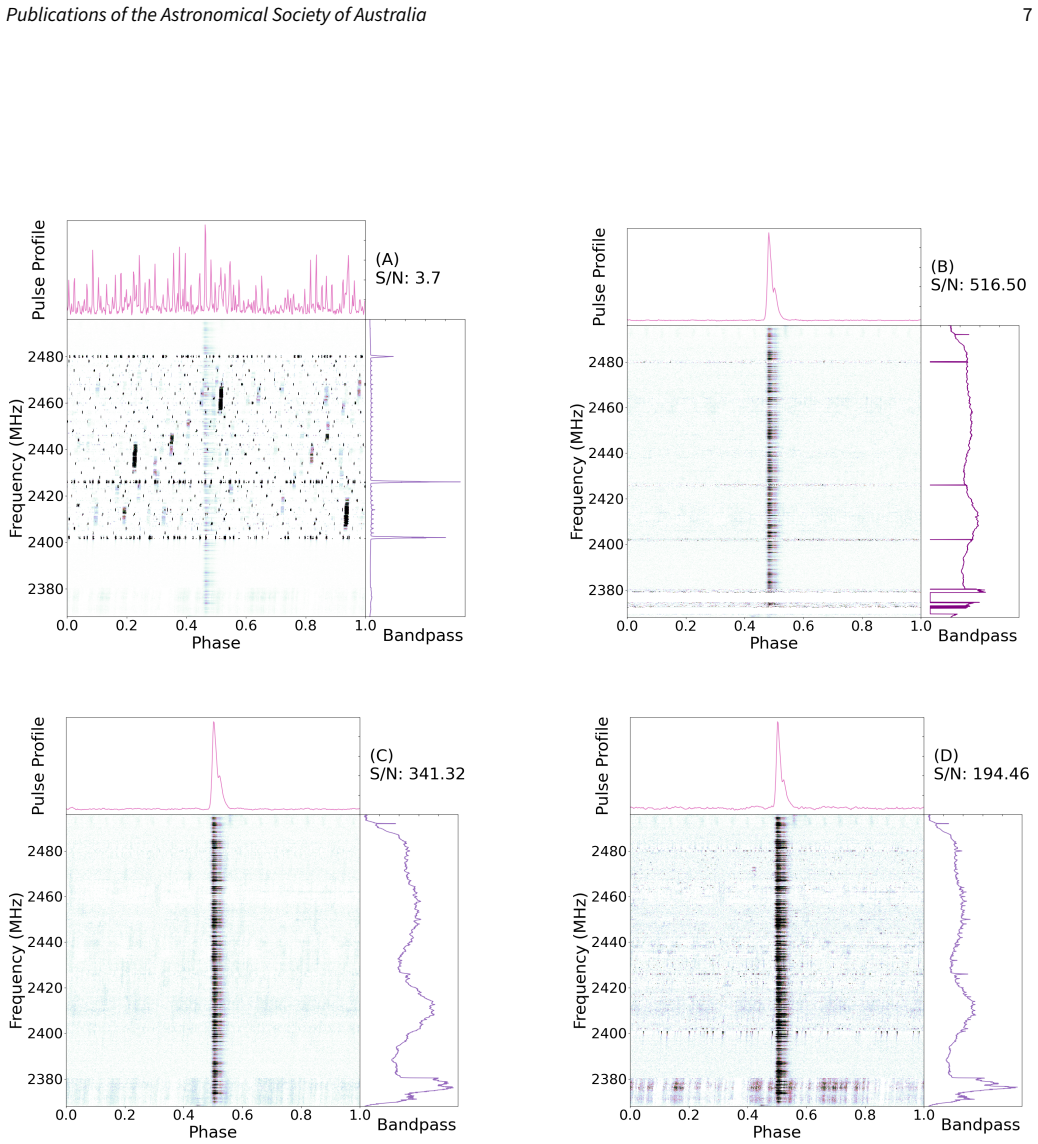
The interference is confined in both time and frequency and can be effectively mitigated. Using 10 seconds of 16-bit voltage data recorded during observations of the Vela Pulsar, the majority of the channelised data remain unaffected by RFI. All three compared algorithms perform effectively, and a basic power-threshold approach offers a relatively straightforward solution that could be implemented in real time.
What carries the argument
Power-threshold RFI detection applied to channelised voltage data, compared against two other algorithms for performance on time- and frequency-limited interference.
If this is right
- The 128 MHz observing band shifts from almost 70 percent completely unusable to over 90 percent accessible for science.
- Real-time implementation of any of the three algorithms allows productive use of the band during observations.
- Interference intensity and directionality vary with time of day yet remain confined enough for mitigation.
- A simple power-threshold method suffices without requiring complex processing.
Where Pith is reading between the lines
- The same voltage-data approach could be tested on other frequency bands or telescopes facing consumer wireless interference.
- Longer-term logging of RFI patterns might track how changes in nearby device usage affect observatories over years.
- Combining the threshold method with existing data pipelines could reduce the need to schedule around the 2.4 GHz band.
Load-bearing premise
The 10 seconds of voltage data from Vela Pulsar observations represent RFI behavior across all observing conditions and that the mitigation steps remove only interference without distorting genuine astronomical signals.
What would settle it
If mitigation on a larger set of observations removes or distorts known pulsar signals or other astronomical features, or if RFI occupies substantially more of the band under different conditions, the claim of effective mitigation would not hold.
Figures

read the original abstract
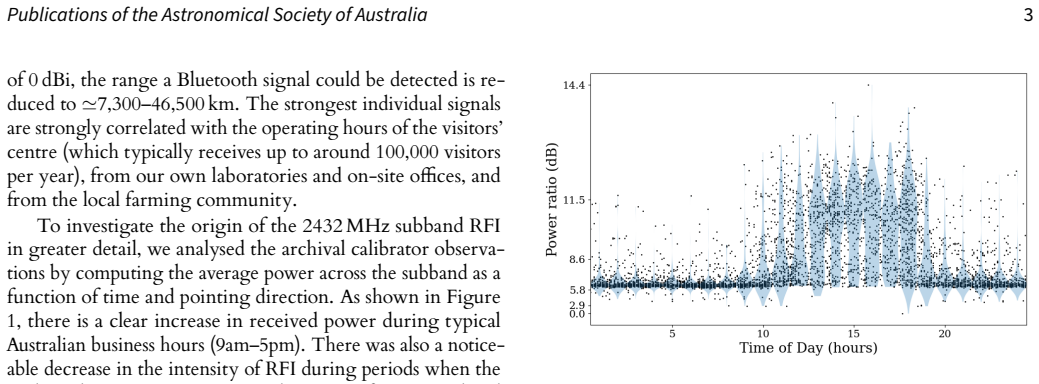
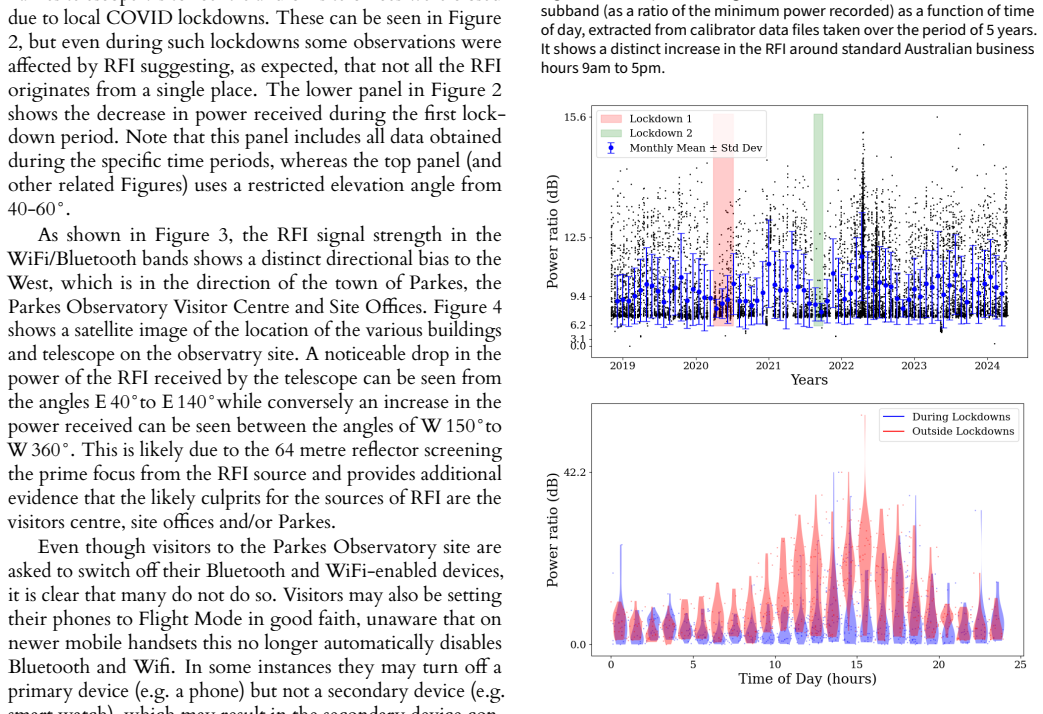
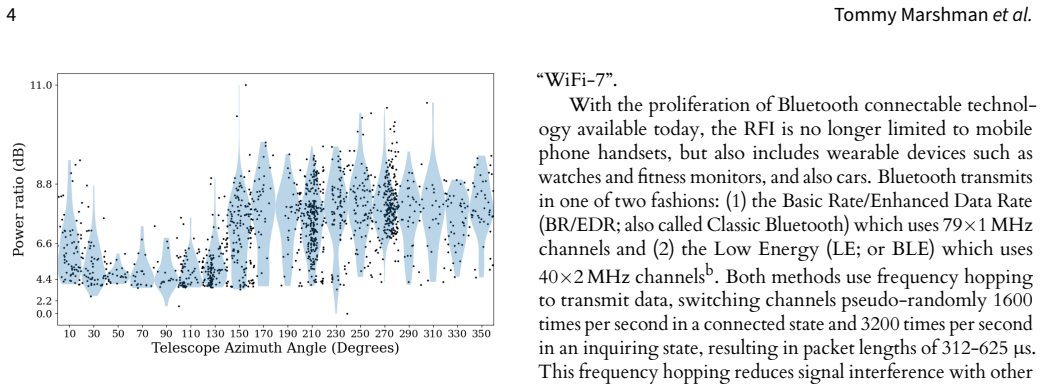
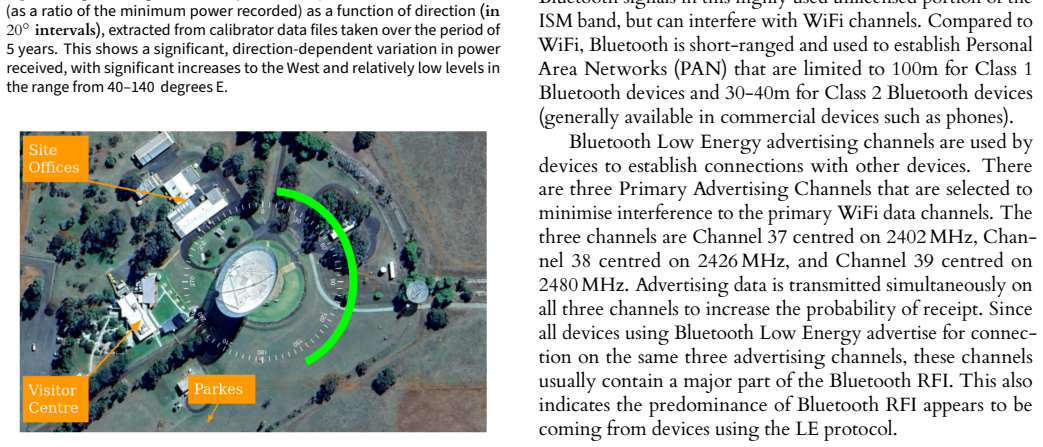
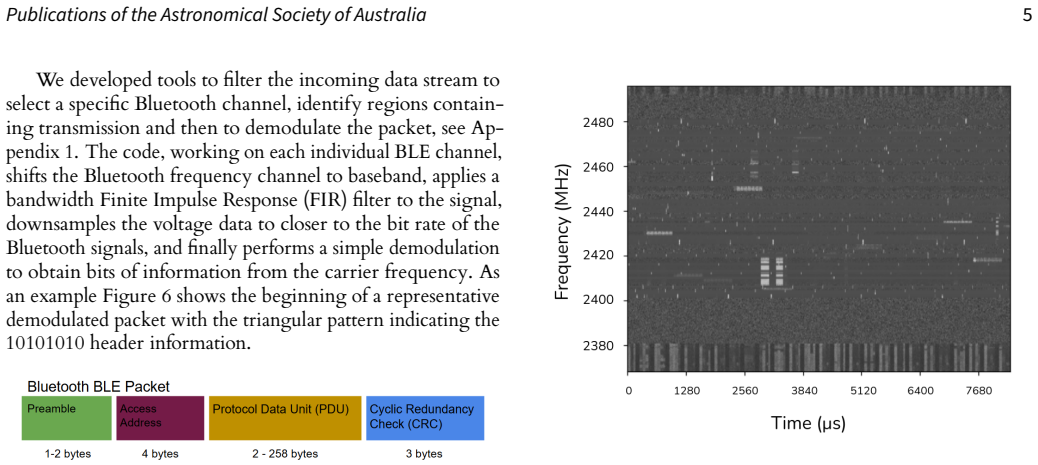
We present a detailed characterisation of radio frequency interference (RFI) in the 2.4 GHz band around Murriyang, CSIRO's Parkes radio telescope. The dominant sources of interference are Wi-Fi and Bluetooth transmissions. We quantify how the intensity and directionality of this RFI vary with time of day and document its evolution over several years. Although most observers currently discard data within this band, our analysis shows that the interference is confined in both timeand frequency and can be effectively mitigated. Using 10 seconds of 16-bit voltage data recorded during observations of the Vela Pulsar (PSR J0835-4510), we demonstrate that the majority of the channelised data remain unaffected by RFI. We compare three RFI detection and mitigation algorithms and evaluate their relative performance. All methods perform effectively, and any could be implemented in real time to enable productive use of this observing band. A real time implementation would allow the scientific use of this 128 MHz observing band to increase, from almost 70% of the band being completely unusable all of the time, to over 90% of becoming accessible for science. Given its simplicity and efficiency, a basic power-threshold approach offers a relatively straightforward solution.
Editorial analysis
A structured set of objections, weighed in public.
Referee Report
Summary. The paper characterizes RFI from Wi-Fi and Bluetooth sources in the 2.4 GHz band at Parkes Observatory (Murriyang), quantifying its intensity, directionality, and long-term evolution. It argues that the interference is localized in time and frequency and can be mitigated effectively. Using 10 seconds of 16-bit voltage data from a Vela pulsar observation, it compares three RFI detection/mitigation algorithms, reports that the majority of channelised data remain unaffected, and claims that real-time implementation would increase usable fraction of the 128 MHz band from ~70% unusable to >90% accessible, with a simple power-threshold method being sufficient.
Significance. If the mitigation efficacy and usability gain generalize beyond the tested segment, the work could enable productive use of a band currently largely discarded by observers, with straightforward real-time applicability. The multi-year characterization of RFI trends provides useful context for site monitoring.
major comments (3)
- [Abstract] Abstract and § (results on Vela data): The central claim that real-time mitigation raises accessible band fraction from ~70% to >90% rests exclusively on analysis of 10 s of voltage data from a single Vela observation. No quantitative metrics (e.g., false-positive rates, recovered signal fidelity), error analysis, or tests with injected astronomical signals are reported, leaving the performance comparison and usability extrapolation weakly supported.
- [Abstract] Abstract: The statement that 'the majority of the channelised data remain unaffected' and that 'all methods perform effectively' is presented without tabulated detection statistics, ROC curves, or cross-validation against longer datasets, making it impossible to assess whether the three algorithms differ in their impact on genuine pulsar signals.
- [Abstract] The assumption that the 10 s Vela segment is representative of RFI occupancy across hour angle, elevation, and local activity levels is not tested; the paper separately quantifies longer-term trends but does not apply the mitigation algorithms to those extended datasets to confirm the 90% figure holds.
minor comments (1)
- [Abstract] Abstract contains a typographical error: 'timeand' should be 'time and'.
Simulated Author's Rebuttal
We thank the referee for their constructive and detailed comments. We address each major comment below, clarifying the scope of our analysis while proposing targeted revisions to improve the presentation of results and limitations.
read point-by-point responses
-
Referee: [Abstract] Abstract and § (results on Vela data): The central claim that real-time mitigation raises accessible band fraction from ~70% to >90% rests exclusively on analysis of 10 s of voltage data from a single Vela observation. No quantitative metrics (e.g., false-positive rates, recovered signal fidelity), error analysis, or tests with injected astronomical signals are reported, leaving the performance comparison and usability extrapolation weakly supported.
Authors: The 10 s Vela segment was selected as it contains both the pulsar signal and representative RFI whose time-frequency properties match those quantified in the multi-year monitoring. We acknowledge the absence of injected-signal tests and formal error analysis on recovered fidelity. We will revise the manuscript to add quantitative detection statistics (e.g., fraction of channels flagged per method) and an explicit discussion of the analysis limitations, including the lack of injected-signal validation. revision: partial
-
Referee: [Abstract] Abstract: The statement that 'the majority of the channelised data remain unaffected' and that 'all methods perform effectively' is presented without tabulated detection statistics, ROC curves, or cross-validation against longer datasets, making it impossible to assess whether the three algorithms differ in their impact on genuine pulsar signals.
Authors: These statements derive from direct inspection of the channelised dynamic spectra in the example dataset. We agree that tabulated statistics would allow readers to evaluate differences more rigorously. We will add a table reporting the percentage of channels affected or mitigated by each algorithm and will note that a full ROC analysis lies outside the scope of demonstrating practical usability gains. revision: yes
-
Referee: [Abstract] The assumption that the 10 s Vela segment is representative of RFI occupancy across hour angle, elevation, and local activity levels is not tested; the paper separately quantifies longer-term trends but does not apply the mitigation algorithms to those extended datasets to confirm the 90% figure holds.
Authors: The multi-year characterisation establishes that RFI intensity, directionality and spectral occupancy follow repeatable diurnal and long-term patterns; the Vela segment was recorded under typical conditions. High-time-resolution voltage data required for the mitigation algorithms exist only for this short segment. We will revise the text to state this limitation explicitly and to qualify the >90 % accessibility figure as an illustration based on the available voltage data rather than a statistically validated extrapolation. revision: no
Circularity Check
No circularity; empirical RFI analysis rests on direct voltage data inspection with no derivations or self-referential steps
full rationale
The paper performs an observational characterization of RFI using recorded 16-bit voltage data from a Vela pulsar observation, quantifies time/frequency confinement, compares three mitigation algorithms on that segment, and extrapolates usability percentages from the observed occupancy. No equations, fitted parameters renamed as predictions, self-citations invoked as uniqueness theorems, or ansatzes appear in the derivation chain. The central usability claim (70% to >90%) is a direct summary statistic from the inspected data rather than a reduction to prior inputs by construction. This is the normal non-circular outcome for an empirical instrumentation paper whose load-bearing steps are measurements, not algebraic identities.
Axiom & Free-Parameter Ledger
Reference graph
Works this paper leans on
-
[1]
2021, Australian Radiofrequency Spectrum Plan 2021 – Including general information, Tech
ACMA. 2021, Australian Radiofrequency Spectrum Plan 2021 – Including general information, Tech. rep. Anees, i. 2024, Bluetooth Blog, 15, 75 Baan, W. A. 2019, Journal of Astronomical Instrumentation, 8, 1940010 Dwyer, R. 1984, IEEE Journal of Oceanic Engineering, 9, 85 Finger, R., Curotto, F., Fuentes, R., et al. 2017, Publications of the Astronom- ical So...
-
[2]
# splits each line in the header hdr[k] = v # first part of each line in header is the key, other is the value for the dict except ValueError: pass if(printHeader == True): print(’HEADER INFO:’) for key, val in hdr.items(): print(key, ’:’, val) #Read in the raw data #Data is 16-bits complex, 2 polarisations, offset binary encoding #Alternating real/imagin...
2048
discussion (0)
Sign in with ORCID, Apple, or X to comment. Anyone can read and Pith papers without signing in.