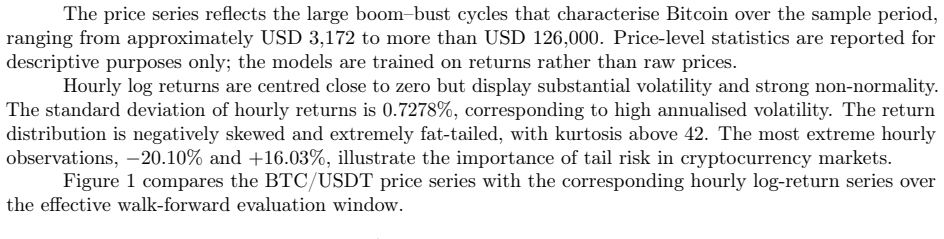
Machine Learning-Based Bitcoin Trading Under Transaction Costs: Evidence From Walk-Forward Forecasting
Pith reviewed 2026-06-30 17:37 UTC · model grok-4.3
The pith
A cost-aware execution filter turns machine learning forecasts of hourly Bitcoin returns into profitable strategies after ten basis point transaction costs.
A machine-rendered reading of the paper's core claim, the machinery that carries it, and where it could break.
Core claim
A cost-aware execution filter that prevents trades unless the absolute forecast exceeds a transaction-cost-based threshold allows selected XGBoost long-only strategies to deliver annualised returns above 65 percent with Sharpe ratios above one on hourly BTC-USDT data, whereas naive sign-based strategies lose money under the same ten-basis-point costs.
What carries the argument
The cost-aware execution filter, which skips trades when forecast magnitude falls below a threshold calibrated to transaction costs, thereby reducing turnover.
If this is right
- XGBoost produces descriptively stronger results than the tested neural networks under the same protocol.
- Technical indicators can improve performance in selected configurations while EGARCH-derived features do not deliver uniform gains.
- Loss-function choice and model-selection details have only secondary and statistically fragile effects.
- The binding limit on hourly cryptocurrency trading performance is the translation of forecasts into position changes rather than forecast accuracy alone.
Where Pith is reading between the lines
- High-frequency strategies in assets with persistent costs may benefit more from execution rules than from further gains in predictive power.
- The filter approach could be tested on other liquid cryptocurrencies or equity futures to check whether the turnover-reduction effect generalises.
- Variable or regime-dependent cost estimates might tighten or loosen the threshold and alter the reported Sharpe ratios.
Load-bearing premise
A fixed ten basis point transaction cost accurately represents real trading frictions and the chosen magnitude threshold is not overfitted to the 2018-2026 periods.
What would settle it
Re-running the identical 27-fold protocol on hourly BTC-USDT data after 2026 or with actual exchange fees plus slippage would show whether the reported returns persist.
Figures


read the original abstract
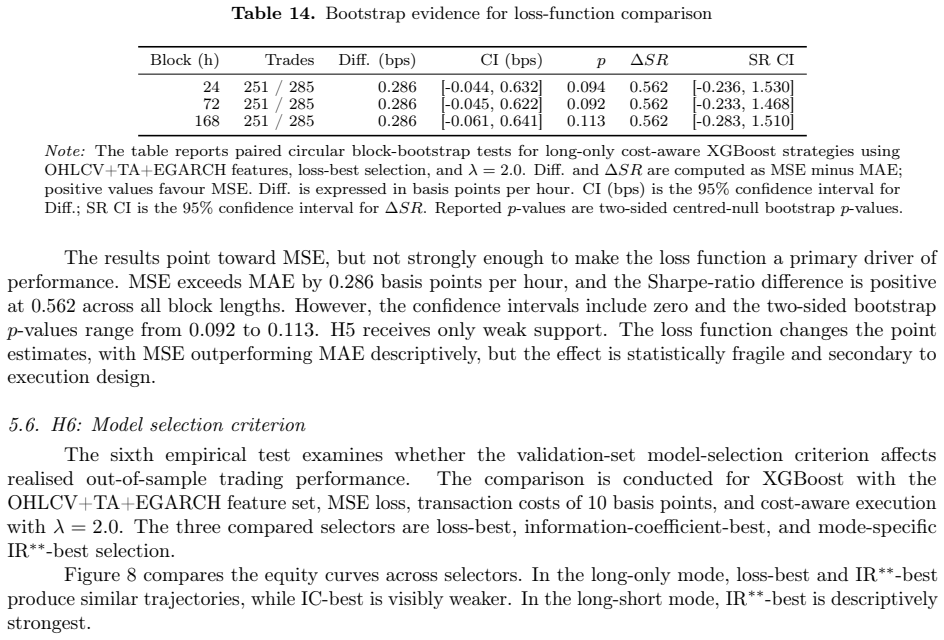
This paper investigates whether machine learning forecasts of hourly BTC-USDT returns can be converted into economically meaningful trading performance after transaction costs. Using approximately 70,000 hourly observations from 2018-2026, XGBoost, LSTM, and iTransformer are evaluated in a 27-fold walk-forward protocol. All three models produce positive gross trading performance in selected configurations, but naive sign-based strategies fail once transaction costs of ten basis points are imposed. A cost-aware execution filter, which prevents trades only when the forecast magnitude exceeds a transaction-cost-based threshold, sharply reduces turnover and restores profitability in selected configurations. The strongest long-only XGBoost strategy produces annualised returns above 65% with a Sharpe ratio above one. Additional tests show that technical indicators improve performance in selected cases, EGARCH-derived features do not provide uniformly robust gains, and XGBoost is descriptively stronger than the neural alternatives, although bootstrap evidence does not support formal statistical dominance. Loss-function and model-selection effects are secondary and statistically fragile. The results show that the main obstacle in hourly cryptocurrency trading is not only weak predictability, but also the way forecasts are converted into trades.
Editorial analysis
A structured set of objections, weighed in public.
Referee Report
Summary. The paper evaluates whether ML forecasts (XGBoost, LSTM, iTransformer) of hourly BTC-USDT returns can yield economically meaningful trading profits after 10bp transaction costs. Using ~70k observations from 2018-2026 in a 27-fold walk-forward protocol, it reports that naive sign-based rules fail under costs but a cost-aware filter (trading only when |forecast| exceeds a transaction-cost-based threshold) reduces turnover and restores profitability in selected configurations. The strongest long-only XGBoost strategy achieves >65% annualized net returns with Sharpe >1. Additional analyses examine technical indicators, EGARCH features, model comparisons, and loss functions.
Significance. If the cost-aware threshold is a fixed, a-priori function of the 10bp cost alone and not tuned to performance, the work usefully demonstrates that execution rules, not just forecast accuracy, determine economic viability in high-frequency crypto trading. The 27-fold walk-forward design and multi-model comparison are strengths that allow assessment of robustness across regimes. The reported performance levels, however, are high enough to require unusually strong evidence of out-of-sample validity.
major comments (3)
- [Abstract and results] Abstract and results section: The headline claim of >65% annualized returns and Sharpe >1 for the long-only XGBoost strategy is presented without standard errors, bootstrap intervals, or p-values against a zero-return or buy-and-hold null. Given the 27-fold protocol and the emphasis on 'selected configurations,' this omission makes it impossible to judge whether the result is statistically distinguishable from noise or data-specific luck.
- [Methods (cost-aware filter)] Methods (cost-aware filter): The threshold is described as 'transaction-cost-based' and derived from the fixed 10bp cost and forecast magnitude. The manuscript does not state whether this exact mapping is held constant across all 27 folds or whether its level (or functional form) was chosen or refined by reference to realized net performance inside the walk-forward windows. If the latter, the filter introduces an extra degree of freedom that directly undermines the out-of-sample interpretation of the net-profitability result.
- [Results (model comparison)] Results (model comparison): The statement that 'XGBoost is descriptively stronger than the neural alternatives, although bootstrap evidence does not support formal statistical dominance' is load-bearing for the model-selection conclusion, yet the bootstrap procedure, number of replications, and exact test statistic are not detailed enough to verify that the lack of dominance is not simply low power.
minor comments (2)
- [Data section] The abstract states 'approximately 70,000 hourly observations' but the exact start/end dates, handling of missing hours, and any filtering for low-liquidity periods should be stated explicitly in the data section.
- [Methods] Notation for the forecast magnitude threshold and the precise functional mapping from 10bp cost to cutoff value should be given as an equation rather than described in prose.
Simulated Author's Rebuttal
We thank the referee for the constructive comments, which help clarify the presentation of our results and methods. We address each major comment below and indicate the revisions that will be incorporated.
read point-by-point responses
-
Referee: [Abstract and results] Abstract and results section: The headline claim of >65% annualized returns and Sharpe >1 for the long-only XGBoost strategy is presented without standard errors, bootstrap intervals, or p-values against a zero-return or buy-and-hold null. Given the 27-fold protocol and the emphasis on 'selected configurations,' this omission makes it impossible to judge whether the result is statistically distinguishable from noise or data-specific luck.
Authors: We agree that the absence of uncertainty measures limits the ability to assess whether the reported performance is distinguishable from noise. In the revised manuscript we will add block-bootstrap confidence intervals (resampling the 27 walk-forward periods) for annualized net returns and Sharpe ratios of the highlighted long-only XGBoost strategy, together with one-sided p-values against a zero-return null. These will be reported both in the abstract and in the main results tables. revision: yes
-
Referee: [Methods (cost-aware filter)] Methods (cost-aware filter): The threshold is described as 'transaction-cost-based' and derived from the fixed 10bp cost and forecast magnitude. The manuscript does not state whether this exact mapping is held constant across all 27 folds or whether its level (or functional form) was chosen or refined by reference to realized net performance inside the walk-forward windows. If the latter, the filter introduces an extra degree of freedom that directly undermines the out-of-sample interpretation of the net-profitability result.
Authors: The threshold is a fixed, a-priori function of the 10 bp cost and the absolute forecast value; its functional form and level are identical in every walk-forward fold and were never adjusted on the basis of realized net performance. We will add an explicit statement to this effect in the methods section, including the precise formula used, to eliminate any ambiguity regarding data snooping. revision: yes
-
Referee: [Results (model comparison)] Results (model comparison): The statement that 'XGBoost is descriptively stronger than the neural alternatives, although bootstrap evidence does not support formal statistical dominance' is load-bearing for the model-selection conclusion, yet the bootstrap procedure, number of replications, and exact test statistic are not detailed enough to verify that the lack of dominance is not simply low power.
Authors: We accept that the bootstrap comparison requires fuller documentation. The revision will specify that we employ a block bootstrap with 1,000 replications, resampling entire walk-forward periods to preserve temporal dependence, and test the null that the difference in Sharpe ratios (or annualized returns) equals zero. We will also report the resulting p-values and note the power implications of the modest number of folds. revision: yes
Circularity Check
No significant circularity detected
full rationale
The paper applies standard walk-forward validation across 27 folds on the 2018-2026 sample and converts ML forecasts into trades via a cost-aware filter whose threshold is described as a direct function of the fixed 10 bp transaction cost and forecast magnitude. No equations or text indicate that this threshold (or any other hyperparameter) is fitted or refined against realized net performance within or across folds; the filter is presented as an a-priori economic rule rather than a data-driven prediction. No self-citations, uniqueness theorems, or ansatzes from prior author work are invoked to justify core choices. The reported >65% annualized returns and Sharpe >1 are empirical outputs of the protocol, not inputs redefined by construction. The derivation chain from forecasts to net performance is therefore self-contained against external benchmarks.
Axiom & Free-Parameter Ledger
free parameters (1)
- cost-aware threshold =
derived from 10bp
axioms (1)
- domain assumption Walk-forward validation with 27 folds yields unbiased estimates of live trading performance
Reference graph
Works this paper leans on
-
[1]
Anticipating Cryptocurrency Prices Using Machine Learning. Complexity 2018, 8983590. doi:10.1155/2018/8983590. Asness, C.S., Moskowitz, T.J., Pedersen, L.H.,
-
[2]
The Journal of Finance 68, 929–985
Value and momentum everywhere. The Journal of Finance 68, 929–985. doi:10.1111/jofi.12021. Bailey, D.H., Borwein, J.M., López de Prado, M., Zhu, Q.J.,
-
[3]
The probability of backtest overfitting.The Journal of Computational Finance, 20(4):39–69, 2017
The probability of backtest overfitting. The Journal of Computational Finance 20, 39–69. doi:10.21314/JCF.2016.322. Bieganowski, B., Ślepaczuk, R.,
- [4]
-
[5]
https://www.binance.com/en/fee/futureFee
USD-MFuturesTradingFeeRate. https://www.binance.com/en/fee/futureFee. Accessed: 2026-04-30. Campbell, J.Y., Lo, A.W., MacKinlay, A.C.,
2026
-
[6]
XGBoost: A scalable tree boosting system, in: Proceedings of the 22nd ACM SIGKDD International Conference on Knowledge Discovery and Data Mining, ACM. pp. 785–794. doi:10.1145/2939672.2939785. Cohen, G.,
-
[7]
Review of Quantitative Finance and Accounting 61, 395–409
Intraday algorithmic trading strategies for cryptocurrencies. Review of Quantitative Finance and Accounting 61, 395–409. doi:10.1007/s11156-023-01139-2. DeMiguel, V., Garlappi, L., Uppal, R.,
-
[8]
Optimal versus naive diversification: How inefficient is the 1/N portfolio strategy? The Review of Financial Studies 22, 1915–1953. doi:10.1093/rfs/hhm075. Fama, E.F.,
-
[9]
The Journal of Finance 25, 383–417
Efficient capital markets: A review of theory and empirical work. The Journal of Finance 25, 383–417. doi:10.2307/2325486. Grinsztajn, L., Oyallon, E., Varoquaux, G.,
-
[10]
Why do tree-based models still outperform deep learning on typical tabular data?, in: Advances in Neural Information Processing Systems, pp. 507–520. doi:10.48550/arXiv.2207.08815. Grudniewicz, J., Ślepaczuk, R.,
-
[11]
Experimental searches for the chiral magnetic effect in heavy-ion collisions.Prog
Application of machine learning in algorithmic investment strategies on global stock markets. Research in International Business and Finance 66, 102052. doi:10.1016/j. ribaf.2023.102052. Gu, S., Kelly, B., Xiu, D.,
work page doi:10.1016/j 2023
-
[12]
Moritz Hardt and Celestine Mendler-Dünner
Empirical asset pricing via machine learning. The Review of Financial Studies 33, 2223–2273. doi:10.1093/rfs/hhaa009. Hochreiter, S., Schmidhuber, J.,
-
[13]
Long Short-Term Memory , year =
Long short-term memory. Neural Computation 9, 1735–1780. doi:10.1162/neco.1997.9.8.1735. Jegadeesh, N., Titman, S.,
-
[14]
The Journal of Finance 48, 65–91
Returns to buying winners and selling losers: Implications for stock market efficiency. The Journal of Finance 48, 65–91. doi:10.1111/j.1540-6261.1993.tb04702.x. Kashif, K., Ślepaczuk, R.,
-
[15]
Knowledge-Based Systems 320, 113563
LSTM-ARIMA as a hybrid approach in algorithmic investment strategies. Knowledge-Based Systems 320, 113563. doi:10.1016/j.knosys.2025.113563. Kryńska, K., Ślepaczuk, R.,
-
[16]
Daily and intraday application of various architectures of the LSTM model in algorithmic investment strategies on Bitcoin and the S&P 500 index. doi:10.2139/ssrn.4628806. Künsch, H.R.,
-
[17]
The Annals of Statistics 17, 1217–1241
The Jackknife and the Bootstrap for General Stationary Observations. The Annals of Statistics 17, 1217–1241. doi:10.1214/aos/1176347265. Liaras, E., Nerantzidis, M., Alexandridis, A.,
-
[18]
Michańków, J., Sakowski, P., Ślepaczuk, R., 2024a
doi:10.3390/s22030917. Michańków, J., Sakowski, P., Ślepaczuk, R., 2024a. Generalized mean absolute directional loss as a solution to overfitting and high transaction costs in machine learning models used in high-frequency algorithmic investment strategies. doi:10.48550/arXiv.2412.18405. Michańków, J., Sakowski, P., Ślepaczuk, R., 2024b. Mean absolute dir...
-
[19]
chapter 6, pp. 328–383. doi:10.1016/B978-0-444-53683-9.00006-2. Sebastião, H., Godinho, P.,
-
[20]
doi:10.1186/s40854-020-00217-x. Stefaniuk, F., Ślepaczuk, R.,
-
[21]
Expert Systems with Applications 317, 131599
A neural network informer in algorithmic investment strategies on high- frequency bitcoin data. Expert Systems with Applications 317, 131599. doi:10.1016/j.eswa.2026.131599. 42
discussion (0)
Sign in with ORCID, Apple, or X to comment. Anyone can read and Pith papers without signing in.