Modeling Spectral Energy Shifts in Spatio-Temporal Graph Anomaly Detection
Pith reviewed 2026-06-28 23:26 UTC · model grok-4.3
The pith
A node-level spectral energy formulation detects camouflaged anomalies by capturing decreases in spectral variation.
A machine-rendered reading of the paper's core claim, the machinery that carries it, and where it could break.
Core claim
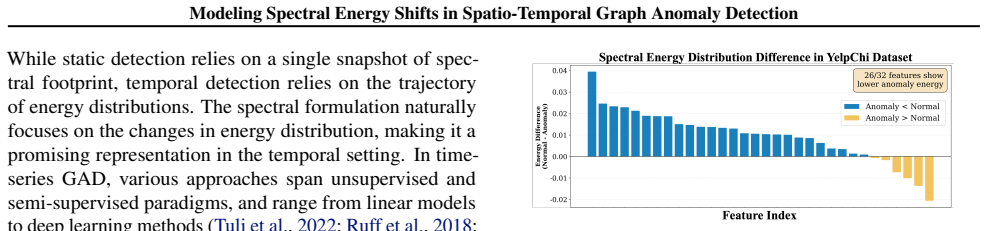
Prior graph anomaly detection methods characterize anomalies through increased variation in the spectral energy distributions but overlook those resulting in decreased variation, i.e., camouflaged anomalies that appear normal. We show that this type of anomaly persists across multiple datasets and remains undetectable by existing spectral approaches. To address this limitation, we propose a node-level spectral energy formulation that is fully compatible with message passing and enables the detection of camouflaged anomalies. Building on this formulation, we introduce an energy-aware graph learning framework that models spectral shifts through energy-driven message passing in both static and
What carries the argument
Node-level spectral energy formulation that integrates with message passing to model decreases in spectral energy variation and drive energy-aware updates in graphs.
Load-bearing premise
Camouflaged anomalies that decrease spectral energy variation persist across multiple datasets, evade existing spectral methods, and can be addressed by a node-level formulation without specialized sequence modules.
What would settle it
Applying prior spectral anomaly detection methods to the paper's benchmark datasets and observing that they identify the camouflaged anomalies at rates comparable to the proposed framework.
Figures
read the original abstract
Graph anomaly detection methods aim to distinguish anomalous nodes. While prior methods characterize anomalies through increased variation in the spectral energy distributions, they overlook those that result in decreased variation, i.e., camouflaged anomalies that appear normal. We show that this type of anomaly persists across multiple datasets and remains undetectable by existing spectral approaches. To address this limitation, we propose a node-level spectral energy formulation that is fully compatible with message passing and enables the detection of camouflaged anomalies. Building on this formulation, we introduce an energy-aware graph learning framework that models spectral shifts through energy-driven message passing in both static and time-series graphs. Besides, our unified architecture extends to temporal settings without introducing specialized sequence modules, enabling efficient learning under long sliding windows. Extensive experiments on large-scale benchmarks demonstrate the effectiveness and scalability of our approach.
Editorial analysis
A structured set of objections, weighed in public.
Referee Report
Summary. The paper claims that prior spectral graph anomaly detection methods miss camouflaged anomalies characterized by decreased variation in spectral energy distributions. It proposes a node-level spectral energy formulation that is fully compatible with message passing, enabling detection of such anomalies, and introduces an energy-aware graph learning framework that models spectral shifts via energy-driven message passing for both static and time-series graphs. The unified architecture extends to temporal settings without specialized sequence modules and is supported by experiments on large-scale benchmarks demonstrating effectiveness and scalability.
Significance. If the node-level formulation can be shown to integrate with local message passing while distinguishing decreased-variation anomalies without global Laplacian dependencies, the work would address a gap in detecting subtle, camouflaged anomalies in both static and dynamic graphs, potentially improving robustness of graph anomaly detection methods.
major comments (2)
- [Abstract] Abstract: The central claim of a 'node-level spectral energy formulation that is fully compatible with message passing' lacks any supporting derivation, equation, or definition. This leaves unresolved whether the formulation avoids reliance on global Laplacian spectrum properties, which would conflict with the locality assumption of standard message-passing layers as raised by the stress-test concern.
- [Abstract] Abstract: No equations, experimental setup, or evidence is provided to substantiate that camouflaged anomalies with decreased spectral energy variation 'persist across multiple datasets' and 'remain undetectable by existing spectral approaches,' making the motivation and novelty claims unevaluable.
Simulated Author's Rebuttal
We thank the referee for the constructive comments on the abstract. We address each point below and will revise the manuscript accordingly to improve clarity and self-containment of the claims.
read point-by-point responses
-
Referee: [Abstract] Abstract: The central claim of a 'node-level spectral energy formulation that is fully compatible with message passing' lacks any supporting derivation, equation, or definition. This leaves unresolved whether the formulation avoids reliance on global Laplacian spectrum properties, which would conflict with the locality assumption of standard message-passing layers as raised by the stress-test concern.
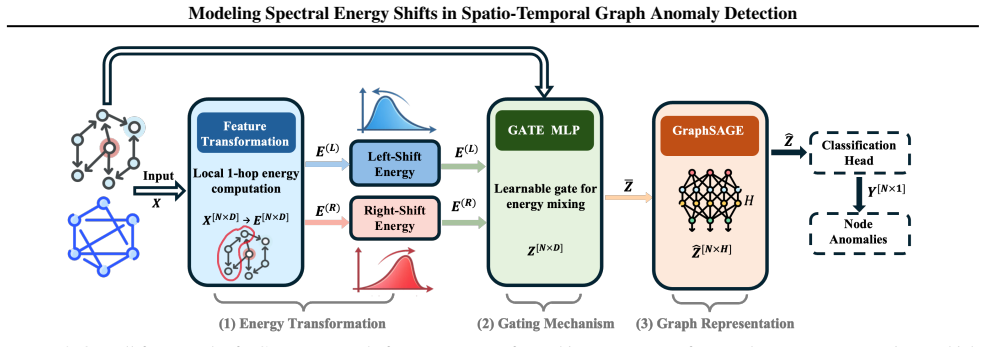
Authors: We agree that the abstract, as a concise summary, does not contain the derivation or equations. The main text (Section 3) defines the node-level spectral energy via the squared norm of the graph Fourier coefficients per node (Equation 2) and shows its equivalence to a local aggregation that can be realized through message passing without explicit global eigendecomposition. This is further detailed with the energy-driven update rule (Equation 5). We will revise the abstract to include a brief parenthetical reference to the local formulation to address the concern about compatibility with message-passing locality. revision: yes
-
Referee: [Abstract] Abstract: No equations, experimental setup, or evidence is provided to substantiate that camouflaged anomalies with decreased spectral energy variation 'persist across multiple datasets' and 'remain undetectable by existing spectral approaches,' making the motivation and novelty claims unevaluable.
Authors: The abstract summarizes the empirical observations; the supporting analysis, including the experimental setup on static and temporal benchmarks and quantitative evidence that such anomalies persist and evade prior spectral detectors, appears in Sections 4.1–4.2 and Tables 1–2. We acknowledge the abstract could better signal this evidence. We will revise the abstract to add a short clause noting the multi-dataset observation and the performance gap versus baselines. revision: yes
Circularity Check
No circularity; derivation self-contained with no visible reductions
full rationale
No equations, derivations, or self-citations appear in the abstract or described claims. The node-level spectral energy formulation is introduced as a new proposal without any quoted reduction to fitted parameters, prior self-citations, or definitional loops. Claims of compatibility with message passing and detection of camouflaged anomalies are presented as contributions to be validated externally via experiments, with no load-bearing steps that equate outputs to inputs by construction. This is the normal case of an independent proposal.
Axiom & Free-Parameter Ledger
axioms (1)
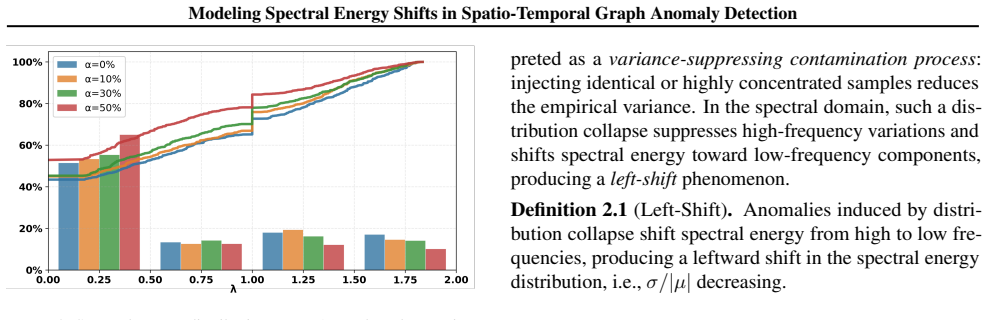
- domain assumption Camouflaged anomalies exist, persist across datasets, and are characterized by decreased variation in spectral energy distributions that existing spectral methods cannot detect.
Reference graph
Works this paper leans on
-
[1]
Can abnormality be detected by graph neural networks? InIJCAI, pp
Chai, Z., You, S., Yang, Y ., Pu, S., Xu, J., Cai, H., and Jiang, W. Can abnormality be detected by graph neural networks? InIJCAI, pp. 1945–1951,
1945
-
[2]
Deep anomaly detection on attributed networks
Ding, K., Li, J., Bhanushali, R., and Liu, H. Deep anomaly detection on attributed networks. InProceedings of the 2019 SIAM international conference on data mining, pp. 594–602. SIAM,
2019
- [3]
-
[4]
Addressing heterophily in graph anomaly detection: A perspective of graph spectrum
Gao, Y ., Wang, X., He, X., Liu, Z., Feng, H., and Zhang, Y . Addressing heterophily in graph anomaly detection: A perspective of graph spectrum. InProceedings of the ACM web conference 2023, pp. 1528–1538,
2023
-
[5]
Temporal graph benchmark for ma- chine learning on temporal graphs.Advances in Neural Information Processing Systems, 36:2056–2073,
Huang, S., Poursafaei, F., Danovitch, J., Fey, M., Hu, W., Rossi, E., Leskovec, J., Bronstein, M., Rabusseau, G., and Rabbany, R. Temporal graph benchmark for ma- chine learning on temporal graphs.Advances in Neural Information Processing Systems, 36:2056–2073,
2056
-
[6]
Semi-Supervised Classification with Graph Convolutional Networks
10 Modeling Spectral Energy Shifts in Spatio-Temporal Graph Anomaly Detection Kipf, T. Semi-supervised classification with graph con- volutional networks.arXiv preprint arXiv:1609.02907,
work page internal anchor Pith review Pith/arXiv arXiv
-
[7]
Pick and choose: a gnn-based imbalanced learning approach for fraud detection
Liu, Y ., Ao, X., Qin, Z., Chi, J., Feng, J., Yang, H., and He, Q. Pick and choose: a gnn-based imbalanced learning approach for fraud detection. InProceedings of the web conference 2021, pp. 3168–3177,
2021
-
[8]
Mathur, A. P. and Tippenhauer, N. O. Swat: A water treat- ment testbed for research and training on ics security. In 2016 international workshop on cyber-physical systems for smart water networks (CySWater), pp. 31–36. IEEE,
2016
- [9]
-
[10]
Veliˇckovi´c, P., Cucurull, G., Casanova, A., Romero, A., Lio, P., and Bengio, Y . Graph attention networks.arXiv preprint arXiv:1710.10903,
work page internal anchor Pith review Pith/arXiv arXiv
-
[11]
TimesNet: Temporal 2D-Variation Modeling for General Time Series Analysis
Wu, H., Hu, T., Liu, Y ., Zhou, H., Wang, J., and Long, M. Timesnet: Temporal 2d-variation modeling for general time series analysis.arXiv preprint arXiv:2210.02186,
work page internal anchor Pith review Pith/arXiv arXiv
-
[12]
arXiv preprint arXiv:2110.02642 (2021)
Xu, J., Wu, H., Wang, J., and Long, M. Anomaly trans- former: Time series anomaly detection with association discrepancy.arXiv preprint arXiv:2110.02642,
-
[13]
How Powerful are Graph Neural Networks?
Xu, K., Hu, W., Leskovec, J., and Jegelka, S. How powerful are graph neural networks?arXiv preprint arXiv:1810.00826,
work page internal anchor Pith review Pith/arXiv arXiv
-
[14]
11 Modeling Spectral Energy Shifts in Spatio-Temporal Graph Anomaly Detection A. Notations and Derivations In this section, we summarize the notations utilized in this paper and present the derivation of (4). A.1. Notations Table 5.Notation table. Symbol Meaning Symbol Meaning GGraphVSet of nodes ESet of edgesNThe number of nodes AAdjacency matrixDDegree ...
discussion (0)
Sign in with ORCID, Apple, or X to comment. Anyone can read and Pith papers without signing in.