Statistical Analysis of using the Shapley Value for Sensor Anomaly Localization with Accurate Classifiers
Pith reviewed 2026-06-28 17:50 UTC · model grok-4.3
The pith
For independent sensor observations the Shapley value anomaly test is exactly equivalent to a simpler single-term test with identical error probability, while the two differ and one can outperform the other in correlated bivariate cases dep
A machine-rendered reading of the paper's core claim, the machinery that carries it, and where it could break.
Core claim
We prove that for cases with independent sensor observations, an optimized anomaly test using the Shapley value is equivalent to an optimized lower-complexity anomaly test using a single term in the Shapley value calculation, yielding the exact same probability of error. For some popular dependent observation cases involving two sensors, including correlated bivariate Gaussian/Laplacian probability density functions and constant/Gaussian attacks/anomalies, we prove that these two tests are fundamentally different, yielding different decision regions and error probabilities. Further, we prove that the Shapley value test is sometimes strictly inferior to the other test in certain statistically
What carries the argument
Comparison of the full Shapley value versus a single term from its calculation inside optimal binary classifiers for deciding whether a given sensor observation is anomalous.
If this is right
- For independent observations the lower-complexity single-term test can be used in place of the Shapley-value test without any increase in error probability.
- In the examined dependent bivariate cases the two tests produce different decision regions, so their error probabilities are not the same.
- When correlation is large the relative performance of the two tests reverses with the sign of the correlation coefficient.
- A test that combines the Shapley value and the single term can achieve strictly lower error probability than either alone in the dependent bivariate setting.
Where Pith is reading between the lines
- The equivalence result may extend to other joint distributions that satisfy conditional independence, allowing the simpler test to be used more broadly.
- In networks with many sensors the computational saving from the single-term test could matter for real-time localization even when observations are only approximately independent.
- A practical system could first test for independence among sensors and then select or combine the two methods accordingly.
Load-bearing premise
The existence of mathematically defined optimum binary classifiers together with the assumption that sensor observations follow either independence or the specific correlated bivariate Gaussian and Laplacian distributions with the listed attack types.
What would settle it
Explicit computation of the error probability for a bivariate Gaussian model with large positive correlation and additive anomaly, showing whether the Shapley-value test or the single-term test achieves the lower error rate.
Figures
read the original abstract
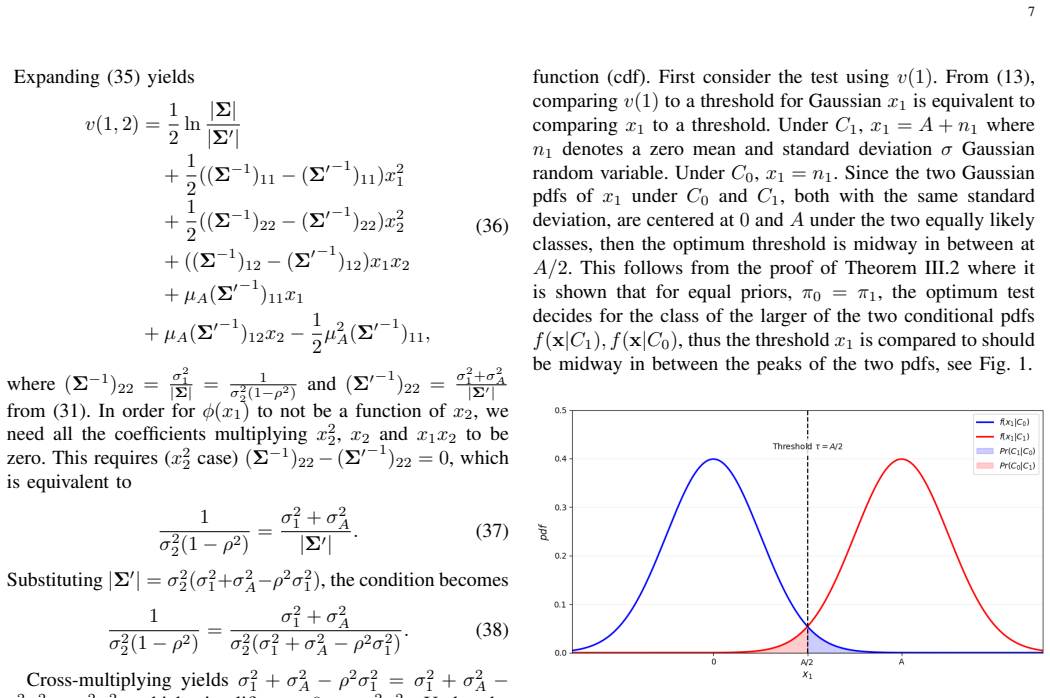
Recent publications have suggested using the Shap- ley value for sensor anomaly/attack localization. We study the performance of such an approach by using mathematically de- fined optimum binary classifiers in the Shapley value calculation. To judge localization performance, we study the ability of the Shapley value of a given sensor observation to determine if that observation is anomalous. First, we prove that for cases with independent sensor observations, an optimized anomaly test using the Shapley value is equivalent to an optimized lower-complexity anomaly test using a single term in the Shapley value calculation, yielding the exact same probability of error. For some popular dependent observation cases involving two sensors, including correlated bivariate Gaussian/Laplacian probability density functions and constant/Gaussian at- tacks/anomalies, we prove that these two tests are fundamentally different, yielding different decision regions and error probabil- ities. Further, we prove that the Shapley value test is sometimes strictly inferior to the other (single term in Shapley calculation) test in certain statistically dependent bivariate Gaussian scenarios with large correlation magnitude and additive attacks/anomalies, while it is strictly superior in others, depending on the sign of the correlation. One can combine these two approaches to obtain a strictly better approach in these cases. These results, which provide the first theoretical statistical analysis of Shapley-based localization, seem very interesting based on the wide acceptance of the Shapley value by many researchers and should encourage further research on this topic. Numerical results are provided which illustrate our findings.
Editorial analysis
A structured set of objections, weighed in public.
Referee Report
Summary. The manuscript analyzes the use of Shapley values for localizing sensor anomalies/attacks when optimal binary classifiers are employed in the value function. It proves equivalence (identical error probability) between a full Shapley-value test and a single-term test for independent observations. For two-sensor dependent cases (correlated bivariate Gaussian/Laplacian densities with constant or Gaussian additive attacks), the tests produce distinct decision regions and error rates; the Shapley test is shown to be strictly superior or inferior depending on correlation sign and magnitude, with a suggestion that combining the approaches yields a strictly better detector. Numerical illustrations are included.
Significance. If the derivations hold, the work supplies the first explicit statistical comparison of Shapley-based anomaly localization against simpler alternatives, establishing when the two coincide exactly and when one dominates. The parameter-free proofs on concrete distributions, together with the explicit superiority/inferiority results that depend on correlation sign, constitute a clear, falsifiable contribution that can guide practical use of Shapley values in sensor security.
minor comments (3)
- [§4] The abstract states that proofs are given for the dependent bivariate cases, but the main text should include an explicit statement of the attack magnitude range over which the strict superiority/inferiority holds (e.g., a lemma or corollary after the decision-region derivation).
- [§2] Notation for the value function v(S) and the single-term test should be introduced with a short table or equation block early in §2 to avoid repeated parenthetical definitions later.
- [§5] Figure captions for the numerical results should state the exact correlation values, attack type, and SNR used in each panel so that the plots can be reproduced without consulting the text.
Simulated Author's Rebuttal
We thank the referee for the positive assessment of our manuscript and the recommendation for minor revision. The summary accurately captures the core contributions regarding equivalence for independent sensors and the strict superiority/inferiority results for correlated bivariate cases.
Circularity Check
No significant circularity; direct proofs on distributions
full rationale
The paper's central claims consist of explicit equivalence proofs and strict comparisons between the Shapley-value test and the single-term test. These are derived step-by-step from the definitions of optimal binary classifiers (assumed to exist) and the concrete joint PDFs (independent sensors; correlated bivariate Gaussian/Laplacian with additive attacks). Decision regions and error probabilities are obtained by direct integration or comparison of likelihood ratios under the stated models. No parameters are fitted and then relabeled as predictions, no self-citation chain supports a load-bearing uniqueness claim, and no ansatz is imported via prior work. The results therefore reduce only to the input distributions and classifier optimality assumption, which are external to the derivation itself.
Axiom & Free-Parameter Ledger
axioms (2)
- domain assumption Sensor observations follow the examined distributions including independent cases and correlated bivariate Gaussian or Laplacian PDFs with constant or Gaussian attacks
- domain assumption Mathematically defined optimum binary classifiers exist for the anomaly detection task
Reference graph
Works this paper leans on
-
[1]
Or- der statistic estimation with application to tracking in autonomous driving,
K. Yang, Y . Bar-Shalom, P. Willett, and S. Hunt, “Or- der statistic estimation with application to tracking in autonomous driving,”IEEE Transactions on Aerospace and Electronic Systems, vol. 59, no. 4, pp. 3531–3538, 2023.DOI: 10.1109/TAES.2022.3229650
-
[2]
Dis- tributed detection of a nuclear radioactive source using fusion of correlated decisions,
A. Sundaresan, P. K. Varshney, and N. S. Rao, “Dis- tributed detection of a nuclear radioactive source using fusion of correlated decisions,” in2007 10th Interna- tional Conference on Information Fusion, 2007, pp. 1– 7.DOI: 10.1109/ICIF.2007.4408143
-
[3]
Harvesting am- bient rf for presence detection through deep learning,
Y . Liu, T. Wang, Y . Jiang, and B. Chen, “Harvesting am- bient rf for presence detection through deep learning,” IEEE Transactions on Neural Networks and Learning Systems, vol. 33, no. 4, pp. 1571–1583, 2022.DOI: 10. 1109/TNNLS.2020.3042908
-
[4]
D. A. Gritzalis, G. Pantziou, and R. Rom ´an-Castro, “Sensors cybersecurity,”Sensors (Basel), vol. 21, no. 5, Mar. 2021.DOI: 10.3390/s21051762 [5]The global risks report 2020, 2020. [Online]. Available: https : / / www. weforum . org / reports / the - global - risks - report-2020
-
[5]
E-sfd: Explainable sensor fault detection in the ics anomaly detection system,
C. Hwang and T. Lee, “E-sfd: Explainable sensor fault detection in the ics anomaly detection system,”IEEE Access, vol. 9, pp. 140 470–140 486, 2021.DOI: 10 . 1109/ACCESS.2021.3119573
-
[6]
Unsupervised multi-sensor anomaly local- ization with explainable ai,
M. Ameli, V . Pfanschilling, A. Amirli, W. Maass, and K. Kersting, “Unsupervised multi-sensor anomaly local- ization with explainable ai,” inInternational Conference on Artificial Intelligence Applications and Innovations, Springer, 2022, pp. 507–519
2022
- [7]
-
[8]
Asymptotic performance of a distributed detection system in correlated gaus- sian noise,
V . Aalo and R. Viswanathan, “Asymptotic performance of a distributed detection system in correlated gaus- sian noise,”IEEE Transactions on Signal Processing, vol. 40, no. 1, pp. 211–213, 1992
1992
-
[9]
Target location estima- tion in sensor networks with quantized data,
R. Niu and P. K. Varshney, “Target location estima- tion in sensor networks with quantized data,”IEEE Transactions on Signal Processing, vol. 54, no. 12, pp. 4519–4528, Dec. 2006.DOI: 10.1109/TSP.2006. 882082
-
[10]
On the optimality of the likelihood ratio test for local sensor decision rules in the presence of nonindependent observations,
B. Chen and P. K. Willett, “On the optimality of the likelihood ratio test for local sensor decision rules in the presence of nonindependent observations,”IEEE Transactions on Signal Processing, vol. 48, no. 12, pp. 3281–3291, 2000
2000
-
[11]
Decentralized detection in sensor networks,
J.-F. Chamberland and V . V . Veeravalli, “Decentralized detection in sensor networks,”IEEE Transactions on Signal Processing, vol. 51, no. 8, pp. 2107–2116, 2003
2003
-
[12]
Distributed detec- tion in the presence of byzantine sensors in wireless sen- sor networks,
S. Marano, V . Matta, and L. Tong, “Distributed detec- tion in the presence of byzantine sensors in wireless sen- sor networks,”IEEE Transactions on Signal Processing, vol. 57, no. 8, pp. 2875–2888, 2009
2009
-
[13]
Bayesian quick- est detection of propagating spatial events,
T. Halme, E. Nitzan, and V . Koivunen, “Bayesian quick- est detection of propagating spatial events,”IEEE Trans- actions on Signal Processing, vol. 70, pp. 5982–5995, 2022.DOI: 10.1109/TSP.2022.3230334
-
[14]
Music, maximum likelihood, and cramer-rao bound,
P. Stoica and A. Nehorai, “Music, maximum likelihood, and cramer-rao bound,”IEEE Transactions on Acous- tics, Speech, and Signal Processing, vol. 37, no. 5, pp. 720–741, 1989, Provides foundational statistical analysis comparing subspace methods to theoretical bounds
1989
-
[15]
Sensor array processing based on subspace fitting,
M. Viberg and B. Ottersten, “Sensor array processing based on subspace fitting,”IEEE Transactions on Signal Processing, vol. 39, no. 5, pp. 1110–1121, 1991, Rigor- 11 ous asymptotic statistical analysis of weighted subspace fitting estimators
1991
-
[16]
A sensitivity analysis of the music algorithm,
B. Friedlander, “A sensitivity analysis of the music algorithm,”IEEE Transactions on Acoustics, Speech, and Signal Processing, vol. 38, no. 10, pp. 1740–1751, 1990, Detailed statistical perturbation analysis of eigen- vectors and eigenvalues for subspace methods
1990
-
[17]
Error-energy bounds for adaptive filtering algorithms,
A. H. Sayed and M. Rupp, “Error-energy bounds for adaptive filtering algorithms,”IEEE Transactions on Signal Processing, vol. 45, no. 9, pp. 2267–2279, 1997, A landmark paper using energy conservation to analyze the statistical stability and performance of adaptive filters
1997
-
[18]
Performance advantage of complex lms for controlling narrow-band adaptive arrays,
L. Horowitz and K. Senne, “Performance advantage of complex lms for controlling narrow-band adaptive arrays,”IEEE Transactions on Acoustics, Speech, and Signal Processing, vol. 29, no. 3, pp. 722–736, 1981, A classic derivation of the second-order moment statistics for gradient-based adaptive algorithms
1981
-
[19]
Model-order selection: A review of information criterion rules,
P. Stoica and Y . Selen, “Model-order selection: A review of information criterion rules,”IEEE Signal Processing Magazine, vol. 21, no. 4, pp. 36–47, 2004, Analyzes the statistical consistency of criteria like AIC and BIC in the TSP context
2004
-
[20]
Identifiability of the parameters of non-gaussian arma models using cumu- lant statistics,
A. Swami and J. M. Mendel, “Identifiability of the parameters of non-gaussian arma models using cumu- lant statistics,”IEEE Transactions on Signal Processing, vol. 39, no. 11, pp. 2450–2460, 1991, Rigorous statis- tical proof of model identifiability using higher-order statistics
1991
-
[21]
The cramer-rao bound for estimating a sparse parameter vector,
Z. Ben-Haim and Y . C. Eldar, “The cramer-rao bound for estimating a sparse parameter vector,”IEEE Trans- actions on Signal Processing, vol. 58, no. 6, pp. 3384– 3389, 2010, Statistical characterization of the funda- mental limits in sparse signal recovery
2010
-
[22]
Second-order multidimensional ica: Performance analysis,
D. Lahat, J.-F. Cardoso, and H. Messer, “Second-order multidimensional ica: Performance analysis,”IEEE Transactions on Signal Processing, vol. 60, no. 9, pp. 4598–4610, 2012, Statistical performance character- ization of blind source separation under various noise conditions
2012
-
[23]
On the likelihood ratio for detection of signals in non-gaussian noise,
B. Picinbono, “On the likelihood ratio for detection of signals in non-gaussian noise,”IEEE Transactions on Signal Processing, vol. 43, no. 1, pp. 321–324, 1995
1995
- [24]
-
[25]
H. V . Poor,An introduction to signal detection and estimation. Springer Science & Business Media, 2013
2013
-
[26]
A value for n-person games,
L. S. Shapley, “A value for n-person games,” inContri- butions to the Theory of Games, Volume II, ser. Annals of Mathematics Studies, H. Kuhn and A. Tucker, Eds., vol. 28, Princeton, NJ: Princeton University Press, 1953, pp. 307–317
1953
-
[27]
Deep learning for anomaly detection: A review,
G. Pang, C. Shen, L. Cao, and A. V . D. Hengel, “Deep learning for anomaly detection: A review,”ACM Comput. Surv., vol. 54, no. 2, Mar. 2021,ISSN: 0360- 0300.DOI: 10.1145/3439950 [Online]. Available: https: //doi.org/10.1145/3439950
-
[28]
Deep Learning for Anomaly Detection: A Survey
R. Chalapathy and S. Chawla, “Deep learning for anomaly detection: A survey,”CoRR, vol. abs/1901.03407, 2019. arXiv: 1901 . 03407. [Online]. Available: http://arxiv.org/abs/1901.03407
work page internal anchor Pith review Pith/arXiv arXiv 1901
-
[29]
Explainable ai: Using shapley value to explain complex anomaly detection ml-based,
J. Zou and O. Petrosian, “Explainable ai: Using shapley value to explain complex anomaly detection ml-based,” Artificial Intelligence and Applications, pp. 152–164, 2023.DOI: 10.3233/FAIA200777
-
[30]
Using kernel shap xai method to optimize the network anomaly detection model,
K. Roshan and A. Zafar, “Using kernel shap xai method to optimize the network anomaly detection model,” in 2022 9th International Conference on Computing for Sustainable Global Development (INDIACom), 2022, pp. 74–80.DOI: 10 . 23919 / INDIACom54597 . 2022 . 9763241
2022
-
[31]
Takeishi and Y
N. Takeishi and Y . Kawahara,A characteristic function for shapley-value-based attribution of anomaly scores,
- [32]
-
[33]
Shapley values of reconstruction errors of pca for explaining anomaly detection,
N. Takeishi, “Shapley values of reconstruction errors of pca for explaining anomaly detection,” in2019 International Conference on Data Mining Workshops (ICDMW), 2019, pp. 793–798.DOI: 10.1109/ICDMW. 2019.00117
-
[34]
Explaining anomalies detected by autoencoders using shapley additive explanations,
L. Antwarg, R. M. Miller, B. Shapira, and L. Rokach, “Explaining anomalies detected by autoencoders using shapley additive explanations,”Expert Systems with Applications, vol. 186, p. 115 736, 2021,ISSN: 0957- 4174.DOI: https://doi.org/10.1016/j.eswa.2021.115736 [Online]. Available: https : / / www. sciencedirect . com / science/article/pii/S0957417421011155
-
[35]
Model inde- pendent feature attributions: Shapley values that un- cover non-linear dependencies,
D. Fryer, I. Strumke, and H. Nguyen, “Model inde- pendent feature attributions: Shapley values that un- cover non-linear dependencies,”PeerJ Computer Sci- ence, vol. 7, e582, Jun. 2021.DOI: 10.7717/peerj-cs.582
-
[36]
K. Aas, M. Jullum, and A. Løland, “Explaining indi- vidual predictions when features are dependent: More accurate approximations to shapley values,”Artificial Intelligence, vol. 298, p. 103 502, 2021,ISSN: 0004- 3702.DOI: https://doi.org/10.1016/j.artint.2021.103502 [Online]. Available: https : / / www. sciencedirect . com / science/article/pii/S0004370221000539
-
[37]
On shapley value for measur- ing importance of dependent inputs,
A. Owen and C. Prieur, “On shapley value for measur- ing importance of dependent inputs,”SIAM/ASA Journal on Uncertainty Quantification, vol. 5, Oct. 2016.DOI: 10.1137/16M1097717
-
[38]
The many shapley values for model explanation,
M. Sundararajan and A. Najmi, “The many shapley values for model explanation,” inProceedings of the 37th International Conference on Machine Learning, H. D. III and A. Singh, Eds., ser. Proceedings of Machine Learning Research, vol. 119, PMLR, 13–18 Jul 2020, pp. 9269–9278. [Online]. Available: https : //proceedings.mlr.press/v119/sundararajan20b.html
2020
-
[39]
On using the shapley value for anomaly localization: A statistical investigation,
R. S. Blum, X. Fang, and F. Freytag, “On using the shapley value for anomaly localization: A statistical investigation,”Applied AI Letters, vol. 7, no. 2, e70024, 12 2026, e70024 AAIL-2025-057.DOI: https://doi.org/10. 1002/ail2.70024 eprint: https://onlinelibrary.wiley.com/ doi/pdf/10.1002/ail2.70024. [Online]. Available: https: //onlinelibrary.wiley.com/...
-
[40]
Multivariate generalized gaussian distribution: Convexity and graph- ical models,
T. Zhang, A. Wiesel, and M. S. Greco, “Multivariate generalized gaussian distribution: Convexity and graph- ical models,”IEEE Transactions on Signal Processing, vol. 61, no. 16, pp. 4141–4148, 2013.DOI: 10.1109/ TSP.2013.2267740
-
[41]
A mul- tivariate generalization of the power exponential family of distributions,
E. G ´omez, M. Gomez-Villegas, and J. Mar ´ın, “A mul- tivariate generalization of the power exponential family of distributions,”Communications in Statistics-Theory and Methods, vol. 27, no. 3, pp. 589–600, 1998
1998
-
[42]
M. E. Johnson,Multivariate Statistical Simulation. New York, NY: John Wiley & Sons, 1987, ch. 6,ISBN: 978- 0471822875
1987
discussion (0)
Sign in with ORCID, Apple, or X to comment. Anyone can read and Pith papers without signing in.