HakushoBench: A Japanese Chart and Table VQA Benchmark from Governmental White Papers
Pith reviewed 2026-06-28 17:35 UTC · model grok-4.3
The pith
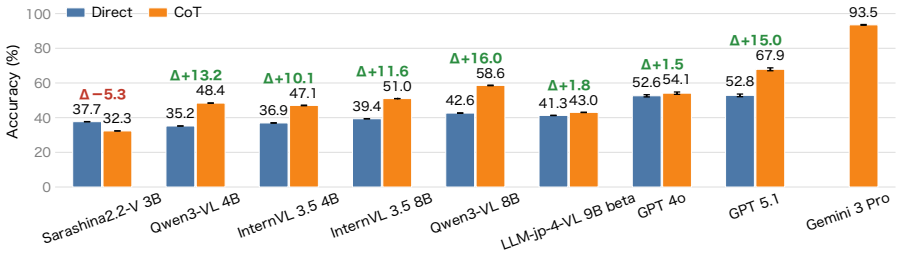
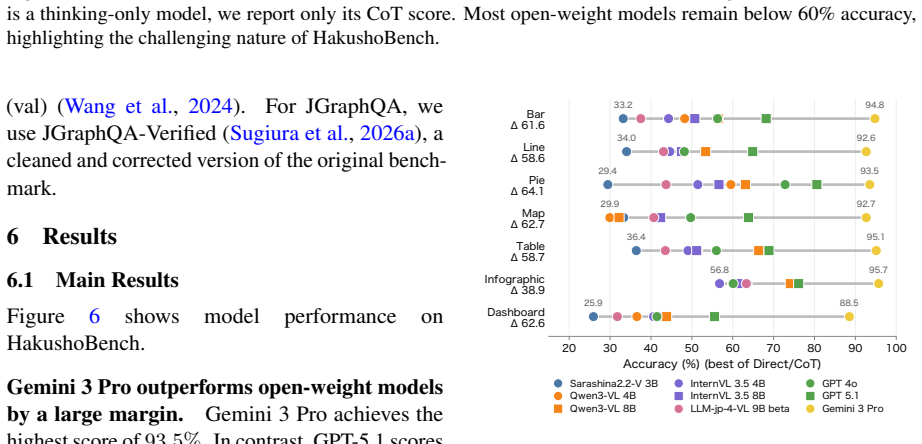
HakushoBench, built from 33 Japanese governmental white papers, shows the best open-weight vision-language model reaches only 58.6 percent accuracy on chart and table questions with a 34.9-point gap to proprietary models.
A machine-rendered reading of the paper's core claim, the machinery that carries it, and where it could break.
Core claim
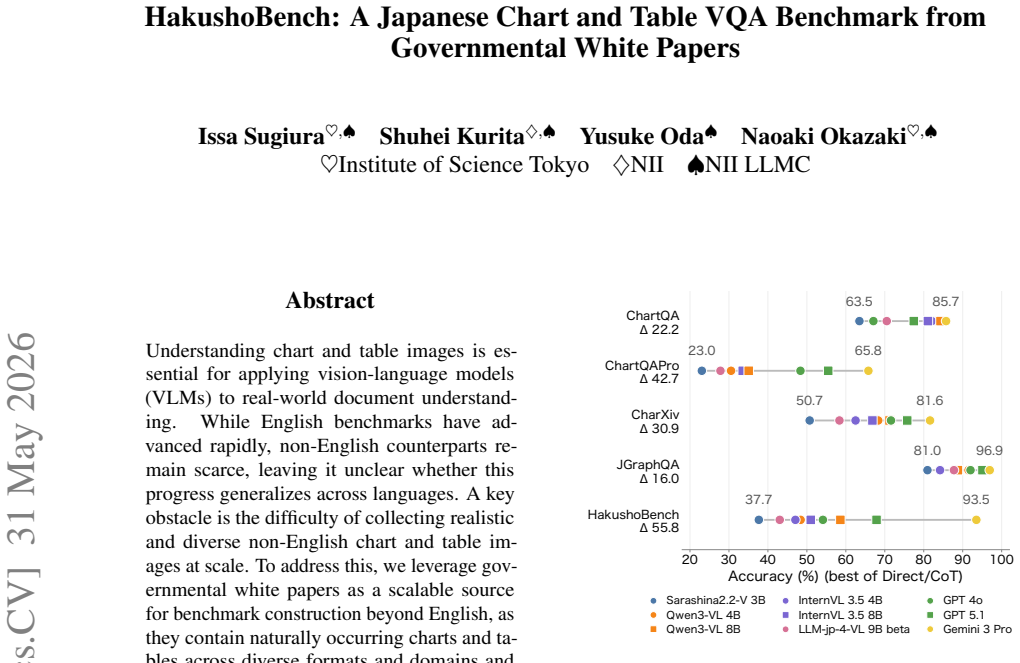
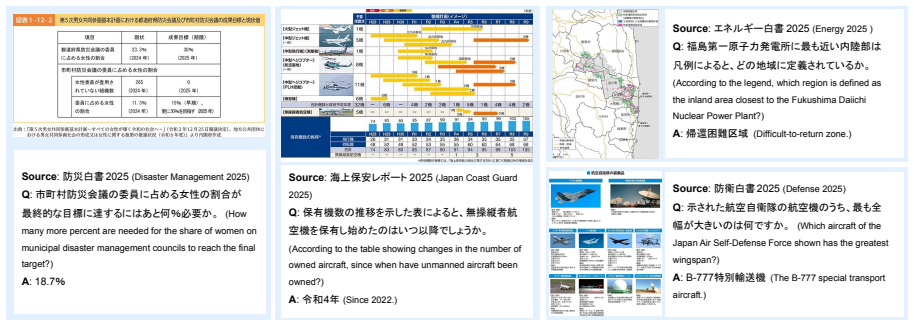
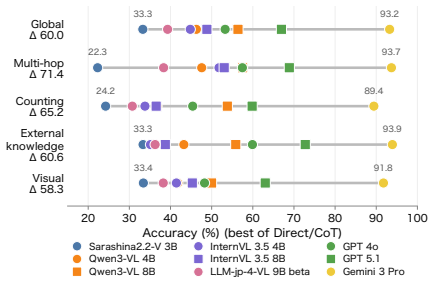
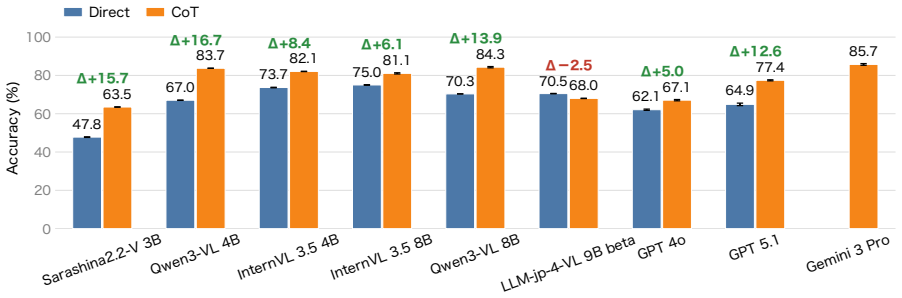
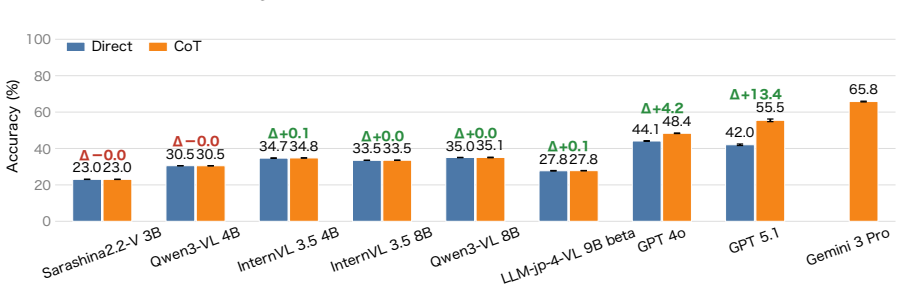
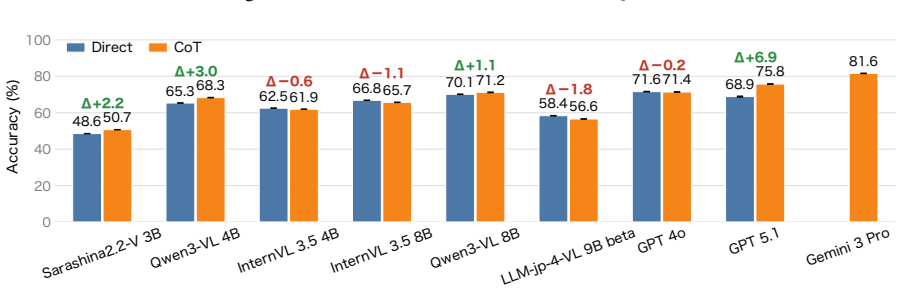
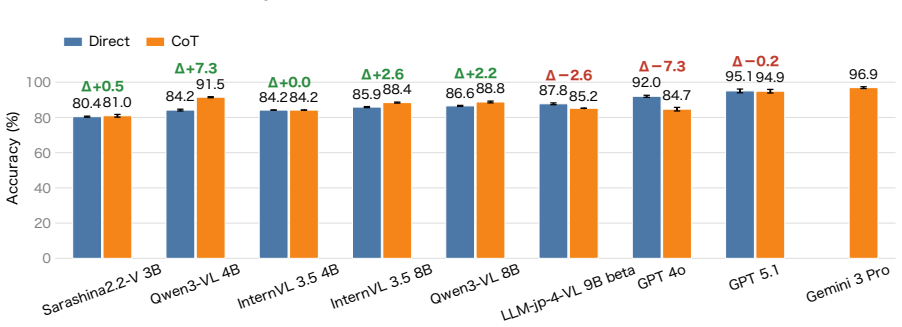
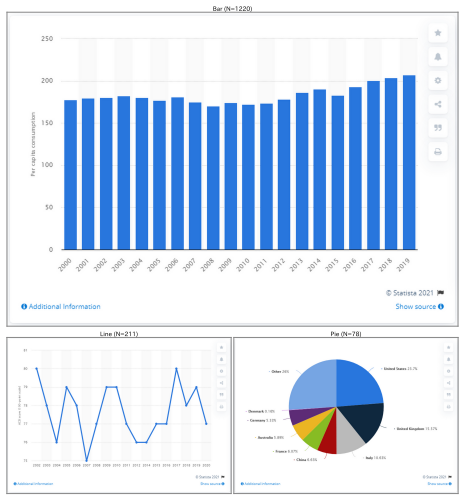
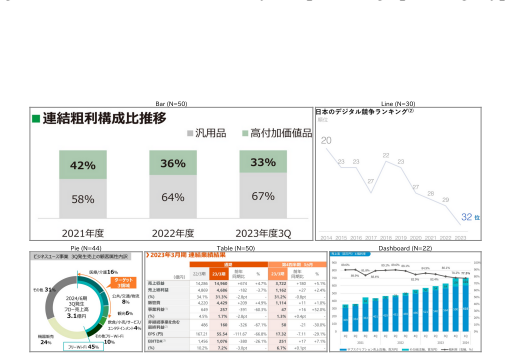
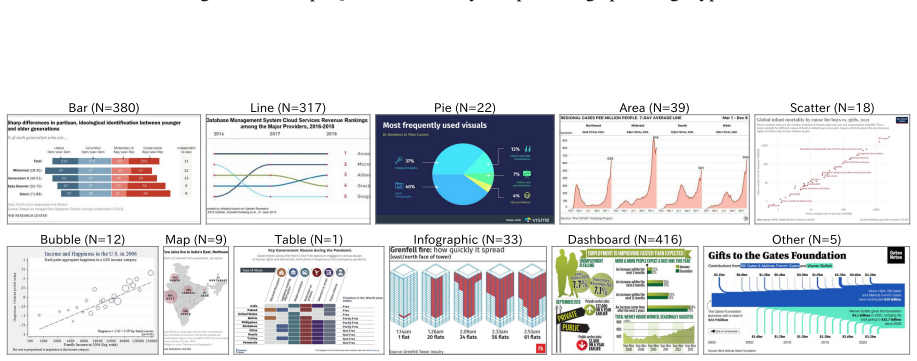
HakushoBench supplies 2,053 chart and table images drawn from 33 Japanese governmental white papers together with manually annotated questions that target deep holistic understanding; evaluation across vision-language models shows open-weight models limited to 58.6 percent accuracy and a 34.9-point deficit relative to proprietary systems.
What carries the argument
HakushoBench, the dataset of charts and tables extracted from governmental white papers and paired with questions written to demand integrated visual-textual reasoning rather than isolated cues.
If this is right
- Open-weight vision-language models require further development to handle non-English chart and table reasoning at proprietary levels.
- Governmental white papers offer a scalable route to realistic multilingual benchmarks in other countries.
- English benchmark gains do not automatically translate to Japanese document understanding tasks.
- Annotation that prioritizes holistic questions produces harder evaluations than methods focused on local features.
- Public release of the images and questions allows direct measurement of progress toward closing the observed gap.
Where Pith is reading between the lines
- Comparable benchmarks could be assembled from white papers in additional languages to check cross-lingual generalization.
- Models adapted to HakushoBench may improve accuracy in practical Japanese administrative document processing.
- The size of the gap suggests language-specific data or architectural adjustments may matter more than raw scale alone.
Load-bearing premise
The manually created questions genuinely require deep and holistic understanding of the charts and tables instead of local visual shortcuts.
What would settle it
A new open-weight model that scores above 80 percent on the full HakushoBench test set without task-specific fine-tuning would show the claimed performance gap does not hold.
Figures
read the original abstract
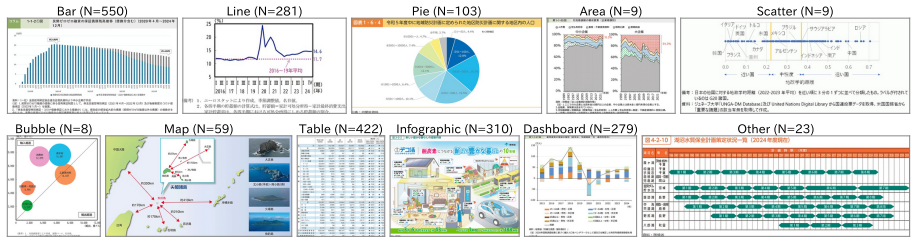
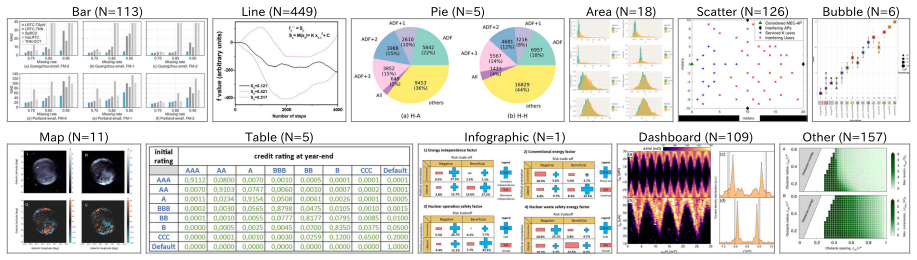
Understanding chart and table images is essential for applying vision-language models (VLMs) to real-world document understanding. While English benchmarks have advanced rapidly, non-English counterparts remain scarce, leaving it unclear whether this progress generalizes across languages. A key obstacle is the difficulty of collecting realistic and diverse non-English chart and table images at scale. To address this, we leverage governmental white papers as a scalable source for benchmark construction beyond English, as they contain naturally occurring charts and tables across diverse formats and domains and are freely accessible in many countries. As a first instantiation, we introduce HakushoBench, a challenging Japanese chart and table VQA benchmark built from 33 governmental white papers. HakushoBench contains 2,053 images spanning over 10 image types, with manually annotated QA pairs, designed to assess deep and holistic understanding of charts and tables, rather than local visual cues alone. Experiments across a broad range of VLMs demonstrate that HakushoBench remains challenging for open-weight models: the best open-weight model achieves only 58.6% accuracy, and a 34.9-point gap between open-weight and proprietary models highlights substantial room for improvement in complex chart and table understanding. We release our dataset and code.
Editorial analysis
A structured set of objections, weighed in public.
Referee Report
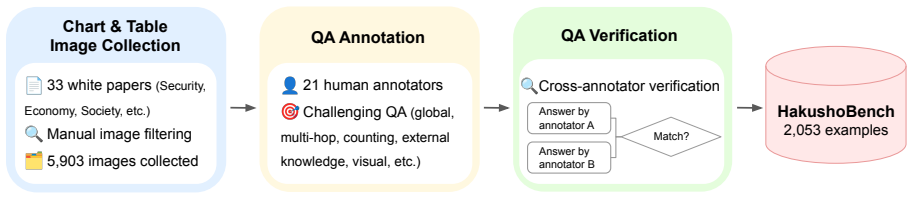
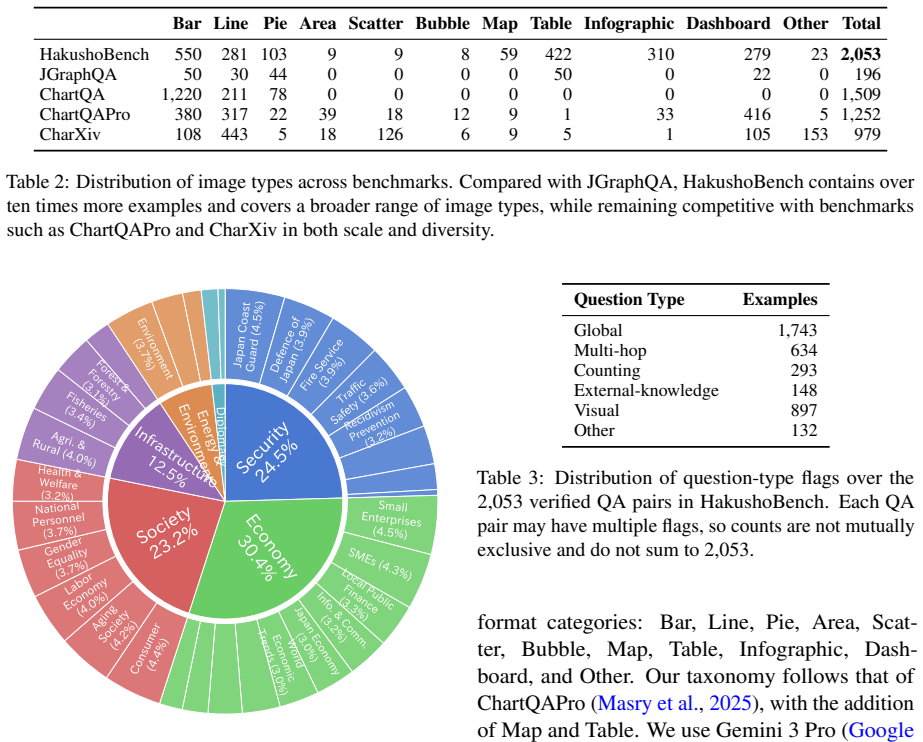
Summary. The manuscript introduces HakushoBench, a Japanese visual question answering benchmark for charts and tables extracted from 33 governmental white papers. The benchmark comprises 2,053 images across more than 10 image types, accompanied by manually annotated QA pairs intended to evaluate deep and holistic understanding of charts and tables. Through experiments on a range of vision-language models, it reports that the best-performing open-weight model achieves 58.6% accuracy, with a 34.9 percentage point gap to proprietary models, underscoring the difficulty of the task and the need for improved complex document understanding capabilities in non-English settings.
Significance. If the QA annotations prove reliable, this benchmark would fill an important gap in non-English resources for chart and table VQA, leveraging a scalable source of real-world governmental documents. The reported performance gap between open-weight and proprietary models provides a concrete measure of current limitations in multilingual VLM capabilities for document understanding, which could guide future model development and evaluation practices.
major comments (1)
- [Abstract (and Dataset Construction section)] The central claim that HakushoBench assesses 'deep and holistic understanding' rather than local visual cues, and that the reported accuracies (best open-weight 58.6%, 34.9-point gap) demonstrate its challenge, depends on the quality and reliability of the manually annotated QA pairs. However, the abstract provides no details on the annotation methodology, number of annotators, inter-annotator agreement, or validation procedures such as a human performance baseline. This information is load-bearing for interpreting the results as evidence of model limitations in complex understanding rather than annotation artifacts.
minor comments (1)
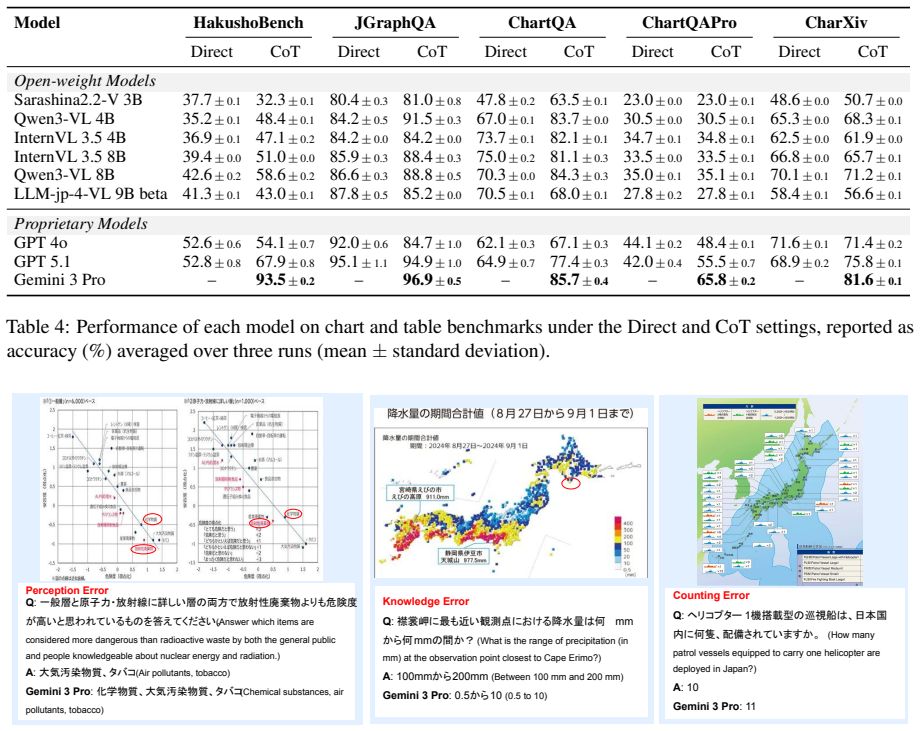
- A table summarizing VLM results (model names, open-weight vs. proprietary status, accuracies) would improve readability of the experimental findings.
Simulated Author's Rebuttal
We thank the referee for the constructive feedback and for recognizing the potential value of HakushoBench in addressing the gap in non-English chart and table VQA resources. We agree that the reliability of the QA annotations is central to interpreting the benchmark's difficulty and the reported performance gaps, and we will revise the manuscript to provide the requested details.
read point-by-point responses
-
Referee: [Abstract (and Dataset Construction section)] The central claim that HakushoBench assesses 'deep and holistic understanding' rather than local visual cues, and that the reported accuracies (best open-weight 58.6%, 34.9-point gap) demonstrate its challenge, depends on the quality and reliability of the manually annotated QA pairs. However, the abstract provides no details on the annotation methodology, number of annotators, inter-annotator agreement, or validation procedures such as a human performance baseline. This information is load-bearing for interpreting the results as evidence of model limitations in complex understanding rather than annotation artifacts.
Authors: We agree that the abstract and Dataset Construction section currently lack sufficient detail on annotation procedures, which is necessary to substantiate claims about deep understanding. In the revised manuscript we will expand both sections to describe the annotation methodology (including how questions were designed to target holistic chart/table comprehension rather than local cues), the number of annotators, the process for resolving disagreements, inter-annotator agreement statistics, and a human performance baseline computed on a held-out subset. These additions will allow readers to assess annotation quality directly and strengthen the interpretation of the 58.6% open-weight and 34.9-point proprietary gap as evidence of model limitations. revision: yes
Circularity Check
No circularity: empirical benchmark reporting with no derivations or fitted predictions
full rationale
The paper constructs HakushoBench from governmental white papers and reports VLM accuracies on it. No equations, parameter fitting, or derivation chain exists that could reduce a claimed prediction to its inputs by construction. The central claims rest on dataset collection and external model evaluation rather than any self-referential mathematical step. Self-citations, if present, are not load-bearing for any uniqueness theorem or ansatz. This is a standard empirical benchmark paper with no circularity patterns.
Axiom & Free-Parameter Ledger
axioms (1)
- domain assumption Governmental white papers contain naturally occurring charts and tables across diverse formats and domains and are freely accessible.
Reference graph
Works this paper leans on
-
[1]
PaddleOCR-VL: Boosting multilingual document parsing via a 0.9b ultra-compact vision-language model.Preprint, arXiv:2510.14528. Google DeepMind
-
[2]
https://storage.googleapis.com/deepmind-m edia/Model-Cards/Gemini-3-Pro-Model-Card
Gemini 3 Pro model card. https://storage.googleapis.com/deepmind-m edia/Model-Cards/Gemini-3-Pro-Model-Card. pdf. Accessed: 2026-05-19. Anson Ho, Jean-Stanislas Denain, David Atanasov, Samuel Albanie, and Rohin Shah
2026
-
[3]
A Rosetta Stone for AI Benchmarks, 2025
A rosetta stone for AI benchmarks.Preprint, arXiv:2512.00193. InternVL Team
-
[4]
InternVL3.5: Advancing Open-Source Multimodal Models in Versatility, Reasoning, and Efficiency
InternVL3.5: Advancing open- source multimodal models in versatility, reasoning, and efficiency.Preprint, arXiv:2508.18265. Japanese Digital Agency
work page internal anchor Pith review Pith/arXiv arXiv
-
[5]
https://www
e-Gov. https://www. e-gov.go.jp/about-government/white-papers. html. Accessed: 2026-05-19. Siddharth Joshi, Haoli Yin, Rishabh Adiga, Ricardo Monti, Aldo Carranza, Alex Fang, Alvin Deng, Amro Abbas, Brett Larsen, Cody Blakeney, Darren Teh, David Schwab, Fan Pan, Haakon Mongstad, Jack Urbanek, Jason Lee, Jason Telanoff, Josh Wills, Kaleigh Mentzer, and 12 others
2026
-
[6]
Kushal Kafle, Brian Price, Scott Cohen, and Christopher Kanan
DatBench: Discriminative, faithful, and efficient VLM evalua- tions.Preprint, arXiv:2601.02316. Kushal Kafle, Brian Price, Scott Cohen, and Christopher Kanan
-
[7]
FigureQA: An Annotated Figure Dataset for Visual Reasoning
FigureQA: An annotated 9 figure dataset for visual reasoning.Preprint, arXiv:1710.07300. Shankar Kantharaj, Rixie Tiffany Leong, Xiang Lin, Ahmed Masry, Megh Thakkar, Enamul Hoque, and Shafiq Joty
work page internal anchor Pith review Pith/arXiv arXiv
-
[8]
Kimi-VL technical report.Preprint, arXiv:2504.07491. Akira Kinoshita
work page internal anchor Pith review Pith/arXiv arXiv
-
[9]
https://hugg ingface.co/datasets/r- g2- 2024/JGraphQA
JGraphQA. https://hugg ingface.co/datasets/r- g2- 2024/JGraphQA . Accessed: 2026-05-19. Takeshi Kojima, Shixiang Shane Gu, Machel Reid, Yu- taka Matsuo, and Yusuke Iwasawa
2024
-
[10]
GPT-4o system card.Preprint, arXiv:2410.21276. OpenAI
work page internal anchor Pith review Pith/arXiv arXiv
-
[11]
https://openai.com/index/gpt -5-1
GPT-5.1: A smarter, more conversa- tional ChatGPT. https://openai.com/index/gpt -5-1. Accessed: 2026-05-19. Yonatan Oren, Nicole Meister, Niladri S. Chatterji, Faisal Ladhak, and Tatsunori Hashimoto
2026
-
[12]
https://ourworld indata.org/
Our world in data. https://ourworld indata.org/. Accessed: 2026-05-19. Long Phan, Alice Gatti, Nathaniel Li, Adam Khoja, Ryan Kim, Richard Ren, Jason Hausenloy, Oliver Zhang, Mantas Mazeika, Dan Hendrycks, Ziwen Han, Josephina Hu, Hugh Zhang, Chen Bo Calvin Zhang, Mohamed Shaaban, John Ling, Sean Shi, Michael Choi, Anish Agrawal, and 281 others
2026
-
[13]
Qwen3-VL technical report. Preprint, arXiv:2511.21631. Keito Sasagawa, Shuhei Kurita, and Daisuke Kawa- hara
work page internal anchor Pith review Pith/arXiv arXiv
-
[14]
Evaluating multimodal large language models on vertically written japanese text.Preprint, arXiv:2511.15059. SB Intuitions
-
[15]
https: //huggingface.co/sbintuitions/sarashina2 .2-vision-3b
Sarashina2.2-Vision-3B. https: //huggingface.co/sbintuitions/sarashina2 .2-vision-3b. Accessed: 2026-05-19. Statista
2026
-
[16]
https://www.statista.com /
Statista. https://www.statista.com /. Accessed: 2026-05-19. Stockmark
2026
-
[17]
JAMMEval: A Refined Collection of Japanese Benchmarks for Reliable VLM Evaluation
BusinessSlideVQA. https://gith ub.com/stockmarkteam/business-slide-quest ions. Accessed: 2026-05-19. Issa Sugiura, Koki Maeda, Shuhei Kurita, Yusuke Oda, Daisuke Kawahara, and Naoaki Okazaki. 2026a. JAMMEval: A refined collection of Japanese bench- marks for reliable VLM evaluation.Preprint, arXiv:2604.00909. Issa Sugiura, Keito Sasagawa, Keisuke Nakao, K...
work page internal anchor Pith review Pith/arXiv arXiv 2026
-
[18]
SigLIP 2: Multilingual vision-language encoders with improved semantic understanding, localization, and dense features.Preprint, arXiv:2502.14786. U.S. Government Publishing Office
work page internal anchor Pith review Pith/arXiv arXiv
-
[19]
https://www.govinfo.go v/app/collection/erp
Economic report of the president. https://www.govinfo.go v/app/collection/erp. Accessed: 2026-05-19. 10 Zirui Wang, Mengzhou Xia, Luxi He, Howard Chen, Yitao Liu, Richard Zhu, Kaiqu Liang, Xindi Wu, Haotian Liu, Sadhika Malladi, Alexis Chevalier, San- jeev Arora, and Danqi Chen
2026
-
[20]
DeepSeek-OCR: Contexts Optical Compression
DeepSeek-OCR: Contexts optical compression. Preprint, arXiv:2510.18234. Jason Wei, Xuezhi Wang, Dale Schuurmans, Maarten Bosma, brian ichter, Fei Xia, Ed H. Chi, Quoc V Le, and Denny Zhou
work page internal anchor Pith review Pith/arXiv arXiv
-
[21]
POLY- CHARTQA: Benchmarking large vision-language models with multilingual chart question answering. Preprint, arXiv:2507.11939. A Licenses for Our Resources HakushoBench and its evaluation code are released under the Apache 2.0 License. Note that we dis- tribute only image URLs rather than the raw image data. B Use of AI Assistants We used AI assistants ...
discussion (0)
Sign in with ORCID, Apple, or X to comment. Anyone can read and Pith papers without signing in.