Modeling the Thermal Low-Frequency Radio Sun with Ray Tracing
Pith reviewed 2026-06-28 12:29 UTC · model grok-4.3
The pith
Ray tracing through 3D coronal models reproduces the quiet-Sun radio spectrum once refraction is included.
A machine-rendered reading of the paper's core claim, the machinery that carries it, and where it could break.
Core claim
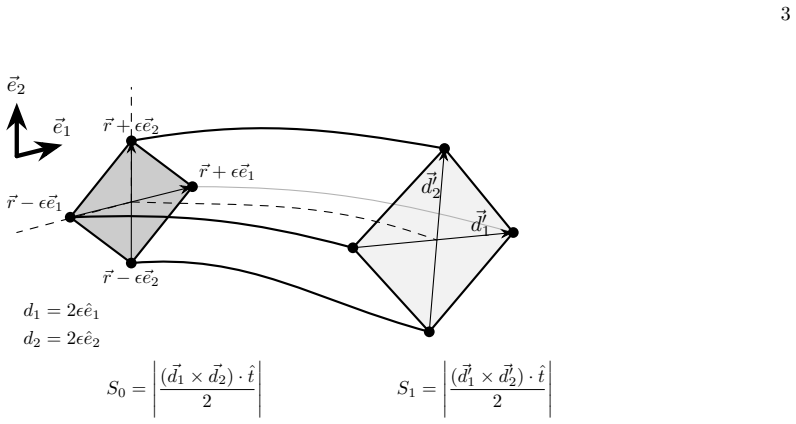
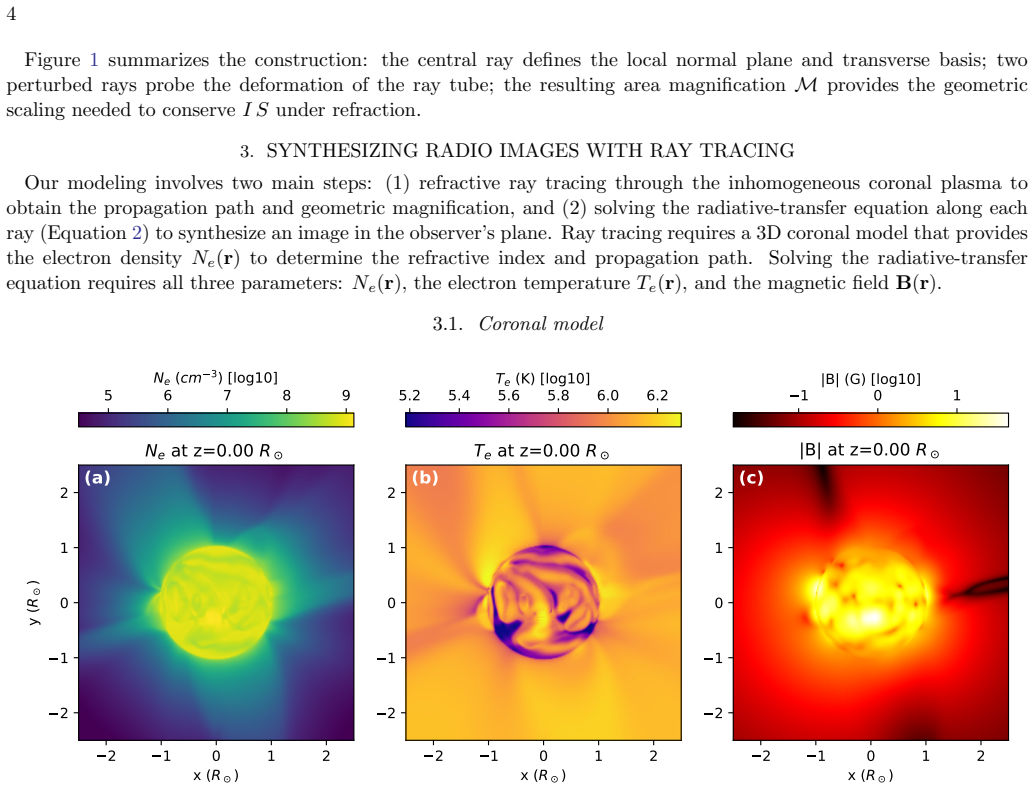
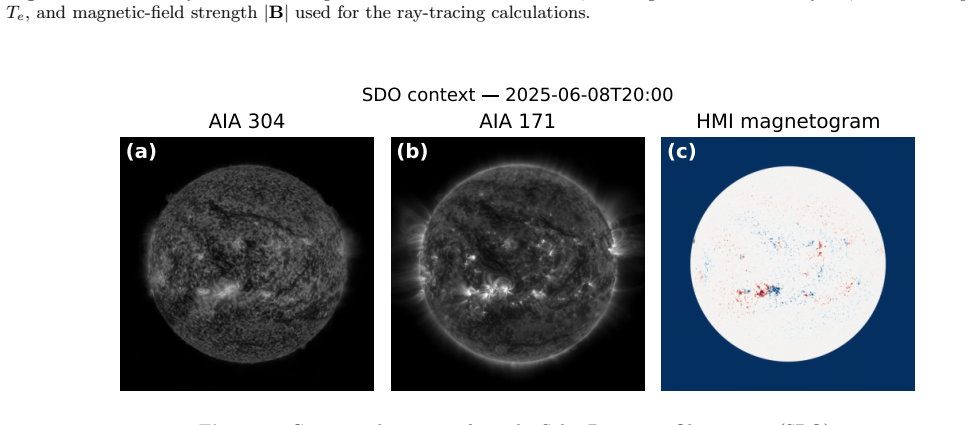
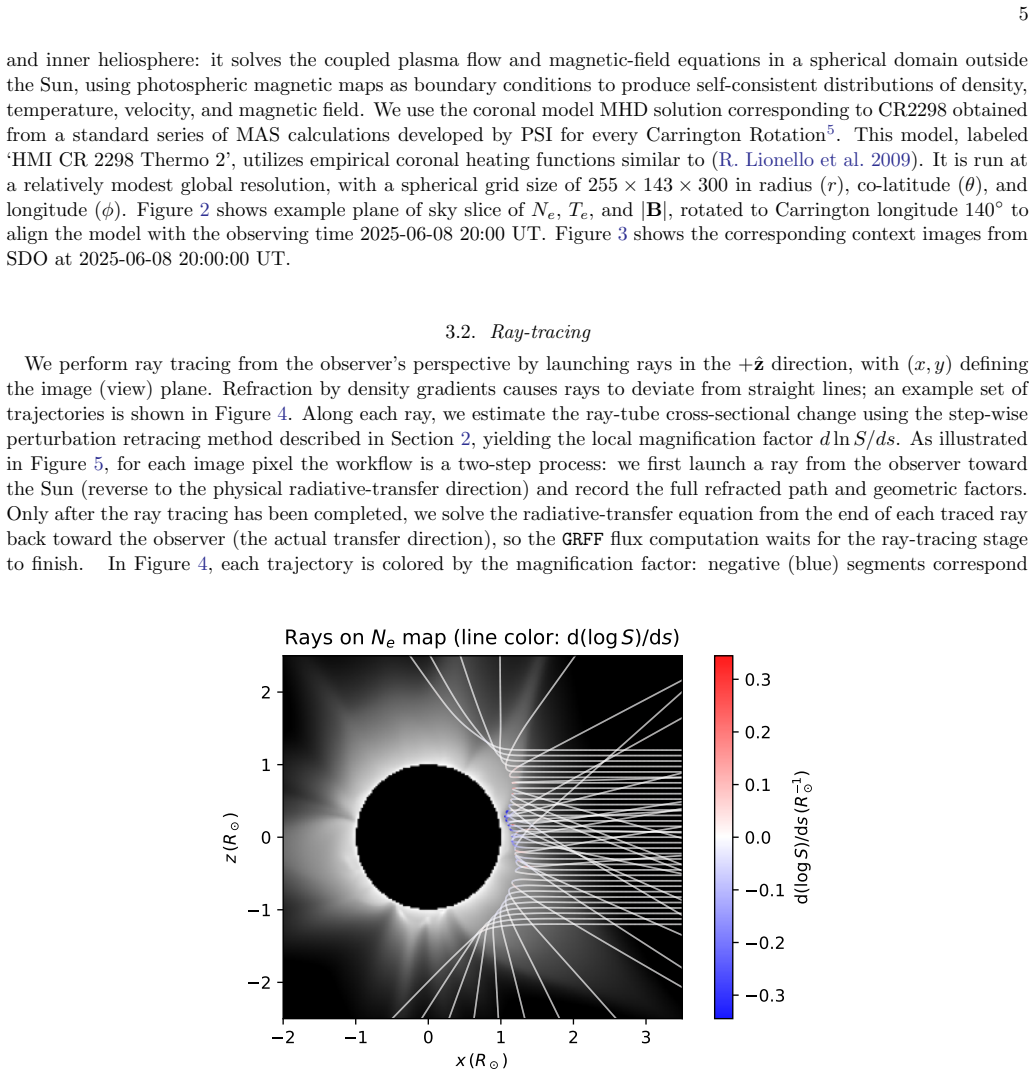
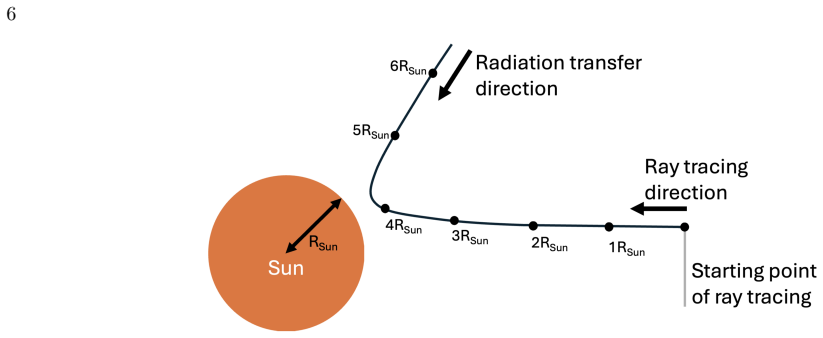
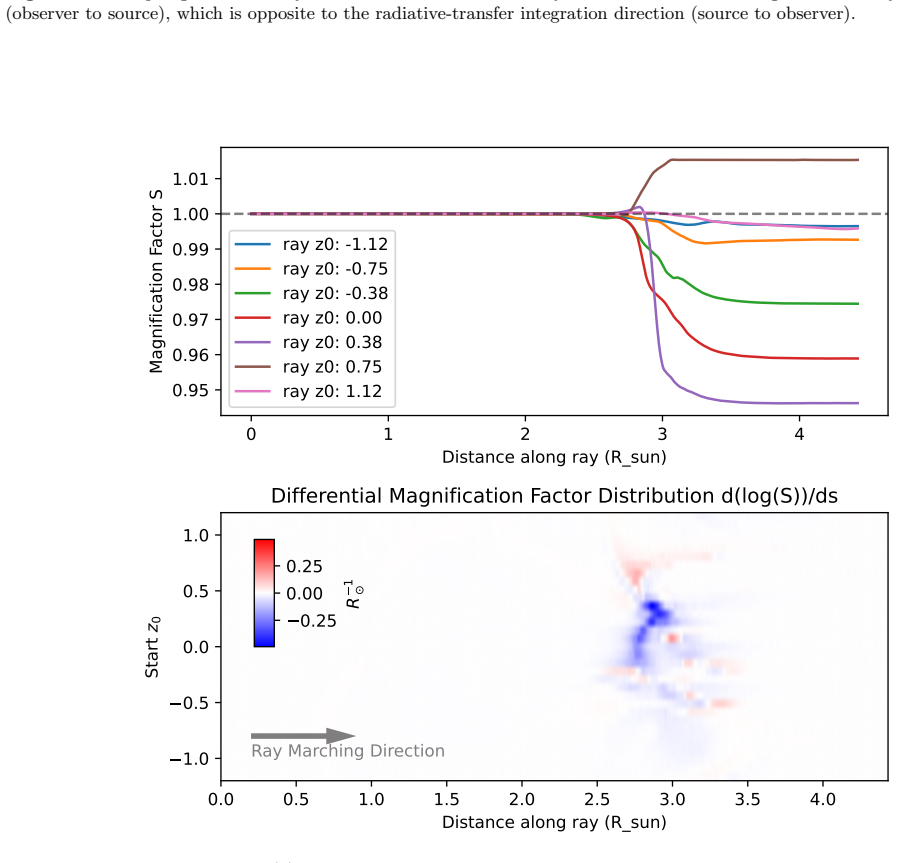
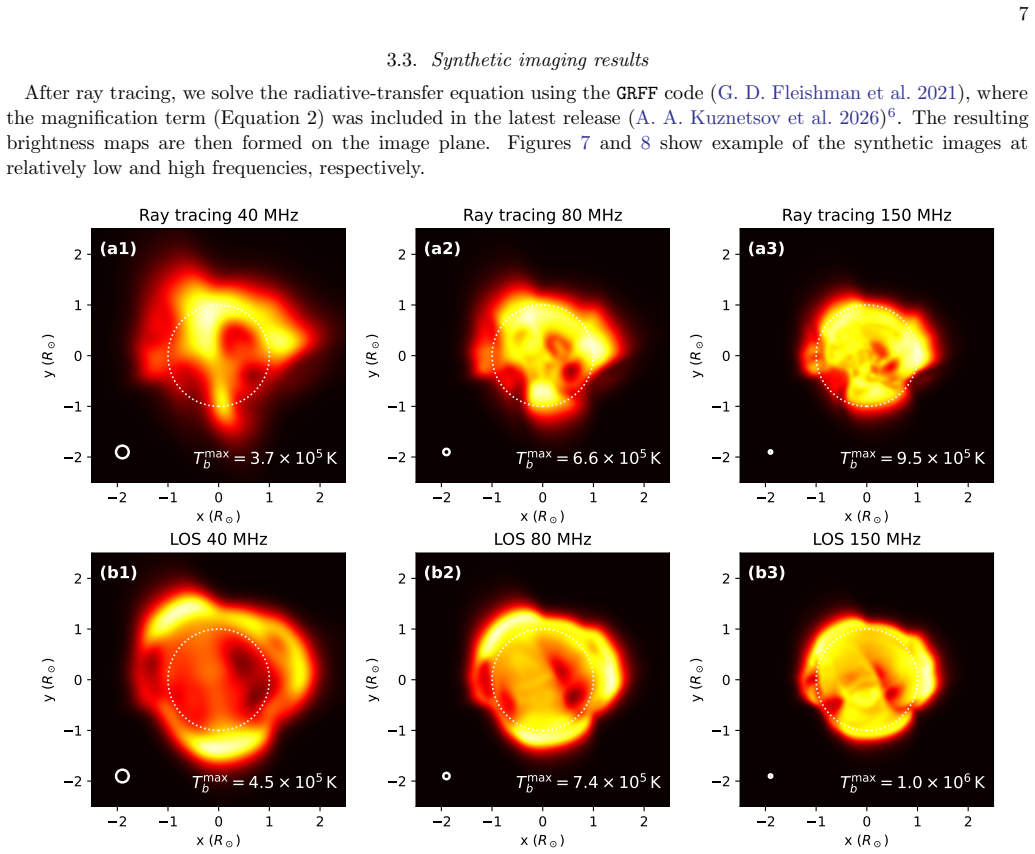
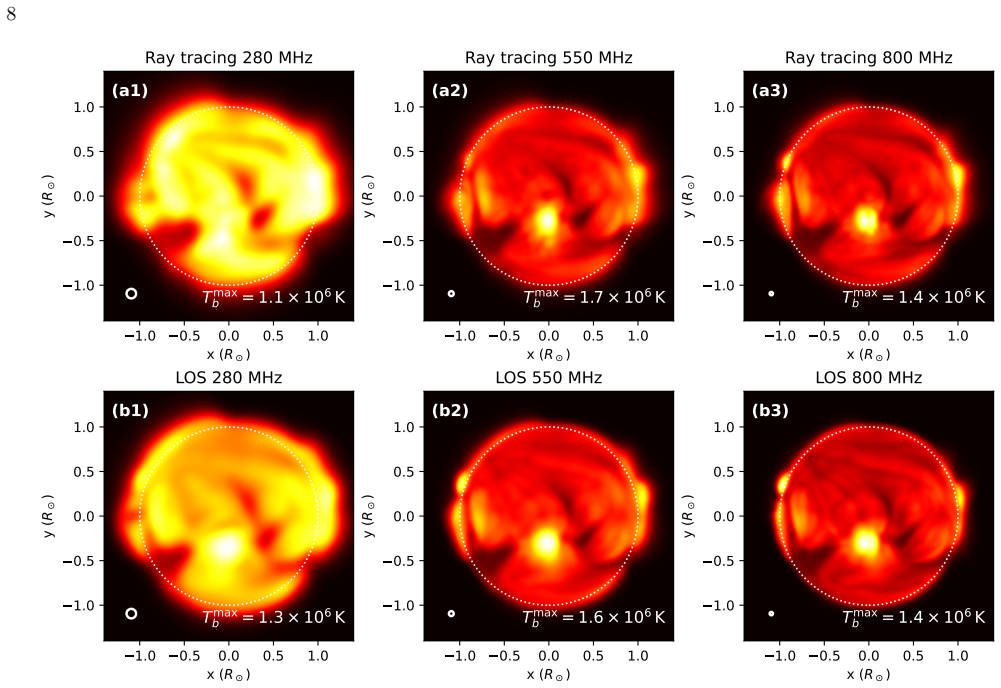
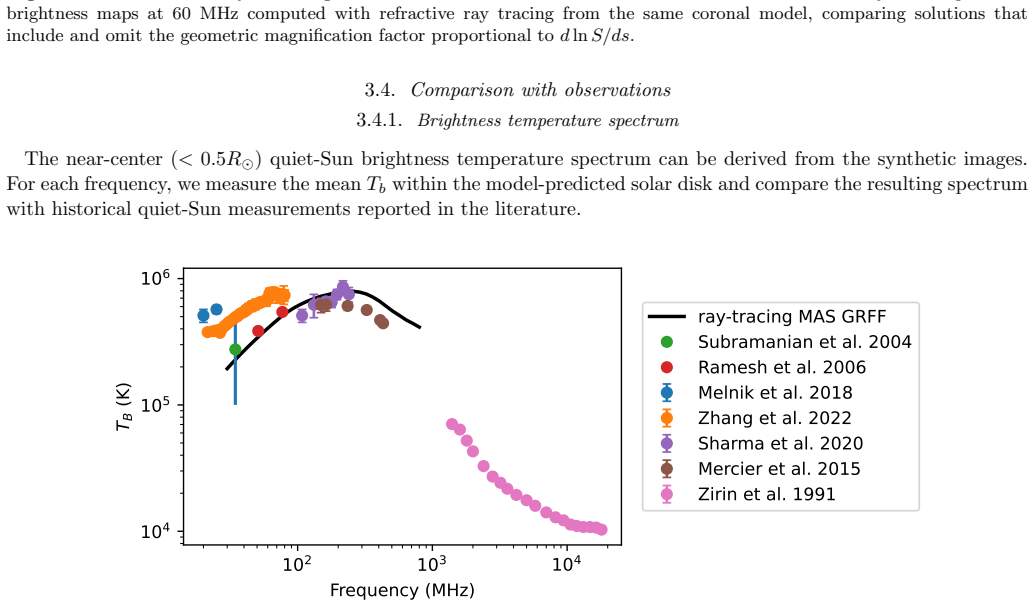
We develop a forward-modeling framework that combines refractive ray tracing through a global 3D coronal model with radiative transfer along each ray. The method tracks the ray-tube cross-sectional area S(s) using a step-wise perturbation retracing approach and incorporates a geometric magnification term proportional to d ln S / ds to enforce flux conservation under focusing/defocusing. Thermal free-free emission and absorption are then computed with the GRFF radiative transfer code to produce synthetic radio maps over 40--800 MHz. Applying the framework to Carrington rotation 2298, we find that including propagation effects allows the quiet-Sun background spectrum to be well reproduced.
What carries the argument
Ray-tube cross-sectional area S(s) tracked by step-wise perturbation retracing, together with the geometric magnification term d ln S / ds that enforces flux conservation during refraction.
If this is right
- Synthetic radio maps generated this way become suitable for direct quantitative comparison with interferometric observations.
- Propagation effects must be included to reproduce the observed quiet-Sun background at meter and decimeter wavelengths.
- Active-region brightness remains under-predicted, so additional emission or absorption mechanisms are required for those features.
- The framework can be used to test how refraction and focusing alter the apparent size and brightness distribution of the radio Sun.
Where Pith is reading between the lines
- The same ray-tracing machinery could be applied to time-evolving coronal models to predict how radio morphology changes during solar rotation or flares.
- Discrepancies remaining in active regions may point to the need for non-thermal electron populations that are not present in the current thermal-only calculation.
- The method offers a route to forward-model radio images at frequencies where future arrays will provide high-resolution data, allowing direct tests of coronal density structure.
Load-bearing premise
The chosen global 3D coronal model supplies density and magnetic-field values accurate enough for the calculated refraction and free-free opacity to match the real quiet Sun.
What would settle it
A large mismatch between the modeled and observed quiet-Sun flux density spectrum across 40-800 MHz when the same framework is applied to an independent coronal density model would show that the refraction treatment does not capture reality.
Figures
read the original abstract
Incoherent radio emission at meter--decimeter wavelengths provides a key diagnostic of the coronal thermal plasma, but at frequencies below $\sim$\,1\,GHz coronal refraction can substantially bend ray paths and modify the apparent source size and brightness distribution. We develop a forward-modeling framework that combines refractive ray tracing through a global 3D coronal model with radiative transfer along each ray. The method tracks the ray-tube cross-sectional area $S(s)$ using a step-wise perturbation retracing approach and incorporates a geometric magnification term proportional to $d\ln S/ds$ to enforce flux conservation under focusing/defocusing. Thermal free--free emission and absorption are then computed with the \texttt{GRFF} radiative transfer code to produce synthetic radio maps over 40--800\,MHz. Applying the framework to Carrington rotation 2298, we find that including propagation effects allows the quiet-Sun background spectrum to be well reproduced. However, active region brightness is less accurately modeled, suggesting that additional physical factors should be considered in future work. These results establish a physics-based method for generating low-frequency quiet-Sun synthetic images suitable for quantitative comparison with interferometric observations and for assessing how propagation effects shape the observed morphology.
Editorial analysis
A structured set of objections, weighed in public.
Referee Report
Summary. The paper develops a forward-modeling framework combining refractive ray tracing through an external global 3D coronal model with radiative transfer via the GRFF code. Ray-tube cross-sectional area S(s) is tracked via step-wise perturbation retracing, with a geometric magnification term d ln S/ds enforcing flux conservation. Thermal free-free emission and absorption are computed to generate synthetic maps at 40-800 MHz. Applied to Carrington rotation 2298, the framework is reported to reproduce the quiet-Sun background spectrum once propagation effects are included, while active-region brightness is less accurately modeled. The work positions itself as establishing a physics-based method for synthetic quiet-Sun images rather than claiming universal accuracy.
Significance. If the reproduction result holds with quantitative support, the framework supplies a reproducible, parameter-free (within the adopted 3D model) approach to generating low-frequency radio maps that incorporate refraction and free-free effects. This is useful for direct comparison with interferometric data and for isolating how propagation shapes observed morphology. The method builds directly on existing tools (global coronal model + GRFF) without introducing new free parameters or ad-hoc tuning, which strengthens its utility as a forward-modeling tool.
major comments (2)
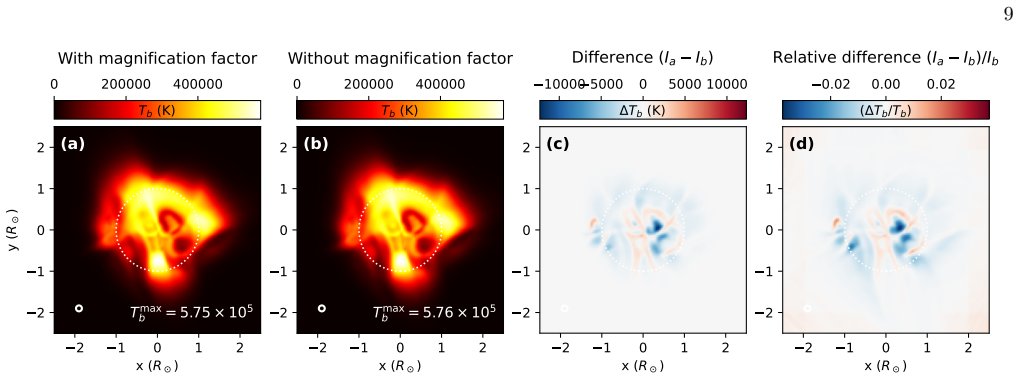
- [Results (CR 2298 application)] Results section (application to CR 2298): the central claim that 'including propagation effects allows the quiet-Sun background spectrum to be well reproduced' lacks accompanying quantitative metrics (e.g., reduced chi-squared, RMS residuals, or direct spectral comparison with error bars). Without these, it is not possible to evaluate whether the match is within observational uncertainties or merely qualitative.
- [Method (ray tracing)] Method section on ray-tube tracking: the step-wise perturbation retracing for S(s) and the d ln S/ds magnification term are described at a high level, but no explicit test (e.g., conservation check on a known analytic case or comparison against full ray-bundle integration) is provided to confirm numerical accuracy of the flux-conservation implementation.
minor comments (2)
- [Abstract] Abstract: the phrasing 'well reproduced' is qualitative; replace with a brief statement of the level of agreement once quantitative metrics are added in the main text.
- [Notation] Notation: ensure consistent use of S(s) for ray-tube area throughout; a short table summarizing symbols would aid readability.
Simulated Author's Rebuttal
We thank the referee for the constructive review and the recommendation of minor revision. We agree that both major comments identify areas where the manuscript can be strengthened with additional quantitative support and validation. We address each point below and will incorporate the suggested changes in the revised version.
read point-by-point responses
-
Referee: Results section (application to CR 2298): the central claim that 'including propagation effects allows the quiet-Sun background spectrum to be well reproduced' lacks accompanying quantitative metrics (e.g., reduced chi-squared, RMS residuals, or direct spectral comparison with error bars). Without these, it is not possible to evaluate whether the match is within observational uncertainties or merely qualitative.
Authors: We agree that the current presentation of the CR 2298 results relies primarily on visual comparison of spectra. In the revised manuscript we will add quantitative metrics, including RMS residuals between the modeled and observed quiet-Sun spectra and a direct spectral plot that includes observational error bars, to demonstrate that the reproduction lies within the reported uncertainties. revision: yes
-
Referee: Method section on ray-tube tracking: the step-wise perturbation retracing for S(s) and the d ln S/ds magnification term are described at a high level, but no explicit test (e.g., conservation check on a known analytic case or comparison against full ray-bundle integration) is provided to confirm numerical accuracy of the flux-conservation implementation.
Authors: We acknowledge that an explicit numerical validation test is absent. In the revised methods section (or a new appendix) we will include a conservation check performed on a spherically symmetric analytic corona model, comparing the step-wise perturbation results against the expected analytic flux conservation to confirm the accuracy of the ray-tube area tracking and magnification term. revision: yes
Circularity Check
No significant circularity identified
full rationale
The paper's central result is a forward-modeling application of ray tracing plus the external GRFF code to an independent 3D coronal model for CR 2298. The reproduction of the quiet-Sun spectrum follows directly from the physics-based propagation and radiative-transfer calculation; no equation or parameter is fitted inside the paper and then relabeled as a prediction, no self-citation supplies a load-bearing uniqueness theorem, and no ansatz is smuggled via prior work by the same authors. The derivation chain is therefore self-contained against external inputs.
Axiom & Free-Parameter Ledger
Reference graph
Works this paper leans on
-
[1]
Alissandrakis, C. E., Bastian, T. S., & Nindos, A. 2023, A&A, 670, C5, doi: 10.1051/0004-6361/202243774e
-
[2]
Bastian, T. S. 1994, ApJ, 426, 774, doi: 10.1086/174114
-
[3]
Dulk, G. A. 1985, ARA&A, 23, 169, doi: 10.1146/annurev.aa.23.090185.001125
-
[4]
Fleishman, G. D., Kuznetsov, A. A., & Landi, E. 2021, ApJ, 914, 52, doi: 10.3847/1538-4357/abf92c
-
[5]
P., Chen , X., Chrysaphi , N., et al
Kontar, E. P., Chen, X., Chrysaphi, N., et al. 2019, ApJ, 884, 122, doi: 10.3847/1538-4357/ab40bb
-
[6]
Kuznetsov, A. A., Fleishman, G. D., & Landi, E. 2026, Codes for computing the solar gyroresonance and free-free radio emissions, v1.0.1, Zenodo, doi: 10.5281/zenodo.19368163
-
[7]
Lionello, R., Linker, J. A., & Miki´ c, Z. 2009, ApJ, 690, 902, doi: 10.1088/0004-637X/690/1/902
-
[8]
Melnik, V. N., Shepelev, V. A., Poedts, S., et al. 2018, Solar Physics, 293, doi: 10.1007/s11207-018-1316-3
-
[9]
2015, Astronomy & Astrophysics, 583, doi: 10.1051/0004-6361/201425540 Miki´ c, Z., & Linker, J
Mercier, C., & Chambe, G. 2015, Astronomy & Astrophysics, 583, doi: 10.1051/0004-6361/201425540 Miki´ c, Z., & Linker, J. A. 1996, in American Institute of Physics Conference Series, Vol. 382, American Institute of Physics Conference Series, 104–107, doi: 10.1063/1.51370
-
[10]
Mondal, S., Shaik, S. B., Howard, R. A., et al. 2026, ApJ, 999, 237, doi: 10.3847/1538-4357/ae4353
-
[11]
S., Kathiravan, C., & Sastry, C
Ramesh, R., Nataraj, H. S., Kathiravan, C., & Sastry, C. V. 2006, The Astrophysical Journal, 648, 707, doi: 10.1086/505677
-
[12]
2020, The Astrophysical Journal, 903, doi: 10.3847/1538-4357/abb949
Sharma, R., & Oberoi, D. 2020, The Astrophysical Journal, 903, doi: 10.3847/1538-4357/abb949
-
[13]
Shibasaki, K., Alissandrakis, C. E., & Pohjolainen, S. 2011, SoPh, 273, 309, doi: 10.1007/s11207-011-9788-4
-
[14]
1971, A&A, 10, 362
Boischot, A. 1971, A&A, 10, 362
1971
-
[15]
Subramanian, K. R. 2004, Astronomy & Astrophysics, 426, 329, doi: 10.1051/0004-6361:20047120
-
[16]
Thejappa, G., MacDowall, R. J., & Gopalswamy, N. 2011, ApJ, 734, 16, doi: 10.1088/0004-637X/734/1/16
-
[17]
2018, A&A, 614, A54, doi: 10.1051/0004-6361/201630067
Vocks, C., Mann, G., Breitling, F., et al. 2018, A&A, 614, A54, doi: 10.1051/0004-6361/201630067
-
[18]
2024, Nature Astronomy, 8, 50, doi: 10.1038/s41550-023-02122-6
Yu, S., Chen, B., Sharma, R., et al. 2024, Nature Astronomy, 8, 50, doi: 10.1038/s41550-023-02122-6
-
[19]
2022, The Astrophysical Journal, 932, doi: 10.3847/1538-4357/ac6b37
Zhang, P., Zucca, P., Kozarev, K., et al. 2022, The Astrophysical Journal, 932, doi: 10.3847/1538-4357/ac6b37
-
[20]
Zirin, H., Baumert, B. M., & Hurford, G. J. 1991, The Astrophysical Journal, 370, 779, doi: 10.1086/169861
discussion (0)
Sign in with ORCID, Apple, or X to comment. Anyone can read and Pith papers without signing in.