Optimized Labeling Resource Allocation for Prediction-Assisted Inference via OPAL
Pith reviewed 2026-06-28 09:06 UTC · model grok-4.3
The pith
OPAL optimizes labeling policies within smooth classes to deliver valid finite-sample inference with far fewer labels.
A machine-rendered reading of the paper's core claim, the machinery that carries it, and where it could break.
Core claim
OPAL learns a labeling strategy within a tractable class of smooth policies to yield estimators with the lowest variance; the resulting pipeline achieves nominal coverage in finite samples and the accuracy one expects from methods which have far more labeled samples.
What carries the argument
OPAL (Optimized Policy for Allocation of Labels), which converts black-box uncertainty scores into a data-adaptive labeling strategy by optimizing inside a class of smooth policies.
If this is right
- Valid confidence intervals for odds ratios across demographic groups can be obtained from histopathology images with reduced labeling effort.
- The same optimized allocation works on datasets from computational social science and proteomics while retaining coverage.
- The pipeline removes brittleness caused by noisy uncertainty estimates without sacrificing statistical guarantees.
- Estimators achieve accuracy comparable to far larger labeled sets while using only the labels selected by the learned policy.
Where Pith is reading between the lines
- The approach could lower labeling costs in any domain where a predictive model already exists and labels are expensive to obtain.
- Extensions might test whether the same smooth-policy optimization improves other active-inference tasks such as estimating means or regression coefficients.
- If the smooth class is rich enough, similar gains may appear when the black-box model is replaced by newer architectures.
Load-bearing premise
Optimizing a labeling strategy inside a tractable class of smooth policies produces estimators with the lowest variance while preserving the provable guarantees of the active inference framework.
What would settle it
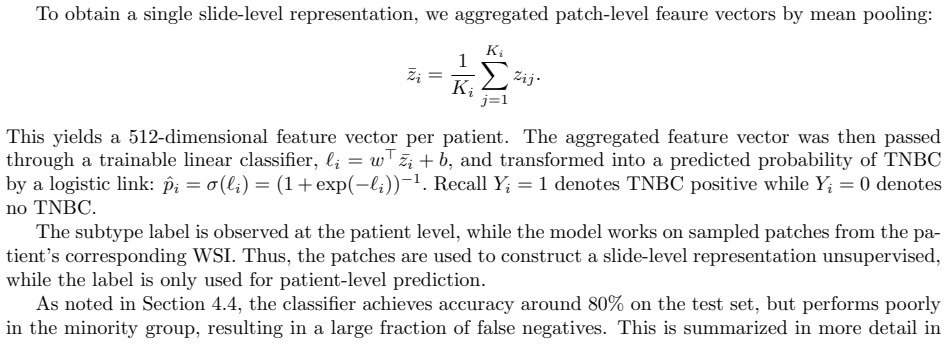
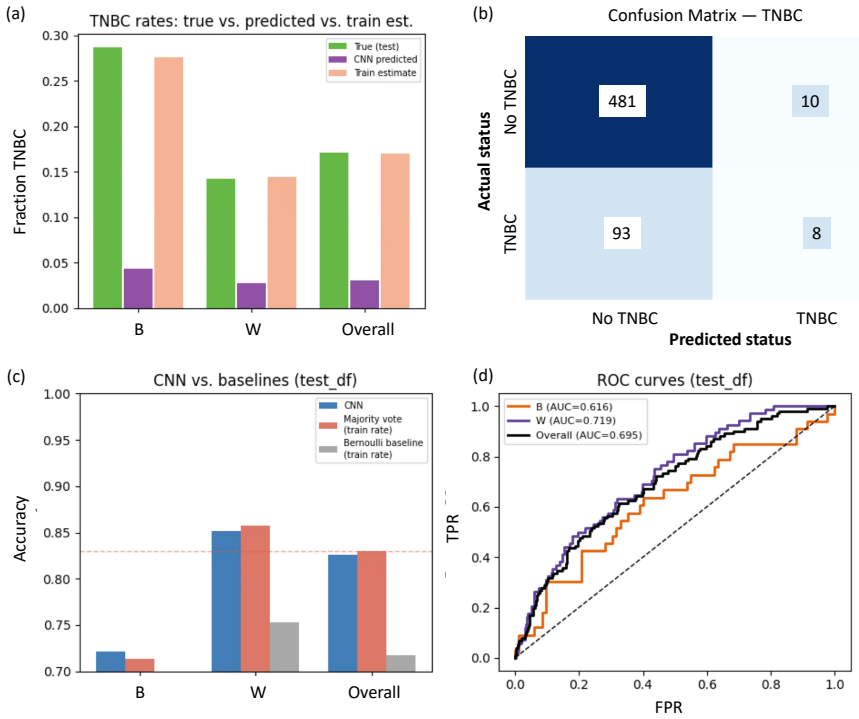
An experiment in which the coverage probability of OPAL confidence intervals falls materially below the nominal level on finite samples from the breast-cancer histopathology data would falsify the finite-sample guarantee.
Figures
read the original abstract
Active Statistical Inference is a new framework to make precise claims about population parameters with provable statistical guarantees. It uses a predictive "black-box" machine learning (ML) model to strategically decide which data points to label, roughly prioritizing samples for which the ML model is unsure about their label values. A major issue is that the framework can be brittle when uncertainty estimates are noisy. This paper introduces OPAL (Optimized Policy for Allocation of Labels), which learns a labeling strategy within a tractable class of smooth policies to yield estimators with the lowest variance. In effect, OPAL is an end-to-end pipeline that turns a black-box model's uncertainty scores into a data-adaptive labeling strategy and then performs inference on the collected samples. We evaluate OPAL on real datasets spanning medical imaging data, computational social science, and proteomics. As a concrete example, we consider predicting breast cancer subtype from histopathology images and using OPAL to form valid confidence intervals for odds ratios for different demographic groups. We show that OPAL achieves nominal coverage in finite samples and has the accuracy one expects from methods which have far more labeled samples.
Editorial analysis
A structured set of objections, weighed in public.
Referee Report
Summary. The manuscript introduces OPAL (Optimized Policy for Allocation of Labels), a method that optimizes labeling strategies within a class of smooth policies for active statistical inference. It uses ML uncertainty scores to adaptively select samples for labeling, aiming to produce estimators with minimal variance while maintaining the provable guarantees of the framework. The approach is evaluated on real-world datasets from medical imaging (breast cancer subtype prediction), computational social science, and proteomics, with a specific example on odds ratios by demographic groups. The central claim is that OPAL achieves nominal coverage in finite samples and accuracy comparable to methods using substantially more labeled data.
Significance. If the finite-sample coverage and variance reduction claims hold, this work could have significant impact on resource-efficient statistical inference in domains where labeling is costly, such as medical imaging and social science surveys. The end-to-end pipeline from black-box ML to adaptive labeling and inference represents a practical advancement in prediction-assisted inference methods.
major comments (2)
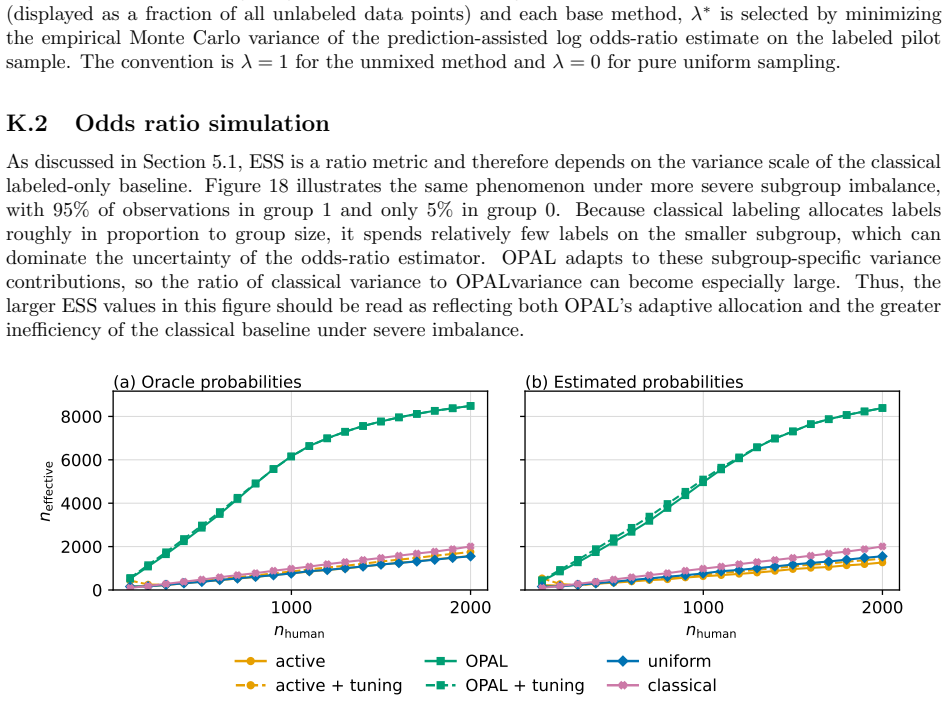
- [Abstract and Evaluation] Abstract and Evaluation: The claim that OPAL 'achieves nominal coverage in finite samples' is load-bearing for the paper's contribution, but the described experiments are conducted on real datasets (e.g., histopathology images, odds ratios) where the true parameter values are unknown. Coverage probability cannot be directly computed without ground truth, and the abstract provides no mention of accompanying simulation studies with known truth parameters that would allow verification of this claim. This issue must be addressed to support the central assertion.
- [Methods] Methods/Optimization: The premise that optimizing a labeling strategy inside a tractable class of smooth policies produces estimators with the lowest variance while preserving the provable guarantees requires an explicit derivation, algorithm, or validation procedure (e.g., the objective function or optimization routine used to learn the policy). Without this, the connection between the optimization and the claimed variance reduction remains unclear.
minor comments (2)
- The abstract could benefit from a brief mention of the specific optimization technique or loss function used for policy learning.
- Ensure that all datasets, evaluation metrics, and any simulation setups are clearly defined in the main text for reproducibility.
Simulated Author's Rebuttal
We thank the referee for their constructive comments on the coverage claims and the optimization details. We address each major point below and will revise the manuscript accordingly to strengthen the presentation of our results.
read point-by-point responses
-
Referee: [Abstract and Evaluation] Abstract and Evaluation: The claim that OPAL 'achieves nominal coverage in finite samples' is load-bearing for the paper's contribution, but the described experiments are conducted on real datasets (e.g., histopathology images, odds ratios) where the true parameter values are unknown. Coverage probability cannot be directly computed without ground truth, and the abstract provides no mention of accompanying simulation studies with known truth parameters that would allow verification of this claim. This issue must be addressed to support the central assertion.
Authors: We agree that coverage cannot be directly verified on real datasets without known ground truth. To support the finite-sample coverage claim, we will add a new simulation study section with known truth parameters to the revised manuscript. These simulations will be referenced in an updated abstract to explicitly demonstrate nominal coverage under controlled conditions, complementing the real-data results. revision: yes
-
Referee: [Methods] Methods/Optimization: The premise that optimizing a labeling strategy inside a tractable class of smooth policies produces estimators with the lowest variance while preserving the provable guarantees requires an explicit derivation, algorithm, or validation procedure (e.g., the objective function or optimization routine used to learn the policy). Without this, the connection between the optimization and the claimed variance reduction remains unclear.
Authors: The optimization is described in the Methods section, but we acknowledge the need for greater explicitness. In the revision we will add a detailed derivation of the variance objective function, the gradient-based optimization routine, and pseudocode for learning the smooth policy parameters while preserving the coverage guarantees. revision: yes
Circularity Check
No circularity detected; derivation chain self-contained with no reductions to inputs or self-citations
full rationale
The provided abstract and context describe OPAL as optimizing a labeling policy within a class of smooth policies to minimize variance, followed by inference with claimed finite-sample coverage. No equations, fitted parameters renamed as predictions, or self-citation chains are present in the text. The central claims rest on the active inference framework and policy optimization without any quoted step that reduces by construction to its own inputs. Evaluation on real datasets is described but does not exhibit self-definitional or fitted-input circularity. This is the expected honest non-finding for a methods paper whose abstract contains no load-bearing derivations.
Axiom & Free-Parameter Ledger
Reference graph
Works this paper leans on
-
[1]
A rewriting system for convex optimization problems
Akshay Agrawal, Steven Diamond, and Stephen Boyd. “A rewriting system for convex optimization problems”. In:Journal of Control and Decision5.1 (2018), pp. 42–60.doi:10.1080/23307706.2017. 1282058
-
[2]
Disciplined Geometric Programming
Akshay Agrawal, Steven Diamond, and Stephen Boyd. “Disciplined Geometric Programming”. In: Optimization Letters13.5 (2019), pp. 961–976
2019
-
[3]
Gustavo G. C. Amorim et al. “Two-Phase Sampling Designs for Data Validation in Settings with Covariate Measurement Error and Continuous Outcome”. In:Journal of the Royal Statistical Society: Series A184.4 (2021), pp. 1368–1389.doi:10.1111/rssa.12689
-
[4]
Anastasios N Angelopoulos et al.Cost-Optimal Active AI Model Evaluation. 2025. arXiv:2506.07949 [cs.LG].url:https://arxiv.org/abs/2506.07949
arXiv 2025
-
[5]
Anastasios N. Angelopoulos, John C. Duchi, and Tijana Zrnic.PPI++: Efficient Prediction-Powered Inference. 2024. arXiv:2311.01453 [stat.ML].url:https://arxiv.org/abs/2311.01453
Pith/arXiv arXiv 2024
-
[6]
Prediction-powered inference
Anastasios N. Angelopoulos et al. “Prediction-powered inference”. In:Science382.6671 (2023), pp. 669– 674
2023
-
[7]
MOSEK ApS
MOSEK ApS.The MOSEK Optimization Toolbox for Python 9.3.https://docs.mosek.com/latest/ python/. MOSEK ApS. Copenhagen, Denmark, 2022
2022
-
[8]
Policy Learning With Observational Data
S. Athey and S. Wager. “Policy Learning With Observational Data”. In:Econometrica89 (2021), pp. 133–161
2021
-
[9]
Bickel et al.Efficient and Adaptive Estimation for Semiparametric Models
Peter J. Bickel et al.Efficient and Adaptive Estimation for Semiparametric Models. Springer, 1993
1993
-
[10]
Patrick Billingsley.Probability and Measure. 3rd ed. Wiley, 1995
1995
-
[11]
The structural context of posttranslational modifications at a proteome-wide scale
I Bludau et al. “The structural context of posttranslational modifications at a proteome-wide scale”. In:PLoS Biology20.5 (2022), e3001636
2022
-
[12]
Carl de Boor.A Practical Guide to Splines. Vol. 27. Applied Mathematical Sciences. New York: Springer, 1978.isbn: 978-0387953663. 27
1978
-
[13]
A Tutorial on Geometric Programming
Stephen Boyd et al. “A Tutorial on Geometric Programming”. In:Optimization and Engineering8.1 (2007), pp. 67–127.doi:10.1007/s11081-007-9001-7
-
[14]
Norman E. Breslow et al. “Improved Horvitz–Thompson Estimation of Model Parameters from Two- Phase Stratified Samples: Applications in Epidemiology”. In:Statistics in Biosciences1.1 (2009), pp. 32–49.doi:10.1007/s12561-009-9001-6
-
[15]
Surrogate-Powered Inference: Regularization and Adaptivity
Jianmin Chen et al. “Surrogate-Powered Inference: Regularization and Adaptivity”. In:arXiv preprint arXiv:2512.21826(2025).doi:10.48550/arXiv.2512.21826.url:https://arxiv.org/abs/2512. 21826
work page doi:10.48550/arxiv.2512.21826.url:https://arxiv.org/abs/2512 2025
-
[16]
Double/Debiased Machine Learning for Treatment and Structural Param- eters
Victor Chernozhukov et al. “Double/Debiased Machine Learning for Treatment and Structural Param- eters”. In:The Econometrics Journal21.1 (2018), pp. C1–C68.doi:10.1111/ectj.12097
-
[18]
Cochran.Sampling Techniques
William G. Cochran.Sampling Techniques. 3rd ed. New York: John Wiley & Sons, 1977
1977
-
[19]
On the limits of cross-domain generalization in automated X-ray prediction
Joseph Paul Cohen et al. “On the limits of cross-domain generalization in automated X-ray prediction”. In:Medical Imaging with Deep Learning. 2020.url:https://arxiv.org/abs/2002.02497
arXiv 2020
-
[20]
TorchXRayVision: A library of chest X-ray datasets and models
Joseph Paul Cohen et al. “TorchXRayVision: A library of chest X-ray datasets and models”. In:Medical Imaging with Deep Learning. 2022.url:https://github.com/mlmed/torchxrayvision
2022
-
[21]
On P´ olya Frequency Functions. IV. The Fundamental Spline Functions and Their Limits
H. B. Curry and I. J. Schoenberg. “On P´ olya Frequency Functions. IV. The Fundamental Spline Functions and Their Limits”. In:Journal d’Analyse Math´ ematique17 (1966), pp. 71–107.doi:10. 1007/BF02788653
1966
-
[22]
CVXPY: A Python-Embedded Modeling Language for Convex Optimization
Steven Diamond and Stephen Boyd. “CVXPY: A Python-Embedded Modeling Language for Convex Optimization”. In:The Journal of Machine Learning Research17.83 (2016), pp. 1–5.url:http : //jmlr.org/papers/v17/15-291.html
2016
-
[23]
Can Unconfident LLM Annotations Be Used for Confident Conclusions?
Kristina Gligoric et al. “Can Unconfident LLM Annotations Be Used for Confident Conclusions?” In: Proceedings of the 2025 Conference of the Nations of the Americas Chapter of the Association for Com- putational Linguistics: Human Language Technologies (Volume 1: Long Papers). Ed. by Luis Chiruzzo, Alan Ritter, and Lu Wang. Albuquerque, New Mexico: Associa...
2025
-
[24]
Asymptotic Normality of Simple Linear Rank Statistics under Alternatives
Jaroslav H´ ajek. “Asymptotic Normality of Simple Linear Rank Statistics under Alternatives”. In:Pro- ceedings of the Sixth Berkeley Symposium on Mathematical Statistics and Probability. Vol. 1. Berkeley: University of California Press, 1972, pp. 139–152
1972
-
[25]
A Generalization of Sampling Without Replacement from a Finite Universe
D. G. Horvitz and D. J. Thompson. “A Generalization of Sampling Without Replacement from a Finite Universe”. In:Journal of the American Statistical Association47.260 (1952), pp. 663–685.doi: 10.1080/01621459.1952.10483446
-
[26]
Jeremy Irvin et al. “CheXpert: a large chest radiograph dataset with uncertainty labels and expert com- parison”. In:Proceedings of the Thirty-Third AAAI Conference on Artificial Intelligence and Thirty- First Innovative Applications of Artificial Intelligence Conference and Ninth AAAI Symposium on Educational Advances in Artificial Intelligence. AAAI’19/...
-
[27]
Stanford AIMI, 2019.doi:10.71718/ y7pj-4v93.url:https://doi.org/10.71718/y7pj-4v93
Jeremy Irvin et al.CheXpert: Chest X-rays Dataset, Version 1.0. Stanford AIMI, 2019.doi:10.71718/ y7pj-4v93.url:https://doi.org/10.71718/y7pj-4v93
-
[28]
Wenlong Ji, Lihua Lei, and Tijana Zrnic.Predictions as Surrogates: Revisiting Surrogate Outcomes in the Age of AI. 2025. arXiv:2501.09731 [stat.ML].url:https://arxiv.org/abs/2501.09731
Pith/arXiv arXiv 2025
-
[29]
Breast cancer histopathological image classification using convolutional neural networks with small SE-ResNet module
Y. Jiang et al. “Breast cancer histopathological image classification using convolutional neural networks with small SE-ResNet module.” In:PLoS One(2019)
2019
-
[30]
MIMIC-CXR, a de-identified publicly available database of chest radio- graphs with free-text reports
Alistair E. W. Johnson et al. “MIMIC-CXR, a de-identified publicly available database of chest radio- graphs with free-text reports”. In:Nature Scientific Data6 (2019).doi:10.1038/s41597-019-0322-0. url:https://doi.org/10.1038/s41597-019-0322-0. 28
-
[31]
Brady Kieffer et al. “Convolutional neural networks for histopathology image classification: Training vs. Using pre-trained networks”. In:2017 Seventh International Conference on Image Processing Theory, Tools and Applications (IPTA). 2017, pp. 1–6.doi:10.1109/IPTA.2017.8310149
-
[32]
Who Should Be Treated? Empirical Welfare Maximization Methods for Treatment Choice
Toru Kitagawa and Aleksey Tetenov. “Who Should Be Treated? Empirical Welfare Maximization Methods for Treatment Choice”. In:Econometrica86.2 (Mar. 2018), pp. 591–616.doi:10 . 3982 / ECTA13288
2018
-
[33]
M-estimation under Two-Phase Multiwave Sampling with Appli- cations to Prediction-Powered Inference
Dan M. Kluger and Stephen Bates. “M-estimation under Two-Phase Multiwave Sampling with Appli- cations to Prediction-Powered Inference”. In:arXiv preprint arXiv:2602.16933(2026).doi:10.48550/ arXiv.2602.16933.url:https://arxiv.org/abs/2602.16933
arXiv 2026
-
[34]
Prediction-Powered Inference with Imputed Covariates and Nonuniform Sam- pling
Dan M. Kluger et al. “Prediction-Powered Inference with Imputed Covariates and Nonuniform Sam- pling”. In:arXiv preprint arXiv:2501.18577(2025).doi:10.48550/arXiv.2501.18577.url:https: //arxiv.org/abs/2501.18577
-
[35]
Puheng Li, Tijana Zrnic, and Emmanuel Cand` es.Robust Sampling for Active Statistical Inference
-
[36]
arXiv:2511.08991 [stat.ML].url:https://arxiv.org/abs/2511.08991
-
[37]
Detecting Stance in Media On Global Warming
Yiwei Luo, Dallas Card, and Dan Jurafsky. “Detecting Stance in Media On Global Warming”. In: Findings of the Association for Computational Linguistics: EMNLP 2020. Ed. by Trevor Cohn, Yulan He, and Yang Liu. Online: Association for Computational Linguistics, Nov. 2020, pp. 3296–3315.doi: 10 . 18653 / v1 / 2020 . findings - emnlp . 296.url:https : / / acla...
2020
-
[38]
Accessed: 2025-11-05
Mayo Clinic Staff.Enlarged heart — Symptoms & causes. Accessed: 2025-11-05. May 2022.url: https://www.mayoclinic.org/diseases- conditions/enlarged- heart/symptoms- causes/syc- 20355436
2025
-
[39]
Task-Agnostic Machine-Learning-Assisted Inference
Jiacheng Miao and Qiongshi Lu. “Task-Agnostic Machine-Learning-Assisted Inference”. In:arXiv preprint arXiv:2405.20039(2024).doi:10.48550/arXiv.2405.20039.url:https://arxiv.org/ abs/2405.20039
work page doi:10.48550/arxiv.2405.20039.url:https://arxiv.org/ 2024
-
[40]
The knowledge-gradient algorithm for sequencing experiments in drug discovery
Diana M. Negoescu, Peter I. Frazier, and Warren B. Powell. “The knowledge-gradient algorithm for sequencing experiments in drug discovery”. In:INFORMS Journal on Computing23.3 (2011), pp. 346– 363.doi:10.1287/ijoc.1100.0417
-
[41]
On the two different aspects of the representative method: the method of stratified sampling and the method of purposive selection
Jerzy Neyman. “On the two different aspects of the representative method: the method of stratified sampling and the method of purposive selection”. In:Journal of the Royal Statistical Society97.4 (1934), pp. 558–625
1934
-
[42]
Monotone Regression Splines in Action
J. O. Ramsay. “Monotone Regression Splines in Action”. In:Statistical Science3.4 (1988), pp. 425– 441.doi:10.1214/ss/1177012761
-
[43]
Practical considerations for active machine learning in drug discovery
Daniel Reker. “Practical considerations for active machine learning in drug discovery”. In:Drug Dis- covery Today: Technologies32–33 (2019), pp. 73–79.doi:10.1016/j.ddtec.2020.06.001
-
[44]
Active-learning strategies in computer-assisted drug discovery
Daniel Reker and Gisbert Schneider. “Active-learning strategies in computer-assisted drug discovery”. In:Drug Discovery Today20.4 (2015), pp. 458–465.doi:10.1016/j.drudis.2014.12.004
-
[45]
July 2022.url: https://sites.stat.columbia.edu/bodhi/Talks/Emp-Proc-Lecture-Notes.pdf
Bodhisattva Sen.A Gentle Introduction to Empirical Process Theory and Applications. July 2022.url: https://sites.stat.columbia.edu/bodhi/Talks/Emp-Proc-Lecture-Notes.pdf
2022
-
[46]
Serfling.Approximation Theorems of Mathematical Statistics
Robert J. Serfling.Approximation Theorems of Mathematical Statistics. New York: John Wiley & Sons, 1980
1980
-
[47]
Shanshan Song, Xihong Lin, and Yong Zhou. “A General M-estimation Theory in Semi-Supervised Framework”. In:Journal of the American Statistical Association119.546 (2024), pp. 1065–1075.doi: 10.1080/01621459.2023.2169699
-
[48]
Breast cancer histopathological image classification using Convolu- tional Neural Networks
Fabio Alexandre Spanhol et al. “Breast cancer histopathological image classification using Convolu- tional Neural Networks”. In:2016 International Joint Conference on Neural Networks (IJCNN). 2016, pp. 2560–2567.doi:10.1109/IJCNN.2016.7727519. 29
-
[49]
Lorenzo Testa et al. “Semiparametric Semi-Supervised Learning for General Targets Under Distribution Shift and Decaying Overlap”. In:arXiv preprint arXiv:2505.06452(2025).doi:10 . 48550 / arXiv . 2505.06452.url:https://arxiv.org/abs/2505.06452
Pith/arXiv arXiv 2025
-
[50]
Semi-Supervised Regression Analysis with Model Misspeci- fication and High-Dimensional Data
Ye Tian, Peng Wu, and Zhiqiang Tan. “Semi-Supervised Regression Analysis with Model Misspeci- fication and High-Dimensional Data”. In:arXiv preprint arXiv:2406.13906(2024).doi:10.48550/ arXiv.2406.13906.url:https://arxiv.org/abs/2406.13906
arXiv 2024
-
[51]
Knapsack Based Optimal Policies for Budget-Limited Multi-Armed Bandits
Long Tran-Thanh et al. “Knapsack Based Optimal Policies for Budget-Limited Multi-Armed Bandits”. In:Proceedings of the Twenty-Sixth AAAI Conference on Artificial Intelligence (AAAI-12). AAAI Press, 2012, pp. 1134–1140
2012
-
[52]
A. W. van der Vaart and Jon A. Wellner.Weak Convergence and Empirical Processes. 2nd ed. Springer, 2023
2023
-
[53]
van der Vaart.Asymptotic Statistics
A.W. van der Vaart.Asymptotic Statistics. 1st ed. Cambridge University Press, 1998
1998
-
[54]
van der Laan and Sherri Rose.Targeted Learning in Data Science: Causal Inference for Complex Longitudinal Studies
Mark J. van der Laan and Sherri Rose.Targeted Learning in Data Science: Causal Inference for Complex Longitudinal Studies. Springer, 2018
2018
-
[55]
Targeted Maximum Likelihood Learning
Mark J. van der Laan and Daniel Rubin. “Targeted Maximum Likelihood Learning”. In:International Journal of Biostatistics2.1 (2006), Article 11
2006
-
[56]
Smoothing Noisy Data with Spline Functions
Grace Wahba. “Smoothing Noisy Data with Spline Functions”. In:Numerische Mathematik24.5 (1975), pp. 383–393.doi:10.1007/BF01437407
-
[57]
Annotation-efficient deep learning for automatic medical image segmentation
Shanshan Wang et al. “Annotation-efficient deep learning for automatic medical image segmentation”. In:Nature Communications12.1 (2021), p. 5915.doi:10.1038/s41467-021-26216-9
-
[58]
Active learning in the drug discovery process
Manfred K. Warmuth et al. “Active learning in the drug discovery process”. In:Advances in Neural Information Processing Systems. Vol. 14. 2001, pp. 1449–1456
2001
-
[59]
Active Learning with Support Vector Machines in the Drug Discovery Process
Manfred K. Warmuth et al. “Active Learning with Support Vector Machines in the Drug Discovery Process”. In:Journal of Chemical Information and Computer Sciences43.2 (2003), pp. 667–673.doi: 10.1021/ci025620t
-
[60]
Wellner.Notes on the H´ ajek projection and Hoeffding Decomposition
Jon A. Wellner.Notes on the H´ ajek projection and Hoeffding Decomposition. May 2011.url:https: //sites.stat.washington.edu/jaw/COURSES/580s/581/HO/HajekProj-HoeffdingExp.pdf
2011
-
[61]
Zichun Xu, Daniela Witten, and Ali Shojaie.A Unified Framework for Semiparametrically Efficient Semi-Supervised Learning. 2025. arXiv:2502.17741 [math.ST].url:https://arxiv.org/abs/2502. 17741
arXiv 2025
-
[62]
Ziyan Yin et al. “A Cost-Effective Chart Review Sampling Design to Account for Phenotyping Error in Electronic Health Records (EHR) Data”. In:Journal of the American Medical Informatics Association 29.1 (2022), pp. 52–61.doi:10.1093/jamia/ocab222
-
[63]
Yuqian Zhang, Abhishek Chakrabortty, and Jelena Bradic. “Double Robust Semi-Supervised Infer- ence for the Mean: Selection Bias under MAR Labeling with Decaying Overlap”. In:Information and Inference: A Journal of the IMA12.3 (2023), pp. 2066–2159.doi:10.1093/imaiai/iaad021
-
[64]
Active statistical inference
Tijana Zrnic and Emmanuel J. Cand` es. “Active statistical inference”. In:Proceedings of the 41st International Conference on Machine Learning. ICML’24. Vienna, Austria: JMLR.org, 2024
2024
-
[65]
Cross-prediction-powered inference
Tijana Zrnic and Emmanuel J. Cand` es. “Cross-prediction-powered inference”. In:Proceedings of the National Academy of Sciences121.5 (2024), e2322083121. 30 Appendix A Related literature 32 A.1 Neyman Allocation . . . . . . . . . . . . . . . . . . . . . . . . . . . . . . . . . . . . . . . . 32 A.2 Two-phase, validation, and surrogate-assisted sampling . ....
2024
-
[66]
Compute the point estimate ˆθusing the queried labels and the chosen augmentationa i
-
[67]
Compute the usual variance estimateV θ,int used in the superpopulation-style Wald interval
-
[68]
Unqueried units do not contribute to ˆVk,HT, since their contribution is multiplied byξ i = 0
For each queried unit, computeR i =Y i −a i. Unqueried units do not contribute to ˆVk,HT, since their contribution is multiplied byξ i = 0
-
[69]
Compute ˆV1,HT and ˆV0,HT, then combine them through the Delta method to obtain ˆVθ,HT
-
[70]
Report the finite-population-calibrated interval ˆθ±z 1−α/2 q ˆVθ,HT
-
[71]
Report ˆγθ =V θ,int/ ˆVθ,HT as a diagnostic of the variance inflation of the usual Wald interval relative to the finite-population conditional variance. This calibration is used only for coverage evaluation against the fixed finite-population benchmarkθ N. It does not replace the usual superpopulation interval when the inferential target isθ(P). J Additio...
arXiv 2024
discussion (0)
Sign in with ORCID, Apple, or X to comment. Anyone can read and Pith papers without signing in.