Spectral Handling and Estimation of AGN Parameters (SHEAP), The first AGN fitting GPU-based code
Pith reviewed 2026-06-28 08:58 UTC · model grok-4.3
The pith
SHEAP fits AGN spectra reliably using JAX on GPUs at roughly 1/60 the runtime of pPXF.
A machine-rendered reading of the paper's core claim, the machinery that carries it, and where it could break.
Core claim
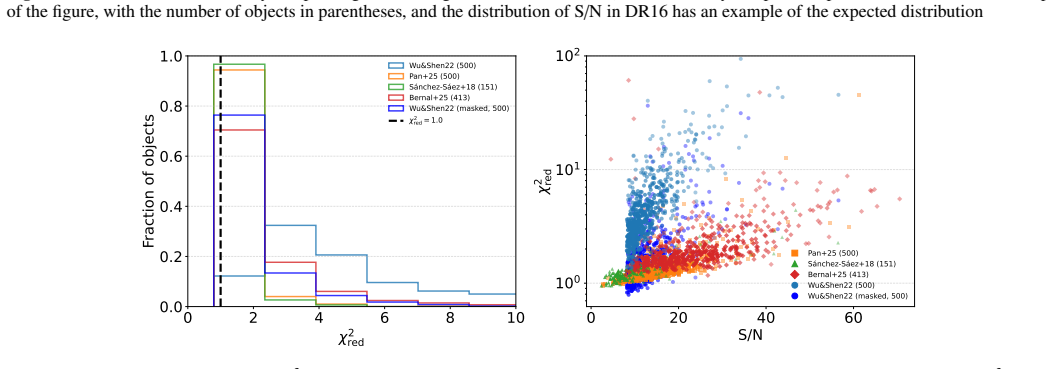
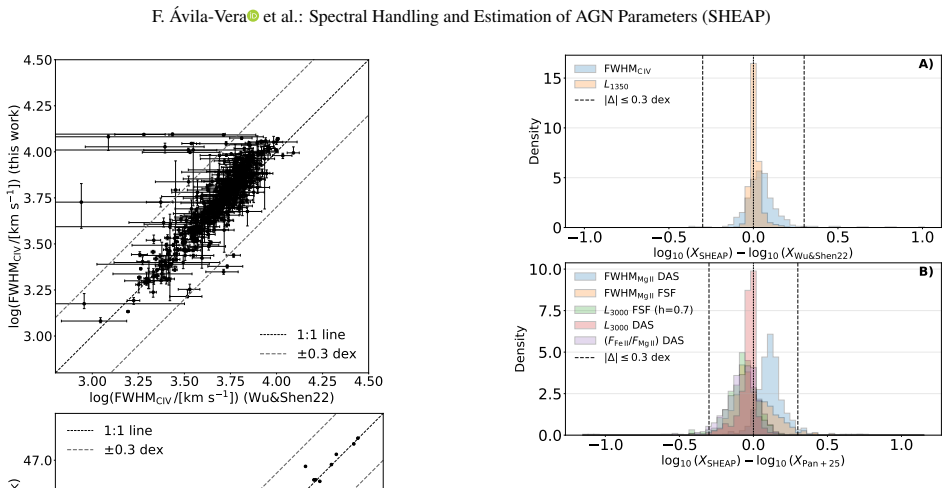
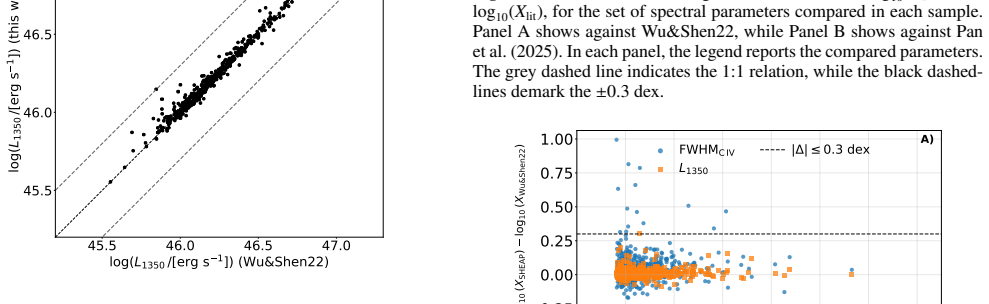
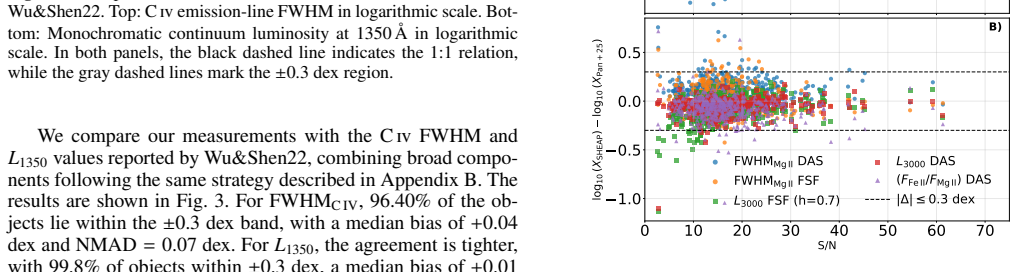
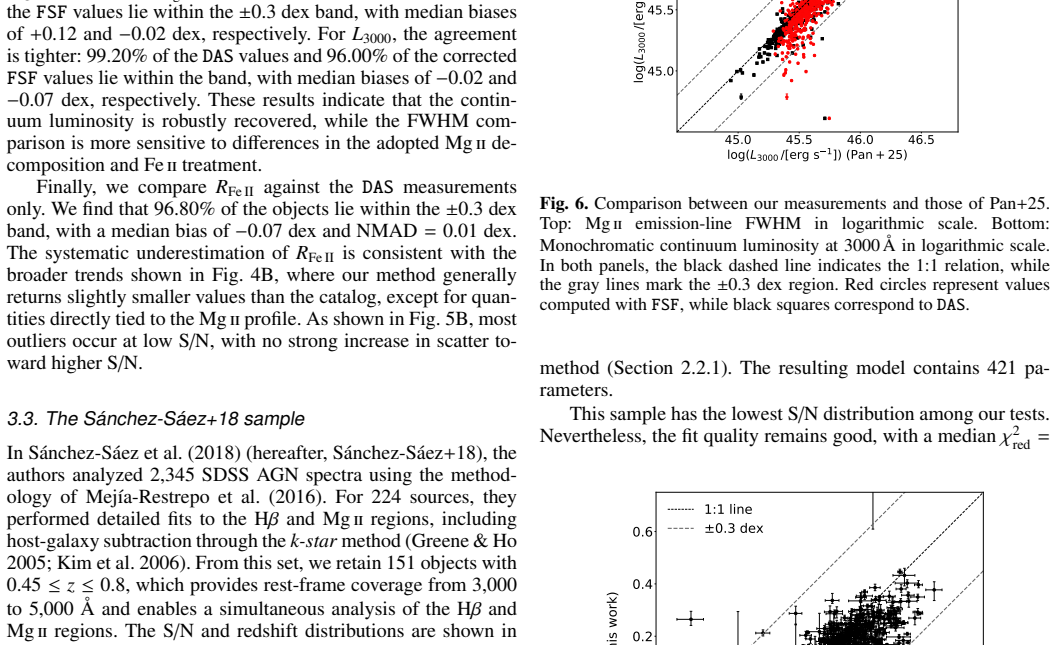
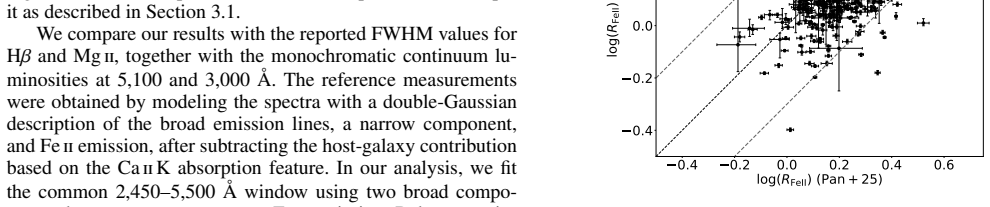
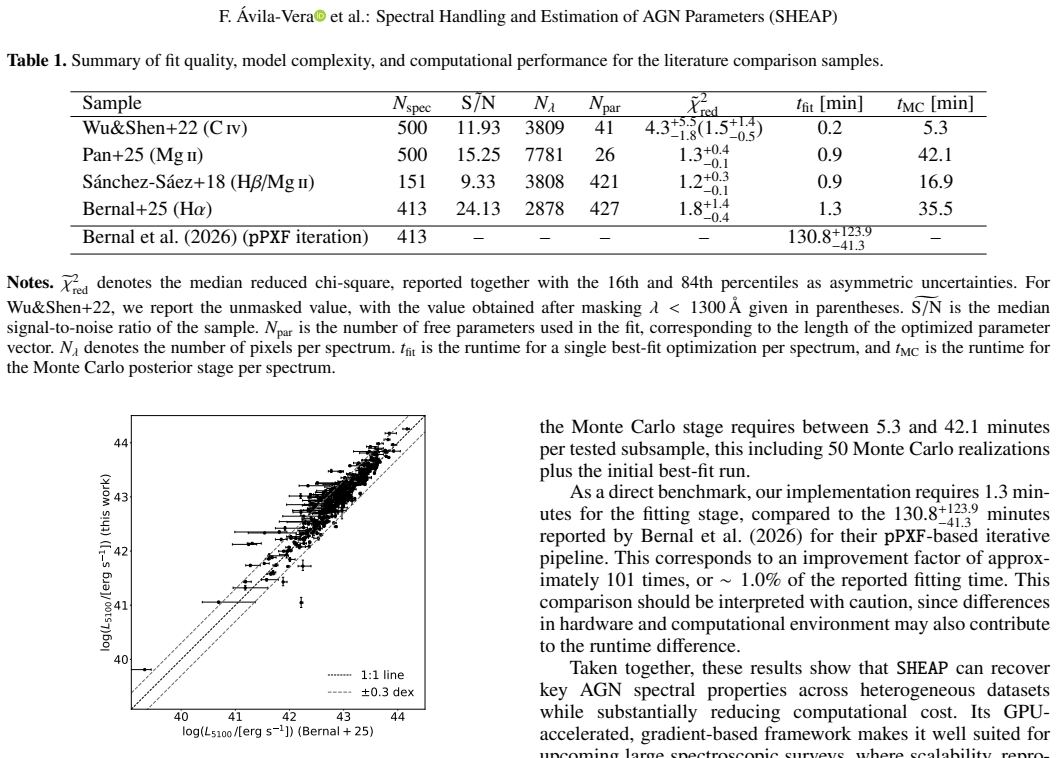
SHEAP delivers reliable AGN spectral decompositions at substantially lower computational cost. Across four comparison samples the recovered parameters agree with prior measurements to the level that 85 to 100 percent of objects lie inside the plus or minus 0.3 dex band, reduced chi-square distributions are close to unity, and the fitting stage requires only about 1.7 percent of the computational time reported by pPXF.
What carries the argument
A JAX-based modular spectral model combining continuum, host-galaxy template, FeII pseudo-continuum, and multi-component emission lines, optimized with gradient descent, automatic differentiation, vectorization, and just-in-time compilation under parameter-tying and physically motivated constraints.
If this is right
- Upcoming large spectroscopic surveys can be processed at scale without sacrificing physical constraints or uncertainty quantification.
- Stable convergence is achieved in the H beta region where previous methods often require manual intervention.
- The same modular structure can be applied to the CIV, MgII, and H alpha regions with comparable accuracy.
- Reproducibility is improved because the model is defined in code rather than through interactive GUI choices.
Where Pith is reading between the lines
- The reported speedup opens the possibility of exploring larger parameter spaces or adding more emission-line components that were previously too expensive.
- Because the code is written in JAX it can be combined with differentiable pipelines for joint photometric-spectroscopic inference.
- The modular design could be extended to time-variable spectra by treating epoch-to-epoch parameters as additional tied variables.
Load-bearing premise
The chosen modular components and tying rules reproduce real AGN spectra without introducing systematic bias, especially in blended regions such as H beta.
What would settle it
A blind test on an independent AGN sample in which more than 15 percent of the SHEAP-derived line widths or fluxes fall outside the plus or minus 0.3 dex band relative to an established pipeline while the reduced chi-square remains near unity.
Figures
read the original abstract
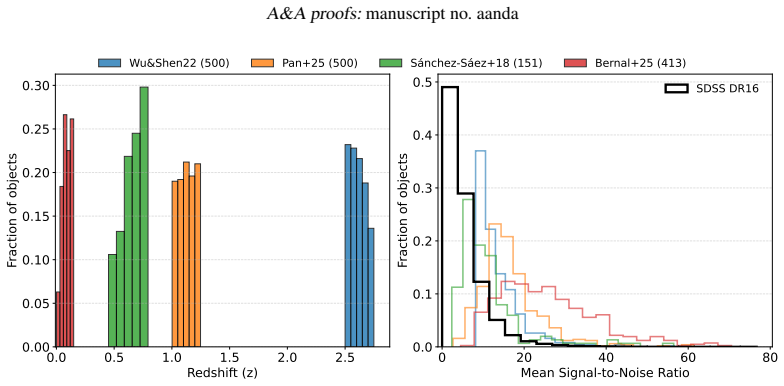
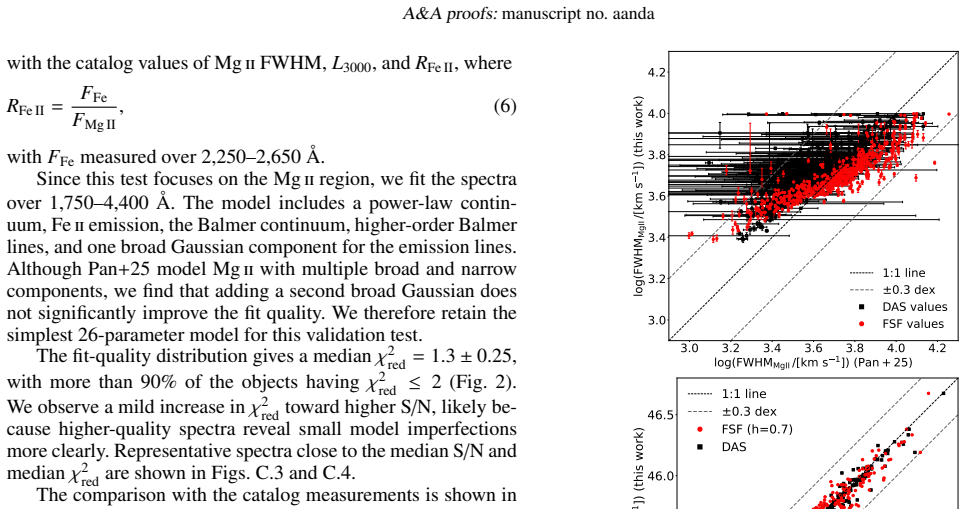
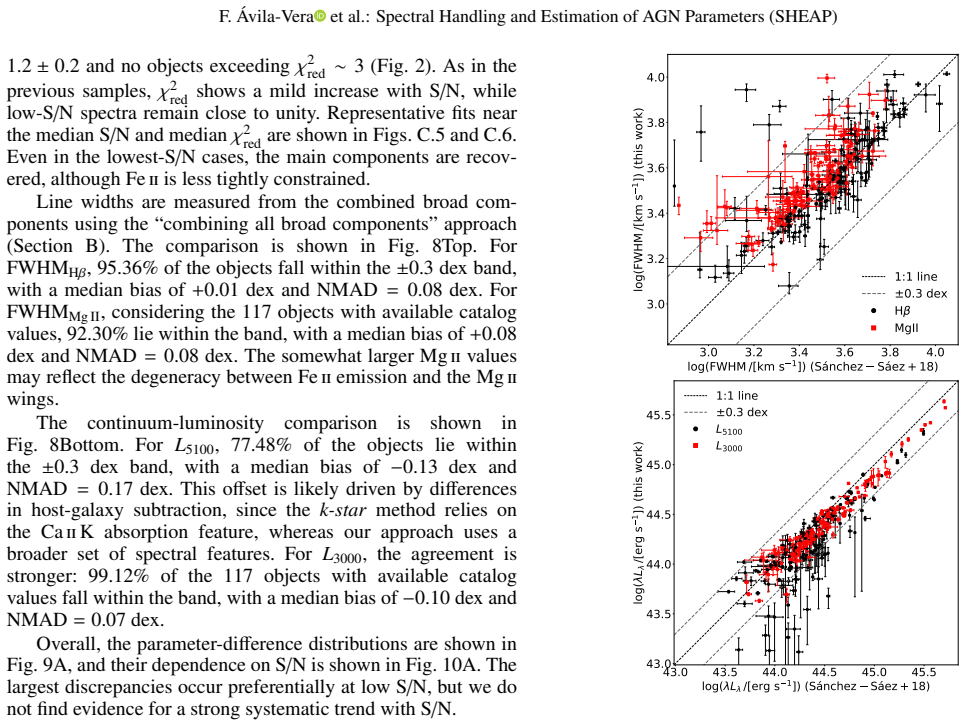
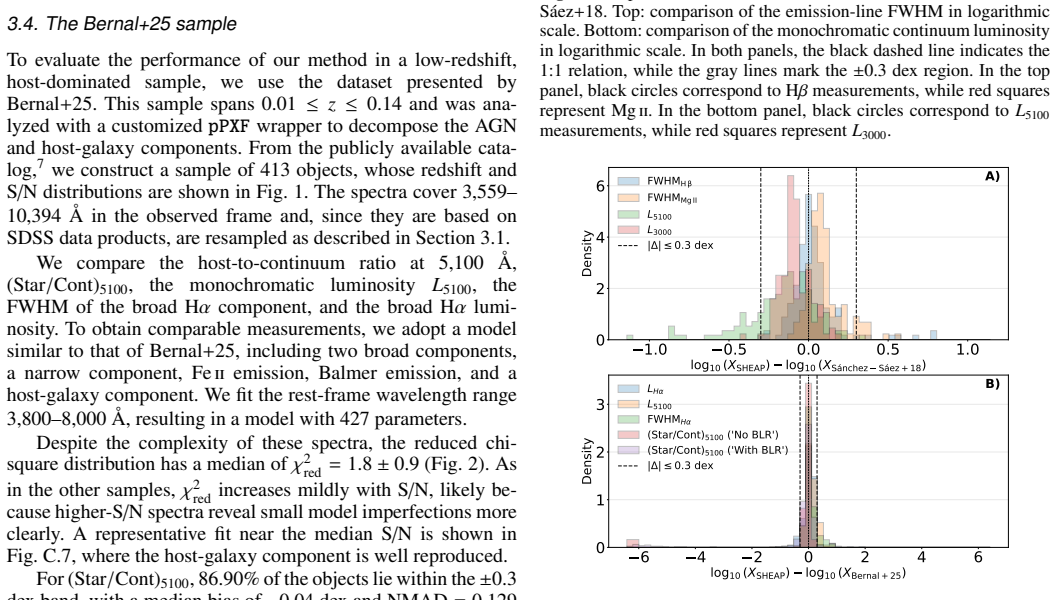
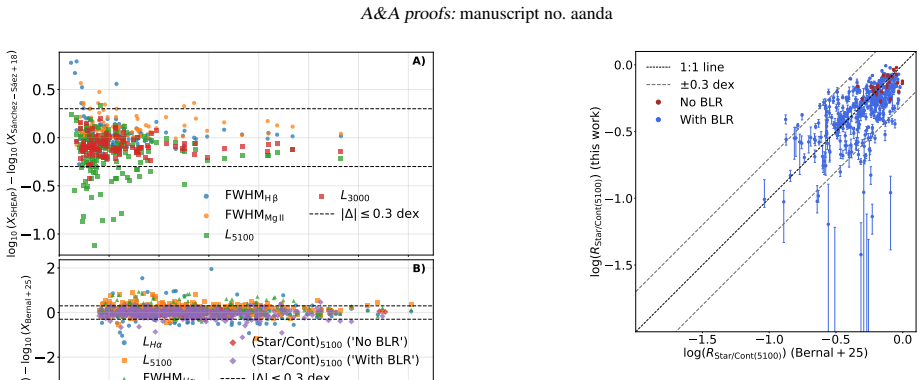
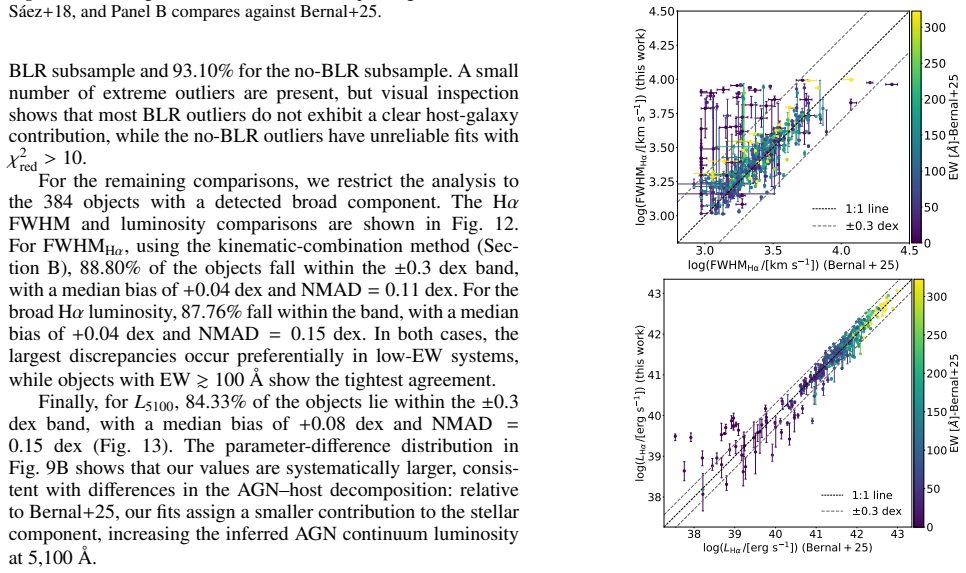
In the coming years, the number of discovered active galactic nuclei (AGN) is expected to increase significantly due to upcoming spectroscopic surveys. This growth will challenge current analysis and modeling techniques, requiring scalable methods for large, heterogeneous datasets with diverse signal-to-noise ratios, spectral resolutions, and host-galaxy contamination. We present SHEAP (Spectral Handling and Estimation of AGN Parameters), a spectral-fitting framework designed to analyze large AGN samples efficiently while preserving physical interpretability, reproducibility, and robust uncertainty estimation. SHEAP uses JAX, a Python GPU-powered framework, to implement a flexible model with modular components, including continuum, host galaxy, FeII pseudo-continuum, and multi-component emission lines, together with parameter tying and physically motivated constraints. By combining gradient-based optimization with automatic differentiation, vectorization, and just-in-time compilation, SHEAP achieves stable convergence in blended regions, such as H$\beta$, while substantially reducing runtime. We compare SHEAP measurements with literature results and public fitting pipelines across four samples covering the CIV, MgII, H$\beta$, and H$\alpha$ regions. We find good agreement for the main AGN spectral parameters, with $\sim85$--$100%$ of objects lying within the $\pm0.3$ dex band and reduced chi-square distributions close to unity. Relative to the runtime reported by \citet{2026Bernal} using \texttt{pPXF}, the fitting stage requires only $\sim1.7%$ of the computational time, corresponding to an improvement of approximately $100$ times. These results show that \texttt{SHEAP} delivers reliable AGN spectral decompositions at substantially lower computational cost, making it suitable for massive spectroscopic datasets.
Editorial analysis
A structured set of objections, weighed in public.
Referee Report
Summary. The paper presents SHEAP, a JAX-based GPU-accelerated framework for fitting AGN spectra using modular components (continuum, host galaxy, FeII pseudo-continuum, and multi-component emission lines with tying rules and constraints). It reports good agreement with literature values across CIV, MgII, Hβ, and Hα regions (~85–100% of objects within ±0.3 dex, reduced χ² near unity) and a ~100× speedup in the fitting stage relative to pPXF (~1.7% of the reported runtime).
Significance. If the performance and reliability claims hold, SHEAP could enable scalable processing of large spectroscopic AGN samples from upcoming surveys while maintaining physical interpretability. The use of automatic differentiation, vectorization, and JIT compilation for gradient-based optimization is a clear technical strength for reproducibility and speed. However, the validation relies entirely on agreement with external pipelines rather than independent tests, which limits the strength of the reliability conclusion.
major comments (2)
- [Abstract and §4 (comparison)] Abstract and comparison section: the central reliability claim rests on 85–100% of objects lying within the ±0.3 dex band and reduced χ² ≈ 1, but the manuscript provides no details on model implementation, convergence criteria, or how error bars were derived from the JAX optimization; this directly limits verification of the performance claim.
- [Method (§3) and Results (§4)] Method and results sections: the modular model with tying rules for blended regions such as Hβ is presented as physically motivated, yet no cross-check against independent constraints (reverberation mapping, photoionization grids, or untied profile fits) is shown; agreement with other pipelines that may employ comparable FeII templates and tying can occur even if both are systematically offset from truth.
minor comments (2)
- [Title and Introduction] The title's claim of being 'the first AGN fitting GPU-based code' should be supported by a brief literature survey in the introduction to avoid overstatement.
- [Figures and Tables] Figure captions and table legends lack explicit definitions of the exact parameter sets being compared (e.g., which line widths or fluxes are included in the ±0.3 dex statistic).
Simulated Author's Rebuttal
We thank the referee for the constructive comments, which help clarify the presentation of SHEAP's reliability and validation. We respond to each major comment below.
read point-by-point responses
-
Referee: Abstract and §4 (comparison): the central reliability claim rests on 85–100% of objects lying within the ±0.3 dex band and reduced χ² ≈ 1, but the manuscript provides no details on model implementation, convergence criteria, or how error bars were derived from the JAX optimization; this directly limits verification of the performance claim.
Authors: We agree that explicit details on these technical aspects are required for independent verification. In the revised manuscript we will expand §3 with a new subsection describing the modular JAX model structure, the gradient-based optimizer settings, the convergence criteria (gradient-norm tolerance and iteration limits), and the uncertainty estimation procedure based on the Hessian via JAX's automatic differentiation. These additions will directly support the claims in the abstract and §4. revision: yes
-
Referee: Method (§3) and Results (§4): the modular model with tying rules for blended regions such as Hβ is presented as physically motivated, yet no cross-check against independent constraints (reverberation mapping, photoionization grids, or untied profile fits) is shown; agreement with other pipelines that may employ comparable FeII templates and tying can occur even if both are systematically offset from truth.
Authors: We concur that external physical constraints would provide stronger validation than pipeline-to-pipeline agreement alone. Reverberation-mapping lags and photoionization grids are unavailable for the majority of the test objects, so a full cross-check is not feasible with the current samples. We will revise §4 and the discussion to explicitly acknowledge this limitation, to frame the multi-pipeline comparison as a consistency test, and to outline how future work could incorporate available RM subsets. We will also add a short comparison of tied versus untied fits on a representative sub-sample. revision: partial
Circularity Check
No circularity: implementation validated against external literature benchmarks
full rationale
The paper introduces a software tool (SHEAP) for spectral fitting and validates its parameter outputs via direct comparison to independent literature pipelines on four samples, reporting agreement fractions and reduced chi-square values. Computational speedup is stated relative to a previously reported pPXF runtime from a cited work. No derivation chain exists that reduces a claimed prediction or physical result to the paper's own fitted parameters or self-citations by construction. The core claims rest on external agreement rather than internal re-use of fitted quantities.
Axiom & Free-Parameter Ledger
axioms (1)
- domain assumption The modular components (continuum, host galaxy, FeII, multi-component lines) plus tying and physical constraints accurately model AGN spectra
Reference graph
Works this paper leans on
-
[1]
Error estimation in astronomy: A guide
Andrae, R. 2010, arXiv e-prints, arXiv:1009.2755
work page internal anchor Pith review Pith/arXiv arXiv 2010
-
[2]
1993, ARA&A, 31, 473
Antonucci, R. 1993, ARA&A, 31, 473
1993
-
[3]
J., Stern, D., Kochanek, C
Assef, R. J., Stern, D., Kochanek, C. S., et al. 2013, ApJ, 772, 26 Astropy Collaboration, Price-Whelan, A. M., Lim, P. L., et al. 2022, ApJ, 935, 167 Astropy Collaboration, Price-Whelan, A. M., Sip˝ocz, B. M., et al. 2018, AJ, 156, 123 Article number, page 11 of 16 A&A proofs:manuscript no. aanda Astropy Collaboration, Robitaille, T. P., Tollerud, E. J.,...
2013
-
[4]
E., Lira, P., Anguita, T., et al
Bauer, F. E., Lira, P., Anguita, T., et al. 2023, The Messenger, 190, 34
2023
-
[5]
2026, A&A, 707, A206
Bernal, S., Sánchez-Sáez, P., Arévalo, P., et al. 2026, A&A, 707, A206
2026
-
[6]
2025, A&A, 694, A127
Bernal, S., Sánchez-Sáez, P., Arévalo, P., et al. 2025, A&A, 694, A127
2025
-
[7]
Blanton, M. R. & Roweis, S. 2007, AJ, 133, 734
2007
-
[8]
S., Schlegel, D
Bolton, A. S., Schlegel, D. J., Aubourg, É., et al. 2012, AJ, 144, 144
2012
-
[9]
2009, in astro2010: The Astronomy and Astrophysics Decadal Survey, V ol
Borne, K., Accomazzi, A., Bloom, J., et al. 2009, in astro2010: The Astronomy and Astrophysics Decadal Survey, V ol. 2010, P6
2009
-
[10]
Boroson, T. A. & Green, R. F. 1992, ApJS, 80, 109
1992
-
[11]
2021, JAX: Autograd and XLA, Astrophysics Source Code Library, record ascl:2111.002
Bradbury, J., Frostig, R., Hawkins, P., et al. 2021, JAX: Autograd and XLA, Astrophysics Source Code Library, record ascl:2111.002
2021
-
[12]
Brigham, E. O. 1974, The fast Fourier Transform
1974
-
[13]
& Charlot, S
Bruzual, G. & Charlot, S. 2003, MNRAS, 344, 1000
2003
-
[14]
2017, MNRAS, 472, 4051
Calderone, G., Nicastro, L., Ghisellini, G., et al. 2017, MNRAS, 472, 4051
2017
-
[15]
2012, pPXF: Penalized Pixel-Fitting stellar kinematics extraction, Astrophysics Source Code Library, record ascl:1210.002
Cappellari, M. 2012, pPXF: Penalized Pixel-Fitting stellar kinematics extraction, Astrophysics Source Code Library, record ascl:1210.002
2012
-
[16]
2017, MNRAS, 466, 798
Cappellari, M. 2017, MNRAS, 466, 798
2017
-
[17]
2023, MNRAS, 526, 3273
Cappellari, M. 2023, MNRAS, 526, 3273
2023
-
[18]
& Emsellem, E
Cappellari, M. & Emsellem, E. 2004, PASP, 116, 138
2004
-
[19]
A., Clayton, G
Cardelli, J. A., Clayton, G. C., & Mathis, J. S. 1989, ApJ, 345, 245
1989
-
[20]
Carnall, A. C. 2017, arXiv e-prints, arXiv:1705.05165 Cid Fernandes, R., Mateus, A., Sodré, L., Stasi ´nska, G., & Gomes, J. M. 2005, MNRAS, 358, 363
work page internal anchor Pith review Pith/arXiv arXiv 2017
-
[21]
2018, A&A, 620, A82
Circosta, C., Mainieri, V ., Padovani, P., et al. 2018, A&A, 620, A82
2018
-
[22]
C., Banerji, M., & Richards, G
Coatman, L., Hewett, P. C., Banerji, M., & Richards, G. T. 2016, MNRAS, 461, 647
2016
-
[23]
C., Banerji, M., et al
Coatman, L., Hewett, P. C., Banerji, M., et al. 2017, MNRAS, 465, 2120
2017
-
[24]
M., Kraemer, S
Crenshaw, D. M., Kraemer, S. B., & George, I. M. 2003, ARA&A, 41, 117
2003
-
[25]
Dalalyan, A. S. 2017, arXiv e-prints, arXiv:1704.04752 de Jong, R. S., Agertz, O., Berbel, A. A., et al. 2019, The Messenger, 175, 3
work page internal anchor Pith review Pith/arXiv arXiv 2017
-
[26]
2020, The DeepMind JAX Ecosys- tem
DeepMind, Babuschkin, I., Baumli, K., et al. 2020, The DeepMind JAX Ecosys- tem
2020
-
[27]
Dietrich, M., Appenzeller, I., Vestergaard, M., & Wagner, S. J. 2002, ApJ, 564, 581
2002
-
[28]
2008, MNRAS, 383, 581
Dong, X., Wang, T., Wang, J., et al. 2008, MNRAS, 383, 581
2008
-
[29]
C., et al
Dong, X.-B., Wang, J.-G., Ho, L. C., et al. 2011, ApJ, 736, 86
2011
-
[30]
2024, PuDu-Astro/DASpec: DASpec: A code for spectral decomposition of active galactic nuclei
Du, P. 2024, PuDu-Astro/DASpec: DASpec: A code for spectral decomposition of active galactic nuclei
2024
-
[31]
Fitzpatrick, E. L. 1999, PASP, 111, 63
1999
-
[32]
2023, MNRAS, 524, 5827
Fu, Y ., Cappellari, M., Mao, S., et al. 2023, MNRAS, 524, 5827
2023
-
[33]
2022, A&A, 668, A155
Galan, A., Vernardos, G., Peel, A., Courbin, F., & Starck, J.-L. 2022, A&A, 668, A155
2022
-
[34]
Garcia-Rissmann, A., Rodríguez-Ardila, A., Sigut, T. A. A., & Pradhan, A. K. 2012, ApJ, 751, 7
2012
-
[35]
2000, A&AS, 141, 371
Girardi, L., Bressan, A., Bertelli, G., & Chiosi, C. 2000, A&AS, 141, 371
2000
-
[36]
Grandi, S. A. 1982, ApJ, 255, 25
1982
-
[37]
Greene, J. E. & Ho, L. C. 2005, ApJ, 630, 122
2005
-
[38]
2022, ApJ, 935, 49
Gu, A., Huang, X., Sheu, W., et al. 2022, ApJ, 935, 49
2022
-
[39]
2018, PyQSOFit: Python code to fit the spectrum of quasars, Astrophysics Source Code Library, record ascl:1809.008
Guo, H., Shen, Y ., & Wang, S. 2018, PyQSOFit: Python code to fit the spectrum of quasars, Astrophysics Source Code Library, record ascl:1809.008
2018
-
[40]
M., Alexander, D
Harrison, C. M., Alexander, D. M., Mullaney, J. R., & Swinbank, A. M. 2014, MNRAS, 441, 3306
2014
-
[41]
M., Costa, T., Tadhunter, C
Harrison, C. M., Costa, T., Tadhunter, C. N., et al. 2018, Nature Astronomy, 2, 198
2018
-
[42]
W., Baldry, I
Hogg, D. W., Baldry, I. K., Blanton, M. R., & Eisenstein, D. J. 2002, arXiv e- prints, astro Hutsemékers, D., Marin, F., Agís González, B., Acosta Pulido, J.-A., & Kokubo, M. 2026, A&A, 707, A17 Ili´c, D., Oknyansky, V ., Popovi´c, L. ˇC., et al. 2020, A&A, 638, A13 Ili´c, D., Raki´c, N., & Popovi´c, L. ˇC. 2023, ApJS, 267, 19
2002
-
[43]
Jalan, P., Rakshit, S., Woo, J.-J., Kotilainen, J., & Stalin, C. S. 2023, MNRAS, 521, L11
2023
-
[44]
2012, MNRAS, 420, 1825
Jin, C., Ward, M., Done, C., & Gelbord, J. 2012, MNRAS, 420, 1825
2012
-
[45]
M., Tremonti, C., et al
Kauffmann, G., Heckman, T. M., Tremonti, C., et al. 2003, MNRAS, 346, 1055
2003
-
[46]
Kellermann, K. I. 2015, in IAU Symposium, V ol. 313, Extragalactic Jets from Every Angle, ed. F. Massaro, C. C. Cheung, E. Lopez, & A. Siemiginowska, 190–195
2015
-
[47]
Khachikian, E. Y . & Weedman, D. W. 1974, ApJ, 192, 581
1974
-
[48]
C., & Im, M
Kim, M., Ho, L. C., & Im, M. 2006, ApJ, 642, 702
2006
-
[49]
& Pounds, K
King, A. & Pounds, K. 2015, ARA&A, 53, 115
2015
-
[50]
Kingma, D. P. & Ba, J. 2014, arXiv e-prints, arXiv:1412.6980 Kovaˇcevi´c, J., Popovi´c, L. ˇC., & Dimitrijevi´c, M. S. 2010, ApJS, 189, 15 Kovaˇcevi´c, J., Popovi ´c, L. ˇC., & Kollatschny, W. 2014, Advances in Space Re- search, 54, 1347
work page internal anchor Pith review Pith/arXiv arXiv 2014
-
[51]
C., Ward, M
Landt, H., Bentz, M. C., Ward, M. J., et al. 2008, ApJS, 174, 282
2008
-
[52]
2025, ApJ, 994, 216
Layek, N., Nandi, P., Naik, S., et al. 2025, ApJ, 994, 216
2025
-
[53]
W., Higley, A
Lyke, B. W., Higley, A. N., McLane, J. N., et al. 2020, ApJS, 250, 8
2020
-
[54]
2019, ISPRS Journal of Photogrammetry and Remote Sensing, 152, 166
Ma, L., Liu, Y ., Zhang, X., et al. 2019, ISPRS Journal of Photogrammetry and Remote Sensing, 152, 166
2019
-
[55]
Mainieri, V ., Anderson, R. I., Brinchmann, J., et al. 2024, arXiv e-prints, arXiv:2403.05398
-
[56]
Markwardt, C. B. 2009, in Astronomical Society of the Pacific Conference Se- ries, V ol. 411, Astronomical Data Analysis Software and Systems XVIII, ed. D. A. Bohlender, D. Durand, & P. Dowler, 251 Mejía-Restrepo, J. E., Trakhtenbrot, B., Lira, P., Netzer, H., & Capellupo, D. M. 2016, MNRAS, 460, 187
2009
-
[57]
A., Banerji, M., et al
Merloni, A., Alexander, D. A., Banerji, M., et al. 2019, The Messenger, 175, 42
2019
-
[58]
2023, The Journal of Open Source Software, 8, 5340 Moré, J
Michalewicz, K., Millon, M., Dux, F., & Courbin, F. 2023, The Journal of Open Source Software, 8, 5340 Moré, J. J. 1978, in Lecture Notes in Mathematics, Berlin Springer Verlag, V ol. 630, 105–116
2023
-
[59]
2023, Fast- SpecFit: Fast spectral synthesis and emission-line fitting of DESI spectra, As- trophysics Source Code Library, record ascl:2308.005
Moustakas, J., Buhler, J., Scholte, D., Dey, B., & Khederlarian, A. 2023, Fast- SpecFit: Fast spectral synthesis and emission-line fitting of DESI spectra, As- trophysics Source Code Library, record ascl:2308.005
2023
-
[60]
R., Alexander, D
Mullaney, J. R., Alexander, D. M., Fine, S., et al. 2013, MNRAS, 433, 622
2013
-
[61]
2015, ARA&A, 53, 365
Netzer, H. 2015, ARA&A, 53, 365
2015
-
[62]
B., & Ingargiola, A
Newville, M., Stensitzki, T., Allen, D. B., & Ingargiola, A. 2014, LMFIT: Non- Linear Least-Square Minimization and Curve-Fitting for Python
2014
-
[63]
2017, Frontiers in Astronomy and Space Sciences, 4, 35
Padovani, P. 2017, Frontiers in Astronomy and Space Sciences, 4, 35
2017
-
[64]
M., Assef, R
Padovani, P., Alexander, D. M., Assef, R. J., et al. 2017, A&A Rev., 25, 2
2017
-
[65]
2025, ApJ, 987, 48
Pan, Z., Jiang, L., Guo, W.-J., et al. 2025, ApJ, 987, 48
2025
-
[66]
J., Ho, L
Park, D., Barth, A. J., Ho, L. C., & Laor, A. 2022, ApJS, 258, 38 Popovi´c, L. ˇC. 2020, Open Astronomy, 29, 1 Popovi´c, L. ˇC., Kovaˇcevi´c-Dojˇcinovi´c, J., & Marˇceta-Mandi´c, S. 2019, MNRAS, 484, 3180
2022
-
[67]
H., Teukolsky, S
Press, W. H., Teukolsky, S. A., Vetterling, W. T., & Flannery, B. P. 1992, Numer- ical recipes in FORTRAN. The art of scientific computing Raki´c, N. 2022, MNRAS, 516, 1624
1992
-
[68]
S., Chand, H., & Zhang, X.-G
Rakshit, S., Stalin, C. S., Chand, H., & Zhang, X.-G. 2017, ApJS, 229, 39
2017
-
[69]
2024, ApJ, 974, 153
Ren, W., Guo, H., Shen, Y ., et al. 2024, ApJ, 974, 153
2024
-
[70]
T., Kruczek, N
Richards, G. T., Kruczek, N. E., Gallagher, S. C., et al. 2011, AJ, 141, 167
2011
-
[71]
T., Lacy, M., Storrie-Lombardi, L
Richards, G. T., Lacy, M., Storrie-Lombardi, L. J., et al. 2006, ApJS, 166, 470
2006
-
[72]
J., Mazuk, S., Puetter, R
Rudy, R. J., Mazuk, S., Puetter, R. C., & Hamann, F. 2000, ApJ, 539, 166
2000
- [73]
-
[74]
Schlafly, E. F. & Finkbeiner, D. P. 2011, ApJ, 737, 103
2011
-
[75]
J., Finkbeiner, D
Schlegel, D. J., Finkbeiner, D. P., & Davis, M. 1998, ApJ, 500, 525
1998
-
[76]
O., Canalizo, G., Hiner, K
Sexton, R. O., Canalizo, G., Hiner, K. D., et al. 2019, ApJ, 878, 101
2019
-
[77]
O., Matzko, W., Darden, N., Canalizo, G., & Gorjian, V
Sexton, R. O., Matzko, W., Darden, N., Canalizo, G., & Gorjian, V . 2021, MN- RAS, 500, 2871
2021
-
[78]
T., Strauss, M
Shen, Y ., Richards, G. T., Strauss, M. A., et al. 2011, ApJS, 194, 45
2011
-
[79]
2024, A&A, 691, A308
Siudek, M., Pucha, R., Mezcua, M., et al. 2024, A&A, 691, A308
2024
-
[80]
Storey, P. J. & Hummer, D. G. 1995, MNRAS, 272, 41
1995
discussion (0)
Sign in with ORCID, Apple, or X to comment. Anyone can read and Pith papers without signing in.