Assessing the Carbon Emissions and Energy Consumption of U.S. Hyperscale Data Centers
Pith reviewed 2026-06-28 06:10 UTC · model grok-4.3
The pith
US hyperscale data centers consumed 68-99 TWh of electricity and emitted 37-54 million metric tons of CO2 over one year.
A machine-rendered reading of the paper's core claim, the machinery that carries it, and where it could break.
Core claim
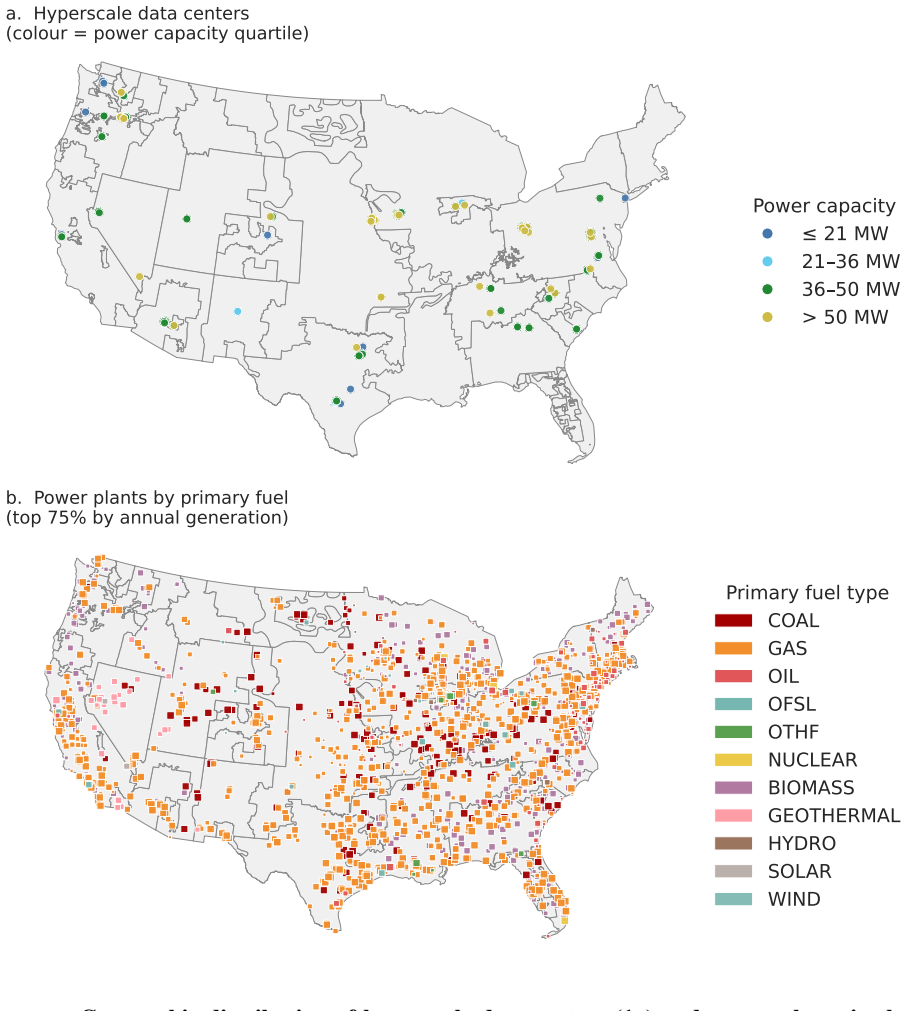
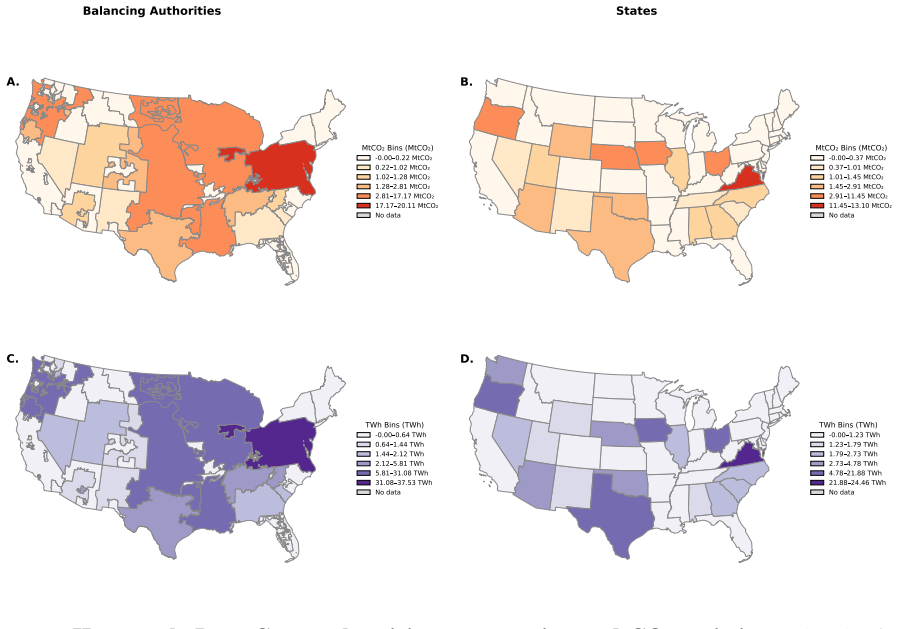
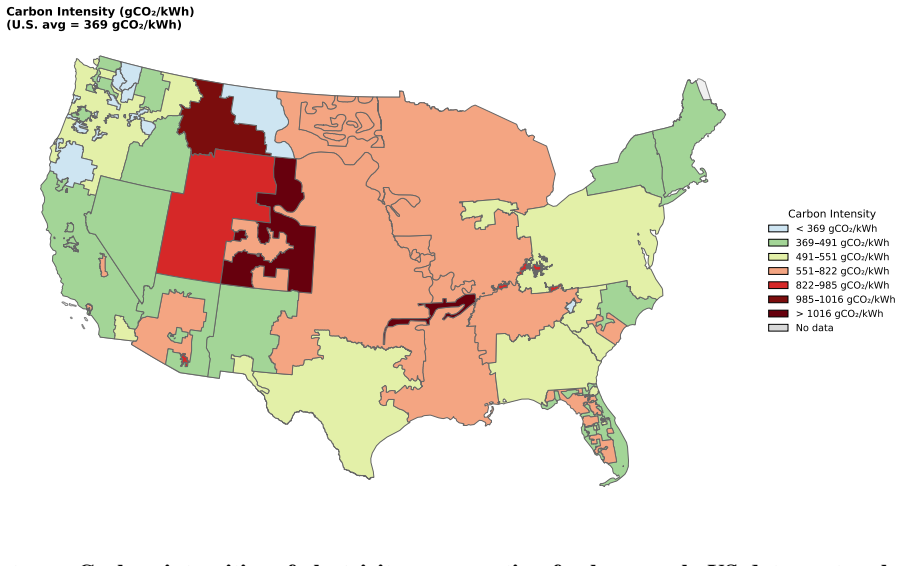
Compiling facility-level information on 403 US hyperscale data centers and attributing their electricity use to specific generation sources with EPA eGRID plant-level data shows that these centers consumed 68-99 TWh of electricity and produced 37-54 million metric tons of CO2, with a weighted average carbon intensity of 545 gCO2/kWh that is 48 percent above the contemporaneous US national average.
What carries the argument
Facility-level attribution of electricity consumption and CO2 emissions to 403 hyperscale data centers using EPA eGRID plant-level generation and emissions data.
If this is right
- Hyperscale data center electricity demand equals about 1.8 percent of total US consumption under the central scenario.
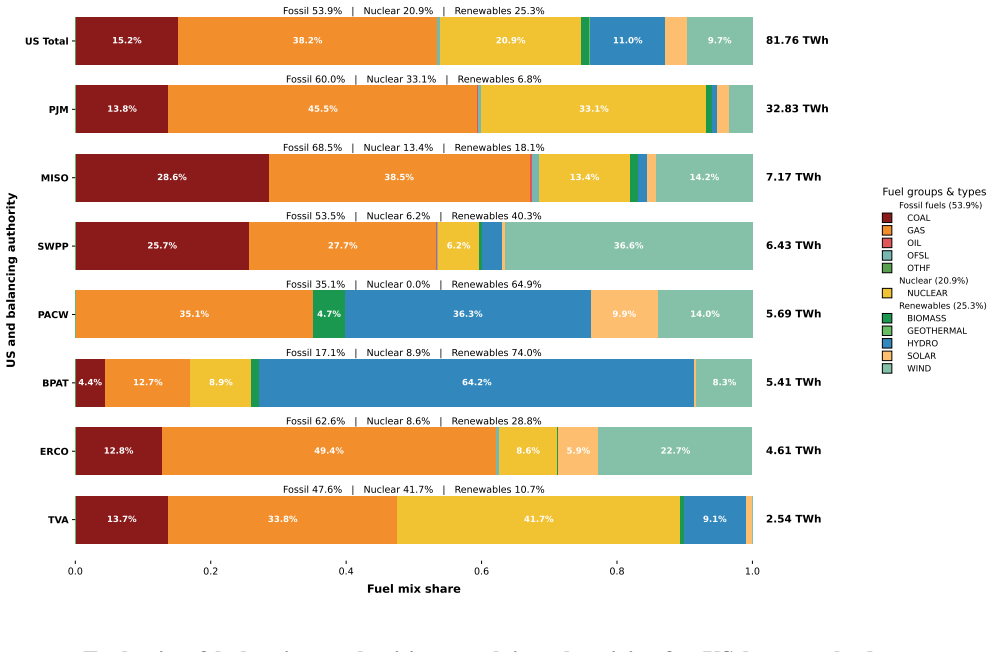
- Roughly 54 percent of the power attributed to these centers comes from fossil-fuel generation.
- The sector's carbon intensity exceeds the national grid average by 48 percent because of the specific locations and source mix.
- The same attribution method can track changes in the sector's footprint as new facilities are added or load patterns shift.
Where Pith is reading between the lines
- If hyperscale capacity continues to grow rapidly, the sector's share of national emissions will rise unless the mix of power sources improves at those specific locations.
- Siting decisions that favor regions with lower-carbon grids could reduce the sector's average intensity without changes in total electricity use.
- The same plant-level matching approach could be extended to smaller-scale data centers or to facilities outside the United States once comparable plant data become available.
Load-bearing premise
The compiled list of 403 operating hyperscale data centers is complete and accurate, and the assignment of each facility's electricity use to specific power plants via location and grid data introduces no large mismatches.
What would settle it
An independent count of operating US hyperscale data centers that differs by more than 10 percent from 403, or a set of utility-reported emissions for the same facilities that falls outside the 37-54 million metric ton range.
Figures
read the original abstract
The rapid proliferation of hyperscale data centers (HDCs) in the US, mainly driven by the adoption of artificial intelligence, has raised concerns about this industry's environmental footprint. We compiled facility-level information on 403 US hyperscale data centers operating between May 2024 and April 2025 and estimated their electricity consumption, electricity sources, and attributable CO2 emissions. Across different facility-load scenarios, these HDCs consumed approximately 68-99 TWh of electricity and were associated with about 37-54 million metric tons of CO2. Under the central scenario, HDC electricity demand corresponded to approximately 1.8% of total US electricity consumption, with roughly 54% of attributed generation supplied by fossil-fuel sources. The HDC electricity-weighted average carbon intensity was approximately 545 gCO2/kWh, about 48% above the contemporaneous US national grid-average carbon intensity of 370 gCO2/kWh. Our approach provides an attributional tool for assessing the environmental footprint of hyperscale data centers using the most recent EPA eGRID plant-level data.
Editorial analysis
A structured set of objections, weighed in public.
Referee Report
Summary. The paper compiles facility-level data on 403 US hyperscale data centers operating May 2024–April 2025 and uses EPA eGRID plant-level data to estimate electricity consumption (68-99 TWh across load scenarios), attributable CO2 emissions (37-54 MtCO2), and electricity-weighted average carbon intensity (545 gCO2/kWh, 48% above the US national average of 370 gCO2/kWh). Under the central scenario, HDC demand is ~1.8% of US electricity with 54% from fossil sources. The work positions itself as providing an attributional tool based on recent public datasets.
Significance. If the facility list and attribution steps are shown to be complete and accurate, the estimates would supply a timely, quantitative baseline on the energy and emissions footprint of hyperscale data centers during rapid AI-driven expansion. The use of plant-level eGRID data for location-specific attribution is a methodological strength that could be extended to other sectors; the reported 48% intensity premium and 1.8% demand share are concrete, policy-relevant figures.
major comments (3)
- [Abstract and Data compilation] The manuscript provides no description of the sources, deduplication criteria, or validation steps used to assemble the list of 403 facilities (Abstract and Data section). Because the headline aggregates (68-99 TWh, 37-54 MtCO2) are direct sums over this list, any systematic under- or over-count directly scales all reported totals and the 545 gCO2/kWh intensity figure.
- [Methods (eGRID attribution)] No discussion or sensitivity test is given for the geographic attribution of each facility to eGRID subregions (Methods). Potential mismatches arising from PPAs, behind-the-meter generation, or multi-site balancing would alter the weighted emissions factors and therefore the central claim that HDC intensity is 48% above the national average.
- [Results and load scenarios] The three facility-load scenarios are introduced without reported sensitivity checks, missing-data handling, or error propagation (Results). The wide 68-99 TWh and 37-54 MtCO2 ranges therefore cannot be assessed for robustness, undermining the reliability of the 1.8% demand share and fossil-share statements.
minor comments (2)
- [Data section] Clarify the exact temporal window and any exclusion criteria applied to the 403-facility list so readers can judge representativeness.
- [Supplementary material] Add a table or appendix listing the eGRID subregion assignments for the largest facilities to allow independent verification of the weighting.
Simulated Author's Rebuttal
We thank the referee for their constructive comments, which identify key areas where additional methodological transparency will strengthen the manuscript. We respond to each major comment below and indicate the revisions we will make.
read point-by-point responses
-
Referee: [Abstract and Data compilation] The manuscript provides no description of the sources, deduplication criteria, or validation steps used to assemble the list of 403 facilities (Abstract and Data section). Because the headline aggregates (68-99 TWh, 37-54 MtCO2) are direct sums over this list, any systematic under- or over-count directly scales all reported totals and the 545 gCO2/kWh intensity figure.
Authors: We agree that the Data section requires expansion. In the revised manuscript we will add a dedicated subsection detailing the primary public sources (industry reports, company filings, and databases), the deduplication rules applied (matching on location, operator, and nameplate capacity), and the validation procedures (cross-referencing multiple lists and confirming operational status for the May 2024–April 2025 period). These additions will allow readers to evaluate the completeness of the facility list and the resulting aggregates. revision: yes
-
Referee: [Methods (eGRID attribution)] No discussion or sensitivity test is given for the geographic attribution of each facility to eGRID subregions (Methods). Potential mismatches arising from PPAs, behind-the-meter generation, or multi-site balancing would alter the weighted emissions factors and therefore the central claim that HDC intensity is 48% above the national average.
Authors: The referee correctly notes the absence of this discussion. Our current attribution maps facilities to eGRID subregions by location using EPA data. We will revise the Methods section to explicitly discuss limitations from PPAs, behind-the-meter generation, and balancing, and we will add a sensitivity analysis that adjusts the weighted intensity under plausible PPA scenarios where supporting data exist. This will qualify the reported 48% premium while retaining the location-based core method. revision: yes
-
Referee: [Results and load scenarios] The three facility-load scenarios are introduced without reported sensitivity checks, missing-data handling, or error propagation (Results). The wide 68-99 TWh and 37-54 MtCO2 ranges therefore cannot be assessed for robustness, undermining the reliability of the 1.8% demand share and fossil-share statements.
Authors: We acknowledge that the Results section lacks these robustness checks. The three scenarios reflect low, central, and high utilization assumptions derived from reported capacities. In revision we will add a sensitivity subsection that varies utilization rates, describes bounding for facilities with missing load data, and provides a basic error-propagation estimate. These additions will support evaluation of the 1.8% demand share and fossil-share figures. revision: yes
Circularity Check
Empirical attribution study with no internal derivation chain
full rationale
The paper is an empirical compilation and attribution exercise: it assembles a list of 403 facilities, estimates their electricity use under load scenarios, and attributes sources and CO2 emissions via external EPA eGRID plant-level data. No equations, fitted parameters, self-referential predictions, uniqueness theorems, or ansatzes appear in the derivation. The headline aggregates (68-99 TWh, 37-54 MtCO2, 545 gCO2/kWh intensity) are produced by direct summation and weighting of the compiled inputs against independent public datasets, rendering the work self-contained against external benchmarks.
Axiom & Free-Parameter Ledger
free parameters (1)
- facility-load scenarios
axioms (2)
- domain assumption The list of 403 hyperscale data centers is complete and accurate for US facilities operating May 2024–April 2025.
- domain assumption EPA eGRID plant-level data can be correctly matched to data-center locations and operations to attribute electricity sources and emissions.
Reference graph
Works this paper leans on
-
[1]
Crawford
K. Crawford. Generative AI’s Environmental Costs Are Soaring — and Mostly Secret. Nature626, 693 (2024)
2024
-
[2]
Erdenesanaa
D. Erdenesanaa. A.I. Could Soon Need as Much Electricity as an Entire Country.The New York Times(2023). Sec. Climate
2023
-
[3]
Carbon Emissions and Large Neural Network Training
D. Patterson, J. Gonzalez, Q. Le, C. Liang, L-M. Munguia, D. Rothchild, D. So, M. Texier, J. Dean. Carbon Emissions and Large Neural Network Training.arXiv preprint arXiv.2104.10350(2021)
work page internal anchor Pith review Pith/arXiv arXiv 2021
-
[4]
Mytton, M
D. Mytton, M. Ashtine. Sources of data center energy estimates: A comprehensive review. Joule6, 2032 (2022)
2032
-
[5]
Shehabi,et al., 2024 United States Data Center Energy Usage Report,Tech
A. Shehabi,et al., 2024 United States Data Center Energy Usage Report,Tech. Rep. LBNL- 2001637, Lawrence Berkeley National Laboratory, Berkeley, California (2024). 21
2024
-
[6]
T. Han, Y . Wang, Z. Mi,et al.. Designing and regulating clean energy data centres.Nature Reviews Clean Technology(2025)
2025
-
[7]
Kamiya, P
G. Kamiya, P. Bertoldi. Energy consumption in data centres and broadband communication networks in the EU.European Commission, Joint Research Centre(2024)
2024
-
[8]
K. Sun, N. Luo, X. Luo, T. Hong. Prototype energy models for data centers.Energy and Buildings231, 110603 (2021)
2021
-
[9]
Dayarathna, Y
M. Dayarathna, Y . Wen, R. Fan. Data center energy consumption modeling: A survey. IEEE Communications Surveys and Tutorials18, 732 (2015)
2015
-
[10]
Guidi,et al
G. Guidi,et al.. The environmental burden of the united states’ bitcoin mining boom. Nature Communications16, 2970 (2025)
2025
-
[11]
Stokel-Walker
C. Stokel-Walker. The generative ai race has a dirty secret.Wired(2024). Accessed: 2- May-2024
2024
-
[12]
Energy and Policy Considerations for Deep Learning in NLP
E. Strubell, A. Ganesh, A. McCallum. Energy and Policy Considerations for Deep Learning in NLP.arXiv preprint arXiv.1906.02243(2019)
work page internal anchor Pith review Pith/arXiv arXiv 1906
-
[13]
Shehabi,et al., United states data center energy usage report,Tech
A. Shehabi,et al., United states data center energy usage report,Tech. Rep. LBNL-1005775, Lawrence Berkeley National Laboratory, Berkeley, California (2016)
2016
-
[14]
Ferreira, G
J. Ferreira, G. Callou, A. Josua, P. Maciel,2018 IEEE 17th International Symposium on Network Computing and Applications (NCA)(IEEE, 2018), pp. 1–4
2018
-
[15]
Energy Information Administration, How much electricity is consumed in the U.S
U.S. Energy Information Administration, How much electricity is consumed in the U.S. each year? (2024). Accessed: 7-October-2024. 22
2024
-
[16]
Environmental and Energy Study Institute, Data center energy needs could upend power grids and threaten the climate (2025)
2025
-
[17]
M. A. B. Siddik, A. Shehabi, L. Marston. The environmental footprint of data centers in the united states.Environmental Research Letters16, 064017 (2021)
2021
-
[18]
T. Xiao, F. Fuso Nerini, H. D. Matthews, M. Tavoni, F. You. Environmental impact and net-zero pathways for sustainable artificial intelligence servers in the USA.Nature Sustain- ability8, 1541 (2025)
2025
-
[19]
Stoll, L
C. Stoll, L. Klaaßen, U. Gallersd ¨orfer. The carbon footprint of bitcoin.Joule3, 1647 (2019)
2019
-
[20]
rep., International Energy Agency (2025)
International Energy Agency, Energy and ai,Tech. rep., International Energy Agency (2025). Accessed: 2025-05-13
2025
-
[21]
Energy Information Administration, State energy data system (seds): Fuel use by state, https://www.eia.gov/state/seds/sep_fuel/html/pdf/fuel_use_es .pdf(2023)
U.S. Energy Information Administration, State energy data system (seds): Fuel use by state, https://www.eia.gov/state/seds/sep_fuel/html/pdf/fuel_use_es .pdf(2023). Accessed: 15-October-2024
2023
-
[22]
Uptime Institute, Global data center survey 2024 (2024)
2024
-
[23]
N. Lei, E. Masanet. Climate- and technology-specific PUE and WUE estimations for U.S. data centers using a hybrid statistical and thermodynamics-based approach.Resources, Conservation and Recycling182, 106324 (2022)
2022
-
[24]
Sachs, Ai to drive 165% increase in data center power demand by 2030 (2023)
G. Sachs, Ai to drive 165% increase in data center power demand by 2030 (2023). Ac- cessed: 2025-05-12. 23
2030
-
[25]
M. Brander. The most important GHG accounting concept you may not have heard of: the attributional-consequential distinction.Carbon Management13, 337 (2022). Publisher: Taylor & Francis eprint: https://doi.org/10.1080/17583004.2022.2088402
-
[26]
Environmental Protection Agency, Frequent Questions about eGRID (2024)
U.S. Environmental Protection Agency, Frequent Questions about eGRID (2024). Ac- cessed: 7-October-2024
2024
-
[27]
Accessed: 7-October-2024
Our World in Data, Carbon Intensity of Electricity (2024). Accessed: 7-October-2024
2024
-
[28]
rep., International Data Corporation, Framingham, MA (2023)
International Data Corporation (IDC), Idc processors and ai unit spreadsheet 08282023, Tech. rep., International Data Corporation, Framingham, MA (2023)
2023
-
[29]
rep., International Data Corporation, Framingham, MA (2023)
International Data Corporation (IDC), Datacenter deployment and spend forecast- 1h 2023, Tech. rep., International Data Corporation, Framingham, MA (2023)
2023
-
[30]
[Accessed 29-October-2024]
Corporate Clean Power Buying Grew 12% to New Record in 2023, According to BloombergNEF,https://about.bnef.com/blog/corporate-clean-p ower-buying-grew-12-to-new-record-in-2023-according-to-blo ombergnef/. [Accessed 29-October-2024]
2023
-
[31]
D. C. Knowledge, Tougher Reporting Mandates Ahead for Data Centers — datacenter- knowledge.com,https://www.datacenterknowledge.com/regulation s/tougher-reporting-mandates-ahead-for-data-centers. Accessed 29-October-2024
2024
-
[32]
J. Dietrich, US mandates crypto energy reporting: will data centers be next? - Uptime Institute Blog,https://journal.uptimeinstitute.com/us-mandates-c rypto-energy-reporting-will-data-centers-be-next/. Accessed 29-October-2024. 24
2024
-
[33]
Report on data center industry transforma- tion and investment trends
Colliers, 2025 data center marketplace (2025). Report on data center industry transforma- tion and investment trends
2025
-
[34]
Choukse, M
E. Choukse, M. Ebling, U. Shankar, A. Ingole, R. Bianchini,Proceedings of the 29th ACM International Conference on Architectural Support for Programming Languages and Op- erating Systems (ASPLOS ’24)(Association for Computing Machinery, 2024), vol. 3, pp. 207–222
2024
-
[35]
Ekvall, A.-M
T. Ekvall, A.-M. Tillman, S. Molander. Normative ethics and methodology for life cycle assessment.Journal of Cleaner Production13, 1225 (2005)
2005
-
[36]
Nordenstam
L. Nordenstam. Attributional or consequential assessments in a cyclic greenhouse gas man- agement process–comparison of guidance on use and production of electricity and district heating.Journal of Cleaner Production317, 128214 (2021)
2021
-
[37]
Energy Information Administration, Electric power monthly,Technical report, U.S
U.S. Energy Information Administration, Electric power monthly,Technical report, U.S. Energy Information Administration (2024)
2024
-
[38]
Energy Information Administration, Electricity generation, capacity, and sales in the United States (2023)
U.S. Energy Information Administration, Electricity generation, capacity, and sales in the United States (2023)
2023
- [39]
-
[40]
Jagannadharao, N
A. Jagannadharao, N. Beckage, D. Nafus, S. Chamberlin. Timeshifting strategies for carbon-efficient long-running large language model training.Innovations in Systems and Software Engineeringpp. 1–15 (2023). 25
2023
- [41]
-
[42]
Gagnon, W
P. Gagnon, W. Cole. Planning for the evolution of the electric grid with a long-run marginal emission rate.iScience25, 103915 (2022)
2022
-
[43]
Prettenhofer, G
P. Prettenhofer, G. Louppe,PyData 2014(2014)
2014
-
[44]
Istrate,et al
R. Istrate,et al.. The environmental sustainability of digital content consumption.Nature Communications15, 3724 (2024)
2024
-
[45]
Niewenhuis, S
D. Niewenhuis, S. Talluri, A. Iosup, T. De Matteis,Companion of the 15th ACM/SPEC International Conference on Performance Engineering, ICPE ’24 Companion (Association for Computing Machinery, New York, NY , USA, 2024), p. 189–195
2024
-
[46]
Sarkar,et al.,Proceedings of the AAAI Conference on Artificial Intelligence(2024), vol
S. Sarkar,et al.,Proceedings of the AAAI Conference on Artificial Intelligence(2024), vol. 38, pp. 22322–22330
2024
-
[47]
Masanet, A
E. Masanet, A. Shehabi, N. Lei, S. Smith, J. Koomey. Recalibrating global data center energy-use estimates.Science367, 984 (2020)
2020
-
[48]
Luers,et al
A. Luers,et al.. Will ai accelerate or delay the race to net-zero emissions?Nature628, 718 (2024)
2024
-
[49]
Masanet, N
E. Masanet, N. Lei. How much energy do data centers really use.Aspen Global Change Institute(2020)
2020
-
[50]
A. C. Newkirk, AI-Datacenter-Microgrid-Analysis: Power-flow modeling tools for ai data center microgrid analysis, GitHub repository (2024). 26
2024
-
[51]
Assessing the Carbon Emissions and Energy Consumption of U.S. Hyperscale Data Centers
T. Rehl, J. Lansche, J. M ¨uller. Life cycle assessment of energy generation from bio- gas—attributional vs. consequential approach.Renewable and Sustainable Energy Reviews 16, 3766 (2012). Acknowledgments:We benefited from helpful comments and suggestions from Michelle Audirac, Nat Steinsultz, and Henry Richardson. We wish to thank them for their support...
2012
discussion (0)
Sign in with ORCID, Apple, or X to comment. Anyone can read and Pith papers without signing in.