WISE Photometry of Galaxies within 10 Mpc
Pith reviewed 2026-06-28 00:59 UTC · model grok-4.3
The pith
Stellar masses within 10 Mpc are concentrated in a small number of giant galaxies even though dwarfs are far more numerous.
A machine-rendered reading of the paper's core claim, the machinery that carries it, and where it could break.
Core claim
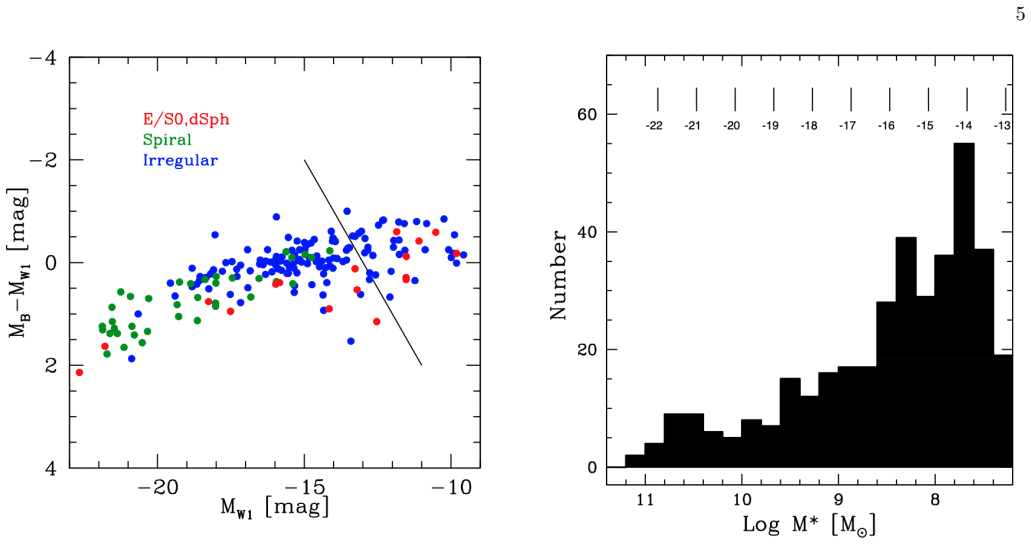
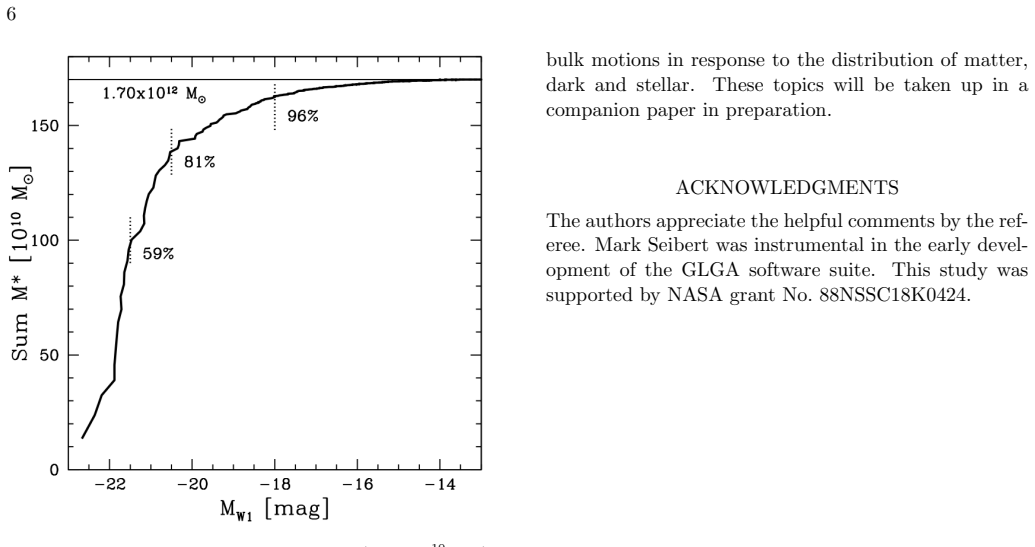
A volume-limited sample of galaxies within 10 Mpc is observed in the W1 (3.4 micron) and W2 (4.6 micron) bands with WISE and NEOWISE. Stellar masses are derived from the W1 luminosities and the measured distances. The data show that most galaxies in the sample are dwarfs, yet the great majority of the stellar mass resides in a small number of giant systems.
What carries the argument
W1-band mid-infrared photometry combined with TRGB distances to convert observed fluxes into stellar masses for the complete local volume sample.
If this is right
- The local stellar mass function is strongly skewed toward the few largest galaxies.
- Dwarf galaxies, although numerous, add only a small fraction to the total stellar mass within 10 Mpc.
- The derived masses provide a calibrated reference for the baryonic content of the nearby universe.
- The catalog supplies an observational benchmark against which simulations of galaxy formation can be tested.
Where Pith is reading between the lines
- The same photometry could be combined with neutral-hydrogen maps to test whether the stellar-to-gas mass ratio changes systematically with galaxy size.
- Extending the sample fainter than absolute magnitude -13 would reveal whether the mass concentration persists among the lowest-luminosity systems.
- The W1-based masses offer an independent check on optical or near-infrared mass estimates for the same objects.
Load-bearing premise
W1 flux traces total stellar mass with only minor contamination from dust or young stars, and the distances are accurate enough to convert those fluxes into reliable masses.
What would settle it
A direct stellar-mass measurement for any of the dominant giant galaxies that differs by more than a factor of two from the W1-derived value.
Figures
read the original abstract
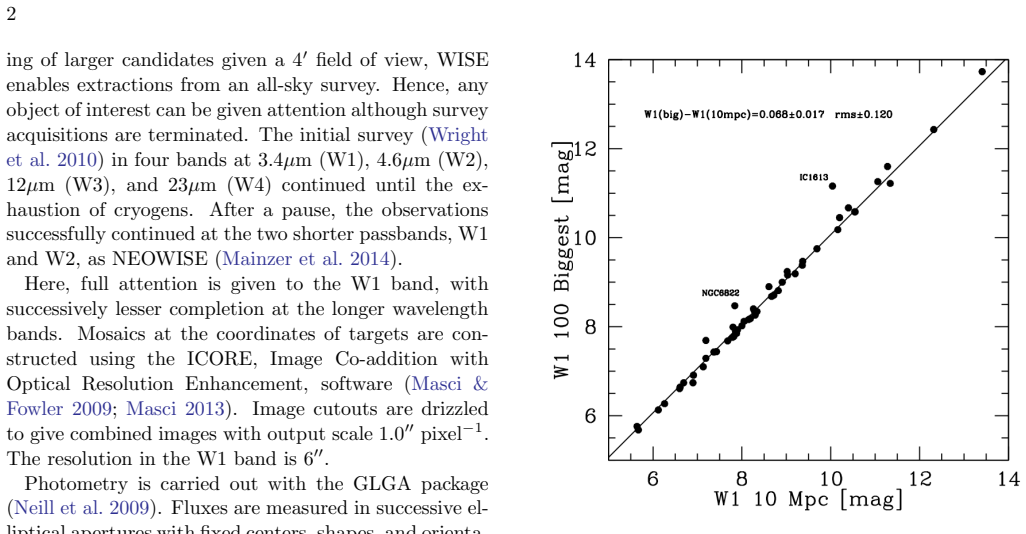
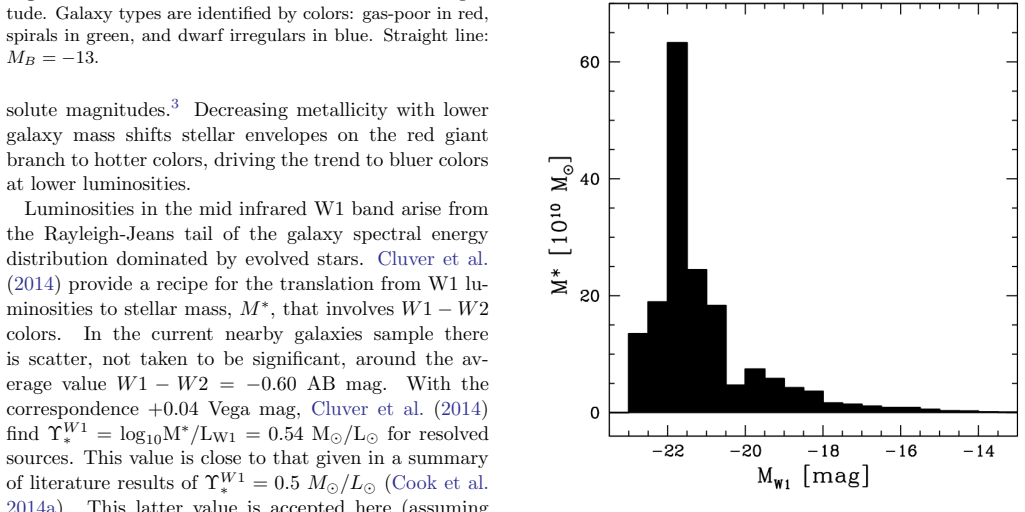
For photometry of galaxies in the infrared that extend to very low surface brightnesses, it is necessary to observe with telescopes in space. WISE and NEOWISE provide sensitive all-sky access to mid-infrared flux from galaxies at 3.4mum (W1) and 4.6mum (W2) bands. This study is complemented by the availability of accurate Tip of the Red Giant Branch distances for a large fraction of the targets. In this work, photometry is assembled on a complete volume limited sample of galaxies between one and ten Mpc brighter than absolute magnitude -13 in the W1 band. Stellar masses are inferred from W1 fluxes and measured distances. While most of the galaxies are dwarfs, most of the stellar mass is concentrated in a small number of giants.
Editorial analysis
A structured set of objections, weighed in public.
Referee Report
Summary. The manuscript assembles WISE W1 (3.4 μm) and W2 (4.6 μm) photometry for a complete volume-limited sample of galaxies within 1–10 Mpc brighter than M_W1 = −13, supplemented by TRGB distances for a large fraction of targets. Stellar masses are derived from the W1 fluxes and distances; the principal result is that dwarfs dominate the galaxy count while a small number of giants contain most of the stellar mass.
Significance. If the W1-based mass estimates prove robust, the work supplies an infrared-selected local benchmark for the stellar-mass distribution that can be compared with optical or HI censuses. The reported concentration of mass in a handful of objects is a concrete, testable statement about the nearby universe.
major comments (2)
- [Abstract] Abstract: stellar masses are stated to be 'inferred from W1 fluxes and measured distances' with no adopted M/L_W1 ratio, color-dependent correction, or test against independent mass estimates (SED fits, dynamical masses). Because the central claim concerns the distribution of stellar mass between dwarfs and giants, the absence of any calibration or validation across this luminosity range is load-bearing.
- [Abstract] Abstract and photometry description: no information is given on the surface-brightness limits reached, aperture or profile-fitting choices for extended low-SB galaxies, error propagation, or completeness corrections. These choices directly affect which galaxies enter the sample and therefore the reported mass concentration.
minor comments (1)
- The fraction of the sample possessing TRGB distances is not quantified, nor is the handling of galaxies that rely on other distance indicators.
Simulated Author's Rebuttal
We thank the referee for their detailed and constructive report. We address the two major comments point by point below, indicating the revisions that will be incorporated into the next version of the manuscript.
read point-by-point responses
-
Referee: [Abstract] Abstract: stellar masses are stated to be 'inferred from W1 fluxes and measured distances' with no adopted M/L_W1 ratio, color-dependent correction, or test against independent mass estimates (SED fits, dynamical masses). Because the central claim concerns the distribution of stellar mass between dwarfs and giants, the absence of any calibration or validation across this luminosity range is load-bearing.
Authors: We agree that explicit details on the mass estimation procedure are required to support the central result. In the revised manuscript we will state the adopted M/L_W1 ratio (a constant value appropriate for the W1 band), note the assumption of no color-dependent correction, and add a short validation subsection comparing W1-derived masses to available dynamical and SED-based estimates for a subset of the sample galaxies. These additions will be placed in both the methods section and the abstract. revision: yes
-
Referee: [Abstract] Abstract and photometry description: no information is given on the surface-brightness limits reached, aperture or profile-fitting choices for extended low-SB galaxies, error propagation, or completeness corrections. These choices directly affect which galaxies enter the sample and therefore the reported mass concentration.
Authors: The referee correctly identifies that these technical details are essential for reproducibility and for assessing the robustness of the reported mass distribution. Although the full photometry section describes the WISE image processing, we will expand both the abstract and the methods text to include the achieved surface-brightness limits, the aperture and profile-fitting approach used for low-surface-brightness targets, the error propagation from photometry and TRGB distances, and any completeness corrections applied to the volume-limited sample. revision: yes
Circularity Check
Observational data assembly with no derivation reducing to inputs by construction
full rationale
The paper assembles WISE photometry for a volume-limited galaxy sample and infers stellar masses directly from observed W1 fluxes combined with independent TRGB distances. No equations, parameter fittings, predictions, or self-citation chains are described that would reduce any claimed result to the inputs by definition. The work is self-contained as an observational catalog; the mass inference step uses a standard tracer without the paper presenting a derivation that loops back on itself.
Axiom & Free-Parameter Ledger
axioms (1)
- domain assumption W1 band flux reliably traces total stellar mass with negligible dust or population effects
Forward citations
Cited by 1 Pith paper
-
Is dark matter decaying ?
Uncertainties in measuring today's matter content prevent confirming or ruling out dark matter decay, but upcoming surveys could change that.
Reference graph
Works this paper leans on
-
[1]
Anand, G. S., Rizzi, L., Tully, R. B., et al. 2021, AJ, 162, 80, doi: 10.3847/1538-3881/ac0440
-
[2]
L., Seibert, M., Hatt, D., et al
Beaton, R. L., Seibert, M., Hatt, D., et al. 2019, ApJ, 885, 141, doi: 10.3847/1538-4357/ab4263
-
[3]
Bouquin, A. Y. K., Gil de Paz, A., Mu˜ noz-Mateos, J. C., et al. 2018, ApJS, 234, 18, doi: 10.3847/1538-4365/aaa384
-
[4]
Cluver, M. E., Jarrett, T. H., Dale, D. A., et al. 2017, ApJ, 850, 68, doi: 10.3847/1538-4357/aa92c7
-
[5]
Cluver, M. E., Jarrett, T. H., Hopkins, A. M., et al. 2014, ApJ, 782, 90, doi: 10.1088/0004-637X/782/2/90
-
[6]
Cluver, M. E., Jarrett, T. H., Dale, D. A., et al. 2025, ApJ, 979, 18, doi: 10.3847/1538-4357/ad891b
-
[7]
Cook, D. O., Dale, D. A., Johnson, B. D., et al. 2014a, MNRAS, 445, 899, doi: 10.1093/mnras/stu1787 —. 2014b, MNRAS, 445, 881, doi: 10.1093/mnras/stu1580 —. 2014c, MNRAS, 445, 890, doi: 10.1093/mnras/stu1581
-
[8]
Dalcanton, J. J., Williams, B. F., Seth, A. C., et al. 2009, ApJS, 183, 67, doi: 10.1088/0067-0049/183/1/67
-
[9]
Dale, D. A., Cohen, S. A., Johnson, L. C., et al. 2009, ApJ, 703, 517, doi: 10.1088/0004-637X/703/1/517 de Vaucouleurs, G., de Vaucouleurs, A., Corwin, Jr., H. G., et al. 1991, Third Reference Catalogue of Bright Galaxies (Volume 1-3, XII, 2069 pp. 7 figs.. Springer-Verlag Berlin Heidelberg New York)
-
[10]
H., Chester, T., Cutri, R., et al
Jarrett, T. H., Chester, T., Cutri, R., et al. 2000, AJ, 119, 2498, doi: 10.1086/301330
-
[11]
Huchra, J. P. 2003, AJ, 125, 525, doi: 10.1086/345794
-
[12]
Jarrett, T. H., Cluver, M. E., Brown, M. J. I., et al. 2019, ApJS, 245, 25, doi: 10.3847/1538-4365/ab521a
-
[13]
Karachentsev, I. D., Makarov, D. I., & Kaisina, E. I. 2013, AJ, 145, 101, doi: 10.1088/0004-6256/145/4/101
-
[14]
Karachentsev, I. D., Dolphin, A., Tully, R. B., et al. 2006, AJ, 131, 1361, doi: 10.1086/500013
-
[15]
Kennicutt, Jr., R. C., Lee, J. C., Funes, J. G., et al. 2008, ApJS, 178, 247, doi: 10.1086/590058
-
[16]
C., Armus, L., Bendo, G., et al
Kennicutt, Jr., R. C., Armus, L., Bendo, G., et al. 2003, PASP, 115, 928, doi: 10.1086/376941
-
[17]
Kirby, E. M., Jerjen, H., Ryder, S. D., & Driver, S. P. 2008, AJ, 136, 1866, doi: 10.1088/0004-6256/136/5/1866
-
[18]
Kourkchi, E., Tully, R. B., Neill, J. D., et al. 2019, ApJ, 884, 82, doi: 10.3847/1538-4357/ab4192
-
[19]
C., Gil de Paz, A., Kennicutt, Jr., R
Lee, J. C., Gil de Paz, A., Kennicutt, Jr., R. C., et al. 2011, ApJS, 192, 6, doi: 10.1088/0067-0049/192/1/6
-
[20]
M., et al.\ 2014, , 792, 30, doi:10.1088/0004-637X/792/1/30
Mainzer, A., Bauer, J., Cutri, R. M., et al. 2014, ApJ, 792, 30, doi: 10.1088/0004-637X/792/1/30
-
[21]
2013, ICORE: Image Co-addition with Optional Resolution Enhancement, Astrophysics Source Code Library, record ascl:1302.010
Masci, F. 2013, ICORE: Image Co-addition with Optional Resolution Enhancement, Astrophysics Source Code Library, record ascl:1302.010. http://ascl.net/1302.010
2013
-
[22]
J., & Fowler, J
Masci, F. J., & Fowler, J. W. 2009, in Astronomical Society of the Pacific Conference Series, Vol. 411, Astronomical Data Analysis Software and Systems XVIII, ed. D. A
2009
-
[23]
AWAIC: A WISE Astronomical Image Co-adder
Bohlender, D. Durand, & P. Dowler, 67, doi: 10.48550/arXiv.0812.4310
work page internal anchor Pith review Pith/arXiv arXiv doi:10.48550/arxiv.0812.4310
-
[24]
Neill, J. D., Seibert, M., Tully, R. B., et al. 2014, ApJ, 792, 129, doi: 10.1088/0004-637X/792/2/129
-
[25]
Neill, J. D., Sullivan, M., Howell, D. A., et al. 2009, ApJ, 707, 1449, doi: 10.1088/0004-637X/707/2/1449
-
[26]
2003, A&A, 412, 45, doi: 10.1051/0004-6361:20031411
Paturel, G., Petit, C., Prugniel, P., et al. 2003, A&A, 412, 45, doi: 10.1051/0004-6361:20031411
-
[27]
Rizzi, L., Tully, R. B., Makarov, D., et al. 2007, ApJ, 661, 815, doi: 10.1086/516566 S´ anchez-Alarc´ on, P. M., Salo, H., Knapen, J. H., et al. 2025, A&A, 697, A38, doi: 10.1051/0004-6361/202451641
-
[28]
Schlafly, E. F., & Finkbeiner, D. P. 2011, ApJ, 737, 103, doi: 10.1088/0004-637X/737/2/103
work page internal anchor Pith review doi:10.1088/0004-637x/737/2/103 2011
-
[29]
Tremonti, C. A., Heckman, T. M., Kauffmann, G., et al. 2004, ApJ, 613, 898, doi: 10.1086/423264
work page internal anchor Pith review doi:10.1086/423264 2004
-
[30]
Tully, R. B., Rizzi, L., Shaya, E. J., et al. 2009, AJ, 138, 323, doi: 10.1088/0004-6256/138/2/323
-
[31]
Tully, R. B., Shaya, E. J., Karachentsev, I. D., et al. 2008, ApJ, 676, 184, doi: 10.1086/527428
-
[32]
Wright, E. L., Eisenhardt, P. R. M., Mainzer, A. K., et al. 2010, AJ, 140, 1868, doi: 10.1088/0004-6256/140/6/1868
work page internal anchor Pith review doi:10.1088/0004-6256/140/6/1868 2010
discussion (0)
Sign in with ORCID, Apple, or X to comment. Anyone can read and Pith papers without signing in.