Effect of the measurement errors on one-sided Synthetic-RZ control charts for monitoring the ratio of two normal variables
Pith reviewed 2026-06-27 23:26 UTC · model grok-4.3
The pith
Measurement errors reduce the detection power of one-sided Synthetic-RZ charts for ratio monitoring, and repeated measurements per unit do not efficiently offset the loss.
A machine-rendered reading of the paper's core claim, the machinery that carries it, and where it could break.
Core claim
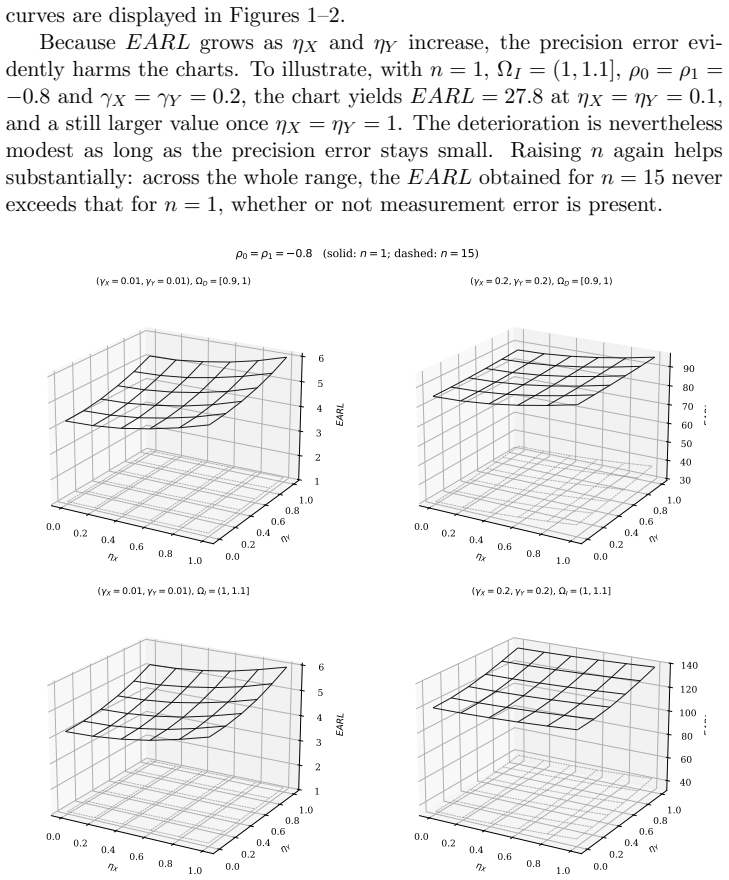
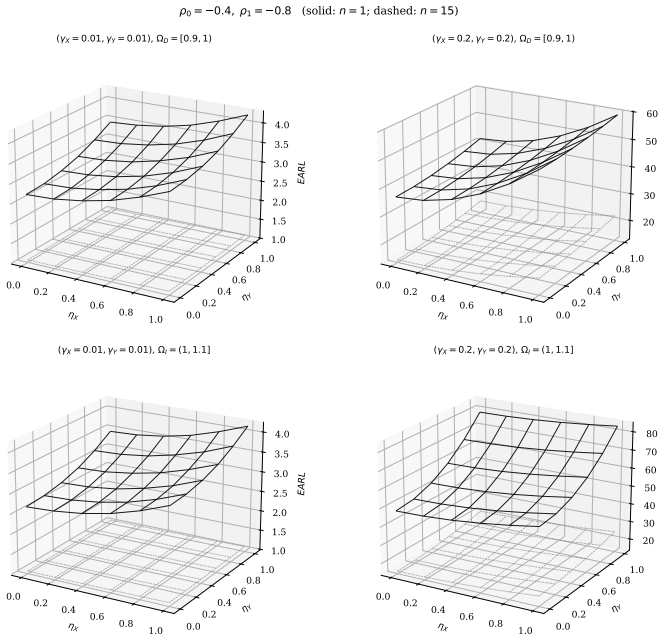
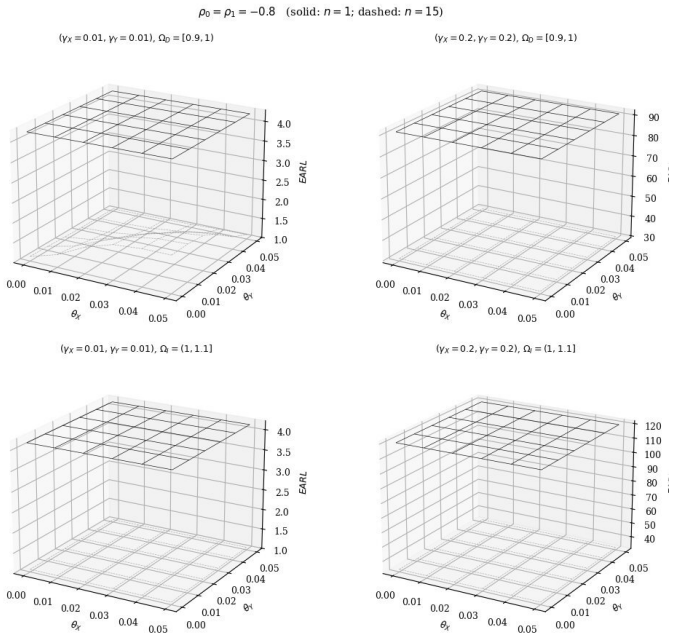
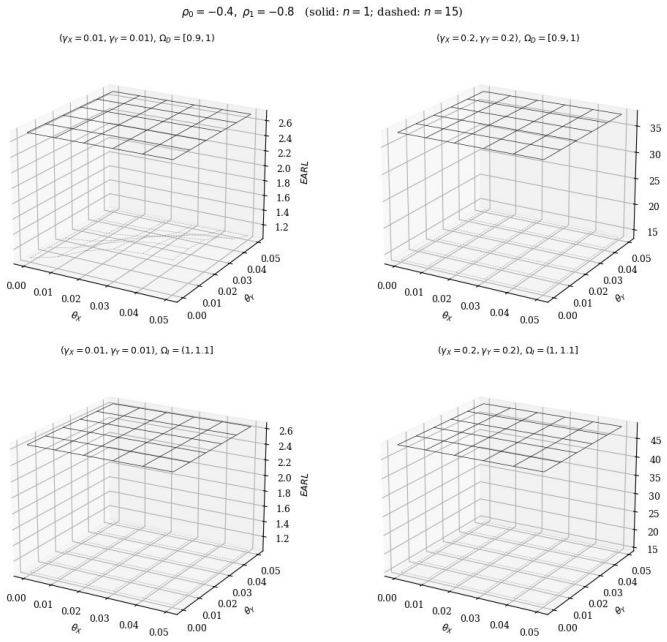
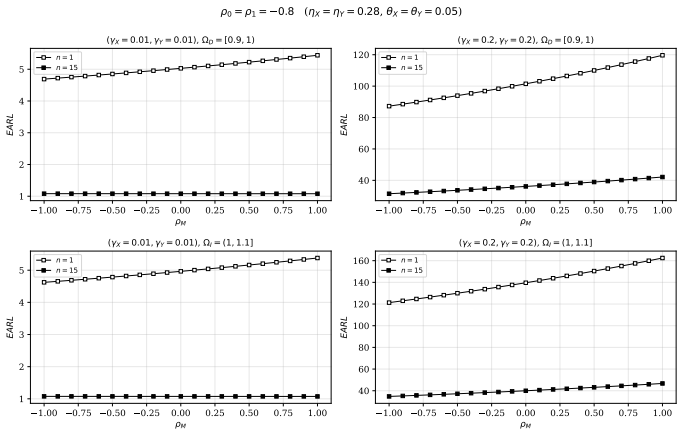
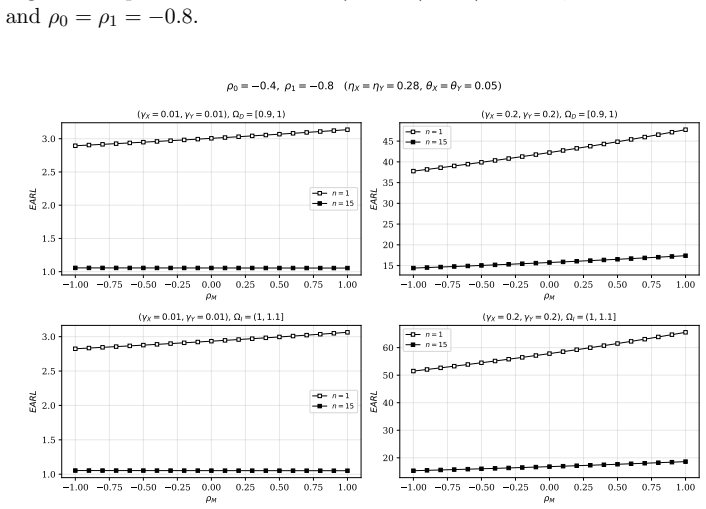
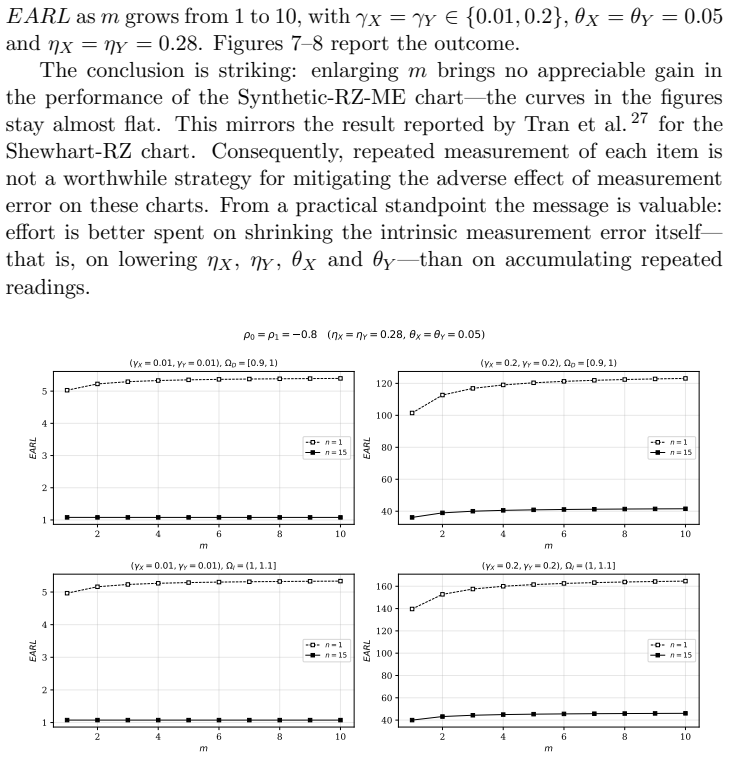
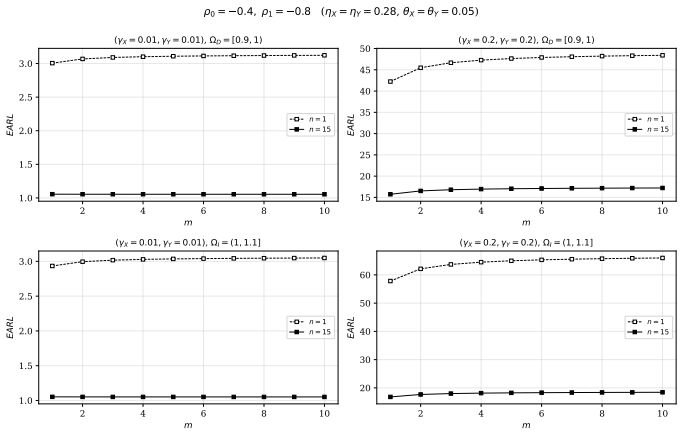
Measurement error erodes the detection capability of the Synthetic-RZ charts. Collecting several measurements on each inspected unit does not constitute an efficient remedy for the adverse influence of measurement error on the performance of the Synthetic-RZ charts.
What carries the argument
Linear covariate error model together with Markov chain formulation for average run length under evolving ratio parameters.
If this is right
- Control limits for ratio monitoring must incorporate the linear error model to preserve intended detection speed.
- The performance loss appears in both zero-state and steady-state average run length calculations.
- Standard remedies such as repeated measurements per unit leave a persistent gap in detection capability.
- Numerical results hold across a range of shift magnitudes and error variances examined in the study.
Where Pith is reading between the lines
- Industries that monitor ratios may need to prioritize sensor accuracy improvements over additional sampling per unit.
- The degradation pattern could inform adjustments to other ratio-based monitoring procedures that rely on similar Markov chain evaluations.
- Real-process validation with field data would test whether the simulated erosion matches observed chart behavior.
Load-bearing premise
The linear covariate error model correctly captures how measurement errors alter the observed ratio parameters as the process shifts from in-control to out-of-control states.
What would settle it
An experiment in which increasing the number of measurements per unit restores the original in-control and out-of-control average run lengths to their no-error values would falsify the claim that multiple measurements do not efficiently remedy the degradation.
Figures
read the original abstract
In numerous industrial production settings, keeping track of the ratio formed by two normally distributed random variables is a task of considerable practical interest. The present work examines how measurement errors influence the behaviour of a pair of one-sided Synthetic control charts designed to monitor such a ratio (referred to here as Synthetic-RZ charts), with the analysis covering both the zero-state and the steady-state average run length ($ARL$). To incorporate measurement error into the operation of these charts, we adopt a linear covariate error model. We describe, step by step, how the parameters of the underlying model evolve as the process moves from an in-control to an out-of-control state, and we deliberately avoid the restrictive premise that the observed shift magnitude is unrelated to the measurement errors. The run length characteristics of the charts are obtained by means of a Markov chain formulation. A series of numerical experiments makes clear that measurement error erodes the detection capability of the charts. A particularly useful outcome of the investigation is that collecting several measurements on each inspected unit does not constitute an efficient remedy for the adverse influence of measurement error on the performance of the Synthetic-RZ charts.
Editorial analysis
A structured set of objections, weighed in public.
Referee Report
Summary. The manuscript studies the effect of measurement errors on one-sided Synthetic-RZ control charts for the ratio of two normal variables. It adopts a linear covariate error model, derives the evolution of in-control and out-of-control parameters without assuming the shift size is independent of the errors, obtains zero-state and steady-state ARLs via a Markov-chain formulation, and uses numerical experiments to conclude that measurement error reduces detection power while multiple measurements per unit do not provide an efficient remedy.
Significance. If the parameter-evolution derivations are exact, the results usefully quantify the sensitivity of ratio-monitoring charts to measurement error and supply a practical warning against relying on replication as mitigation. The Markov-chain ARL approach and explicit avoidance of the independence assumption are methodological strengths; the simulation-based nature with author-selected parameters, however, makes the quantitative erosion claims dependent on the specific scenarios examined.
major comments (2)
- [model description and parameter evolution (abstract and §3–4)] The central claim that measurement error erodes detection capability rests on the linear covariate error model correctly inducing the observed ratio parameters under shifts. Because the monitored quantity is a ratio of normals, additive linear errors on the separate variables produce a nonlinear transformation on the ratio; the step-by-step parameter evolution and subsequent Markov-chain ARL derivation must therefore be shown to use the exact induced distribution (or a rigorously justified approximation) rather than an implicit linear approximation on the ratio itself. This is load-bearing for both the ARL values and the conclusion that multiple measurements are inefficient.
- [numerical experiments section] The numerical experiments report ARL erosion and the inefficiency of replication, yet the in-control and out-of-control parameter choices are author-specified. Without explicit sensitivity checks or a demonstration that the reported qualitative conclusions survive reasonable variation in those choices, the strength of the practical recommendation is limited.
minor comments (2)
- Clarify the exact distributional form assumed for the observed ratio under the error model (e.g., whether it remains approximately normal or uses the exact ratio distribution) and state any truncation or approximation steps explicitly.
- Add a brief table or figure summarizing the Markov-chain states and transition probabilities to improve reproducibility of the ARL calculations.
Simulated Author's Rebuttal
We thank the referee for the careful and constructive review. We address each major comment below, providing clarifications on the derivations and agreeing to strengthen the numerical section with additional analyses.
read point-by-point responses
-
Referee: The central claim that measurement error erodes detection capability rests on the linear covariate error model correctly inducing the observed ratio parameters under shifts. Because the monitored quantity is a ratio of normals, additive linear errors on the separate variables produce a nonlinear transformation on the ratio; the step-by-step parameter evolution and subsequent Markov-chain ARL derivation must therefore be shown to use the exact induced distribution (or a rigorously justified approximation) rather than an implicit linear approximation on the ratio itself. This is load-bearing for both the ARL values and the conclusion that multiple measurements are inefficient.
Authors: We appreciate the referee drawing attention to this point. The derivations start from the linear error model applied separately to each variable (X' = X + ε_x, Y' = Y + ε_y), yielding the observed ratio R' = X'/Y'. Exact means and variances of the observed variables are obtained under in-control and out-of-control conditions, with the shift incorporated directly into the true parameters without any independence assumption. The ratio of two normals then follows its known (non-central) distribution, whose parameters are used to set chart limits and construct the Markov-chain transition matrix. No linear approximation is imposed on the ratio; the nonlinearity is preserved through these exact induced parameters. We will revise §3 to include an expanded, step-by-step derivation that explicitly states the use of the exact distribution. revision: partial
-
Referee: The numerical experiments report ARL erosion and the inefficiency of replication, yet the in-control and out-of-control parameter choices are author-specified. Without explicit sensitivity checks or a demonstration that the reported qualitative conclusions survive reasonable variation in those choices, the strength of the practical recommendation is limited.
Authors: The selected parameter values follow conventions in the ratio-monitoring and measurement-error literature. We agree, however, that explicit sensitivity checks would reinforce the practical conclusions. In the revised manuscript we will add a dedicated sensitivity subsection (or supplementary tables) that recomputes the zero-state and steady-state ARLs under varied error variances, correlations, and shift sizes, confirming that the qualitative findings on detection-power loss and the limited value of replication hold across these scenarios. revision: yes
Circularity Check
No significant circularity; results from independent Markov-chain simulations
full rationale
The paper adopts a linear covariate error model, derives in-control and out-of-control parameters step-by-step, obtains ARLs via standard Markov-chain formulation, and reports numerical experiments on the effect of measurement error. No quoted equations or steps reduce a reported ARL or performance claim to a fitted parameter or self-citation by construction. The simulation outcomes are generated from the model assumptions rather than being tautological with the inputs. The central claim therefore remains self-contained against external benchmarks.
Axiom & Free-Parameter Ledger
axioms (2)
- domain assumption A linear covariate error model accurately represents the effect of measurement errors on the observed ratio of two normal variables.
- domain assumption A Markov chain formulation correctly yields the zero-state and steady-state average run lengths for the Synthetic-RZ charts under the error model.
Reference graph
Works this paper leans on
-
[1]
Brook and D.A
D. Brook and D.A. Evans. An approach to the probability distribution of CUSUM run length.Biometrika, 59(3):539–549, 1972
1972
-
[2]
Cedilnik, K
A. Cedilnik, K. Kosmelj, and A. Blejec. The Distribution of the Ratio of Jointly Normal Variables.Metodoloski Zvezki, 1(1):99–108, 2004
2004
-
[3]
Celano and P
G. Celano and P. Castagliola. A Synthetic Control Chart for Monitoring the Ratio of Two Normal Variables.Quality and Reliability Engineering International, 32(2):681–696, 2016
2016
-
[4]
Celano and P
G. Celano and P. Castagliola. Design of a phase II Control Chart for Monitoring the Ratio of two Normal Variables.Quality and Reliability Engineering International, 32(1):291–308, 2016
2016
-
[5]
Celano, P
G. Celano, P. Castagliola, A. Faraz, and S. Fichera. Statistical Per- formance of a Control Chart for Individual Observations Monitoring 27 the Ratio of two Normal Variables.Quality and Reliability Engineering International, 30(8):1361–1377, 2014
2014
-
[6]
X.B. Cheng and F. K. Wang. The performance of EWMA median and cusum median control charts for a normal process with measurement errors.Quality and Reliability Engineering International, 2017. DOI: 10.1002/qre.2248 (to appear)
-
[7]
Costa and M.A
A.F.B. Costa and M.A. Rahim. A Synthetic Control Chart for Monitor- ing the Process Mean and Variance.Journal of Quality in Maintenance Engineering, 12(1):81–88, 2006
2006
-
[8]
Darroch and E
J.N. Darroch and E. Seneta. On quasi-stationary distributions in ab- sorbing discrete-time finite markov chains.Journal of Applied Proba- bility, 2(1):88–100, 1965
1965
-
[9]
Davis and W.H
R.B. Davis and W.H. Woodall. Evaluting and Improving the Synthetic Control Chart.Journal of Quality Technology, 34(2):200–208, 2002
2002
-
[10]
R.C. Geary. The Frequency Distribution of the Quotient of Two Normal Variates.Journal of the Royal Statistical Society, 93(3):442–446, 1930
1930
-
[11]
Hayya, D
J. Hayya, D. Armstrong, and N. Gressis. A note on the Ratio of Two Normally Distributed Variables.Management Science, 21(11):1338– 1341, 1975
1975
-
[12]
The Exponentially Weighted Moving Average.Journal of Quality Technology, 18:203–210, 1986
J.S Hunter. The Exponentially Weighted Moving Average.Journal of Quality Technology, 18:203–210, 1986
1986
-
[13]
Linna and W.H
K.W. Linna and W.H. Woodall. Effect of measurement error on shewart control chart.Jornal of Quality Technology, 33(2):213–222, 2001
2001
-
[14]
Linna, W.H
K.W. Linna, W.H. Woodall, and K.L. Busby. The performance of mul- tivariate control charts in the presence of measurement error.Journal of Quality Technology, 33(3):349, 2001
2001
-
[15]
Nguyen, K.P.Tran, and C
H.D. Nguyen, K.P.Tran, and C. Heuchenne. Monitoring the ratio of two normal variables using variable sampling interval exponentially weighted moving average control charts.Quality and Reliability En- gineering Interanational, 35(1):439–460, 2019
2019
-
[16]
Nguyen, Q.T
H.D. Nguyen, Q.T. Nguyen, K.P. Tran, , and D.P. Ho. On the per- formance of vsi shewhart control chart for monitoring the coefficient of variation in the presence of measurement errors.The International Journal of Advanced Manufacturing Technology, pages 1–33, 2019
2019
-
[17]
Effect of the measurement errors on two one?sided shewhart control charts for monitoring the ratio of two 28 normal variables.Quality and Reliability Engineering International, 05
Huu-Du Nguyen and Kim Phuc Tran. Effect of the measurement errors on two one?sided shewhart control charts for monitoring the ratio of two 28 normal variables.Quality and Reliability Engineering International, 05
-
[18]
doi: 10.1002/qre.2656
-
[19]
T. H. Nguyen, H. D. Nguyen, K. D. Tran, T. H. Truong, K. H. Phung, L. H. Nguyen, T. T. N. Le, and K. P. Tran. One-sided synthetic-rz con- trol charts: a new method for anomaly detection. In2019 6th NAFOS- TED Conference on Information and Computer Science (NICS), pages 262–267, 2019
2019
-
[20]
Pham-Gia, N
T. Pham-Gia, N. Turkkan, and E. Marchand. Density of the ratio of two normal random variables and applications.Communications in Statistics - Theory and Methods, 35(9):1569–1591, 2006
2006
-
[21]
Shewhart.Economic Control of Quality of Manufactured Product
W.A. Shewhart.Economic Control of Quality of Manufactured Product. Van Nostrand, New York, 1931
1931
-
[22]
One-sided synthetic control charts for monitoring the coefficient of variation with measurement errors
Kim Phuc Tran, HD Nguyen, Quoc Thong Nguyen, and W Chattin- nawat. One-sided synthetic control charts for monitoring the coefficient of variation with measurement errors. In2018 IEEE international con- ference on industrial engineering and engineering management (IEEM), pages 1667–1671. IEEE, 2018
2018
-
[23]
K.P. Tran. Run rules median control charts for monitoring process mean in manufacturing.Quality and Reliability Engineering International, 2017
2017
-
[24]
Tran and S
K.P. Tran and S. Knoth. Steady-state arl analysis of arl-unbiased ewma- rz control chart monitoring the ratio of two normal variables.Qual Reliab Eng Int., pages 1–14, 2018
2018
-
[25]
K.P. Tran, P. Castagliola, and G. Celano. Monitoring the Ratio of Two Normal Variables Using EWMA Type Control Charts.Quality and Reliability Engineering International, 32(2):1853–1869, 2016
2016
-
[26]
K.P. Tran, P. Castagliola, and G. Celano. Monitoring the Ratio of Pop- ulation Means of a Bivariate Normal distribution using CUSUM Type Control Charts.Statistical Papers, 2016. In press, DOI: 10.1007/s00362- 016-0769-4
-
[27]
K.P. Tran, P. Castagliola, and G. Celano. Monitoring the Ratio of Two Normal Variables Using Run Rules Type Control Charts.International Journal of Production Research, 54(6):1670–1688, 2016
2016
-
[28]
K.P. Tran, P. Castagliola, and G. Celano. The performance of the Shewhart-RZ control chart in the presence of measurement error.In- ternational Journal of Production Research, 54:7504–7522, 2016. 29
2016
-
[29]
K.P. Tran, P. Castagliola, and N. Balakrishnan. On the performance of shewhart median chart in the presence of measurement errors.Quality and Reliability Engineering International, 33(5):1019–1029, 2017
2017
-
[30]
K.P. Tran, C. Heuchenne, N. Balakrishnan, and M. Khoo. On the performance of coefficient of variation charts in the presence of mea- surement errors.Quality and Reliability Engineering International, In press, 2018. doi: 10.1002/qre2402
-
[31]
Tran and K
P.H. Tran and K. P. Tran. The efficiency of CUSUM schemes for moni- toring the coefficient of variation.Applied Stochastic Models in Business and Industry, 32(6):870–881, 2016
2016
-
[32]
A syn- thetic median control chart for monitoring the process mean with mea- surement errors.Quality and Reliability Engineering International, 35 (4):1100–1116, 2019
Phuong Hanh Tran, Kim Phuc Tran, and Athanasios Rakitzis. A syn- thetic median control chart for monitoring the process mean with mea- surement errors.Quality and Reliability Engineering International, 35 (4):1100–1116, 2019
2019
-
[33]
Wu and T.A
Z. Wu and T.A. Spedding. A Synthetic Control Chart for Detecting Small Shifts in the Process Mean.Journal of Quality Technology, 32 (1):32–38, 2000
2000
-
[34]
Yeong, M.B.C
W.C. Yeong, M.B.C. Khoo, S.L. Lim, and W.L. Teoh. The coefficient of variation chart with measurement error.Quality Technology & Quan- titative Management, pages 1–25, 2017. 30
2017
discussion (0)
Sign in with ORCID, Apple, or X to comment. Anyone can read and Pith papers without signing in.