A machine-learning-assisted progressive digit-randomness screening framework for detecting non-random patterns in raw numerical research data
Pith reviewed 2026-06-27 22:24 UTC · model grok-4.3
The pith
A statistical and machine learning framework detects non-random digit patterns in raw numerical research data.
A machine-rendered reading of the paper's core claim, the machinery that carries it, and where it could break.
Core claim
FDRS integrates single- and joint-decimal-digit tests, Cramer's V, entropy metrics, Kullback-Leibler divergence, digit-preference indices, progressive subsampling, and semi-supervised risk scoring. Evaluated on an enzymatic absorbance dataset and a manually simulated irregular dataset, Elastic-net Logistic Regression reached an AUC of 0.98395 while the irregular set received a markedly higher ensemble risk score and Grade 3 versus Grade 0 for the clean set. External real-world benchmarks aligned with the graded stratification.
What carries the argument
The Fabrication-risk Digit Randomness Screening (FDRS) model, which fuses multiple digit-randomness statistical tests with machine-learning classifiers to generate ensemble risk scores and grades.
If this is right
- Clean datasets receive low ensemble risk scores and Grade 0 while irregular datasets receive higher scores and Grade 3.
- Elastic-net Logistic Regression yields the highest AUC and lowest Brier score among the classifiers tested.
- The framework can prioritize raw numerical datasets for further review as an auxiliary tool.
- Datasets from articles with public post-publication concerns receive Grade 2 or 3 while clean datasets receive Grade 0 or 1.
Where Pith is reading between the lines
- If the separation generalizes, data repositories could apply the screening automatically on upload.
- The progressive subsampling step might be adapted to monitor digit patterns during ongoing data collection.
- Pairing digit-structure screening with existing checks on summary statistics could produce layered integrity pipelines.
Load-bearing premise
The manually simulated ErrData with introduced irregularities accurately represents the digit-pattern signatures that would appear in real cases of data fabrication or manipulation.
What would settle it
Running FDRS on a larger collection of published datasets where fabrication or manipulation has been independently confirmed by other means and checking whether the risk scores and grades separate them from matched clean datasets.
Figures
read the original abstract
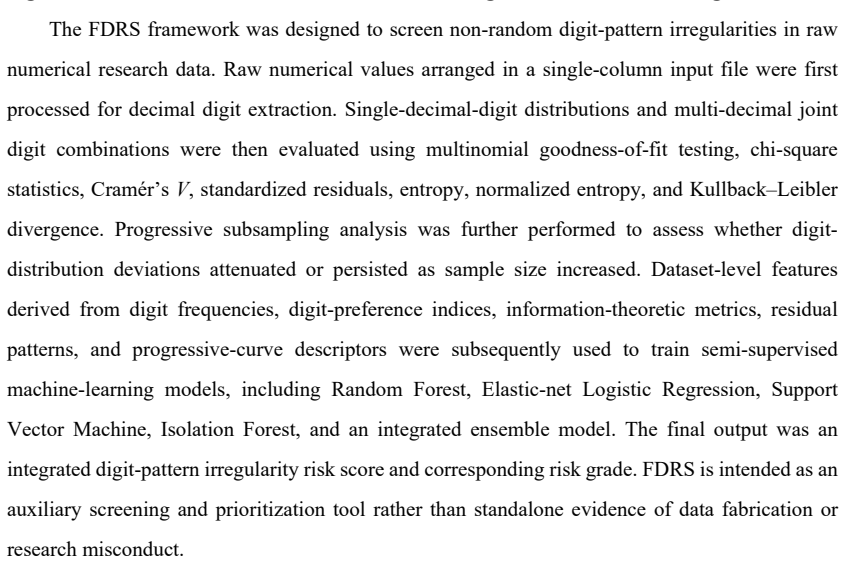
Raw numerical datasets remain less systematically examined in integrity screening than images, plagiarism, or summary-statistic inconsistencies. We developed the Fabrication-risk Digit Randomness Screening model (FDRS), a statistical and machine-learning framework for detecting non-random digit-pattern irregularities in numerical research data. FDRS integrates single- and joint-decimal-digit tests, Cramer's V, entropy metrics, Kullback-Leibler divergence, digit-preference indices, progressive subsampling, and semi-supervised risk scoring. It was evaluated using an instrument-derived enzymatic absorbance dataset (RawData, n=253) and a blinded manually simulated irregular dataset (ErrData, n=255). RawData showed no significant deviation in single third-decimal-digit analysis, whereas ErrData showed a significant deviation. In joint third-fourth decimal digit analysis, ErrData showed higher Cramer's V, lower normalized entropy, higher KL divergence, and a more persistent progressive-subsampling deviation signal. In internal validation, Elastic-net Logistic Regression achieved the highest AUC (0.98395) and lowest Brier score (0.048439), while Random Forest achieved the highest accuracy (0.926667) and balanced accuracy (0.935). RawData received a low ensemble risk score of 0.124627 and was classified as Grade 0; ErrData received a score of 0.740760 and was classified as Grade 3. External real-world benchmarks supported graded risk stratification: three datasets without identified public post-publication concerns were classified as Grade 0 or 1, whereas two datasets from publicly questioned or institutionally handled articles were classified as Grade 2 or 3. FDRS can prioritize raw numerical datasets for further review by integrating interpretable statistical and machine-learning features. It is an auxiliary digit-structure screening tool, not standalone evidence of fabrication or misconduct.
Editorial analysis
A structured set of objections, weighed in public.
Referee Report
Summary. The paper presents the Fabrication-risk Digit Randomness Screening (FDRS) framework, which integrates single- and joint-decimal-digit frequency tests, Cramer's V, normalized entropy, Kullback-Leibler divergence, digit-preference indices, progressive subsampling, and semi-supervised ensemble risk scoring to flag non-random patterns in raw numerical research data. It evaluates the approach on an instrument-derived enzymatic absorbance dataset (RawData, n=253) versus a blinded manually simulated irregular dataset (ErrData, n=255), reports Elastic-net logistic regression achieving AUC 0.98395 on internal validation, assigns low risk (Grade 0) to RawData and high risk (Grade 3) to ErrData, and shows graded stratification on five external real-world benchmarks.
Significance. If the digit-pattern signatures engineered into the ErrData simulation prove representative of actual data manipulation and the ML evaluation avoids circularity, FDRS could provide a useful auxiliary, interpretable screening tool for prioritizing raw datasets for further integrity review. The combination of multiple statistical features with progressive subsampling and external benchmark results offers a concrete starting point for data-forensics methods in the numerical domain.
major comments (2)
- [Abstract / evaluation] Abstract and evaluation section: the central performance claim (Elastic-net LR AUC 0.98395, ErrData risk score 0.740760 Grade 3 vs RawData 0.124627 Grade 0) rests on a single manually simulated ErrData set (n=255) whose construction details—specifically how the joint third-fourth decimal deviations, Cramer's V elevation, entropy drop, KL increase, and progressive-subsampling persistence were introduced—are not described, so it is impossible to assess whether these engineered signatures match patterns in documented real-world fabrication cases.
- [Methods / internal validation] Methods / ML validation paragraph: the feature vector for the classifiers includes statistics (Cramer's V, entropy, KL divergence, digit-preference indices) computed directly on the same raw data being scored; without an explicit out-of-sample protocol, cross-validation scheme, or shipped code, the reported AUC and Brier score may reflect in-sample fitting rather than genuine detection of fabrication signatures.
minor comments (2)
- [Abstract] The abstract states 'internal validation' but supplies no sample sizes for the train/test split, no error bars on AUC, and no exclusion criteria for the progressive subsampling; these details belong in the main text.
- [Results / external benchmarks] External benchmark results are summarized only as 'three datasets ... Grade 0 or 1' and 'two datasets ... Grade 2 or 3'; listing the actual risk scores and grades for each of the five named datasets would strengthen the stratification claim.
Simulated Author's Rebuttal
We thank the referee for the constructive feedback on our manuscript describing the FDRS framework. Below we respond point-by-point to the major comments, indicating planned revisions where appropriate.
read point-by-point responses
-
Referee: [Abstract / evaluation] Abstract and evaluation section: the central performance claim (Elastic-net LR AUC 0.98395, ErrData risk score 0.740760 Grade 3 vs RawData 0.124627 Grade 0) rests on a single manually simulated ErrData set (n=255) whose construction details—specifically how the joint third-fourth decimal deviations, Cramer's V elevation, entropy drop, KL increase, and progressive-subsampling persistence were introduced—are not described, so it is impossible to assess whether these engineered signatures match patterns in documented real-world fabrication cases.
Authors: We agree that additional detail on the ErrData simulation protocol is required for readers to judge how closely the introduced signatures align with documented fabrication patterns. In the revised manuscript we will expand the Methods section with a step-by-step description of the simulation procedure, including the specific manipulations used to generate the observed joint-digit deviations, elevated Cramer's V, reduced entropy, increased KL divergence, and persistent progressive-subsampling signal, while preserving the blinded character of the exercise. revision: yes
-
Referee: [Methods / internal validation] Methods / ML validation paragraph: the feature vector for the classifiers includes statistics (Cramer's V, entropy, KL divergence, digit-preference indices) computed directly on the same raw data being scored; without an explicit out-of-sample protocol, cross-validation scheme, or shipped code, the reported AUC and Brier score may reflect in-sample fitting rather than genuine detection of fabrication signatures.
Authors: The reported AUC was obtained via cross-validation, but the original text did not sufficiently document the protocol. We will revise the Methods section to specify the cross-validation design (including fold count and the manner in which features were recomputed within each training fold to prevent leakage), the separation between feature extraction and model evaluation, and the Brier-score calculation. We will also indicate that the analysis code will be made available upon acceptance. revision: yes
Circularity Check
No significant circularity; derivation is self-contained
full rationale
The paper computes a fixed set of statistical features (single/joint digit tests, Cramer's V, entropy, KL divergence, digit-preference indices, progressive subsampling) on two input collections (instrument RawData and manually simulated ErrData), trains standard classifiers on those features, reports internal-validation AUC, and applies the fitted ensemble to produce risk scores on held-out external datasets. No equation or procedure reduces a claimed output to an input by definition, renames a fitted parameter as a prediction, or rests on a self-citation chain; the external benchmarks are independent of the training split and the simulation is presented as an evaluation construct rather than a derived result.
Axiom & Free-Parameter Ledger
Reference graph
Works this paper leans on
-
[1]
Definition of Research Misconduct
Integrity OoR. Definition of Research Misconduct. Rockville, MD: U.S. Department of Health and Human Services; Accessed 30 May 2026
2026
-
[2]
Federal Research Misconduct Policy
Integrity OoR. Federal Research Misconduct Policy. Rockville, MD: U.S. Department of Health and Human Services; 2000 Accessed 30 May 2026
2000
-
[3]
Fanelli D. How many scientists fabricate and falsify research? A systematic review and meta-analysis of survey data. PLoS One. 2009;4(5):e5738. Epub 20090529. doi: 10.1371/journal.pone.0005738. PubMed PMID: 19478950; PubMed Central PMCID: PMCPMC2685008
-
[4]
Xie Y , Wang K, Kong Y . Prevalence of Research Misconduct and Questionable Research Practices: A Systematic Review and Meta-Analysis. Sci Eng Ethics. 2021;27(4):41. Epub 20210629. doi: 10.1007/s11948-021-00314-9. PubMed PMID: 34189653
-
[5]
COPE Flowcharts and Infographics: Fabricated Data in a Submitted Manuscript
Council C. COPE Flowcharts and Infographics: Fabricated Data in a Submitted Manuscript. Version 1, April 2023 ed. London, UK: Committee on Publication Ethics; 2023 Accessed 30 May 2026
2023
-
[6]
COPE Flowcharts and Infographics: Fabricated Data in a Published Article
Council C. COPE Flowcharts and Infographics: Fabricated Data in a Published Article. Version 1, April 2023 ed. London, UK: Committee on Publication Ethics; 2023 Accessed 30 May 2026
2023
-
[7]
The prevalence of statistical reporting errors in psychology (1985-2013)
Nuijten MB, Hartgerink CHJ, van Assen MALM, Epskamp S, Wicherts JM. The prevalence of statistical reporting errors in psychology (1985-2013). Behavior Research Methods. 2016;48(4):1205-26. doi: 10.3758/s13428-015-0664-2
-
[8]
Brown NJL, Heathers JAJ. The GRIM Test: A Simple Technique Detects Numerous Anomalies in the Reporting of Results in Psychology. Social Psychological and Personality Science. 2017;8(4):363-9. doi: 10.1177/1948550616673876
-
[9]
statcheck: Extract Statistics from Articles and Recompute P Values
Epskamp S, Nuijten MB. statcheck: Extract Statistics from Articles and Recompute P Values. Vienna, Austria: Comprehensive R Archive Network
-
[10]
Baggerly KA, Coombes KR. Deriving chemosensitivity from cell lines: Forensic bioinformatics and reproducible research in high-throughput biology. The Annals of Applied Statistics. 2009;3(4):1309-34. doi: 10.1214/09-aoas291
-
[11]
Investigating and preventing scientific misconduct using Benford's Law
Eckhartt GM, Ruxton GD. Investigating and preventing scientific misconduct using Benford's Law. Res Integr Peer Rev. 2023;8(1):1. Epub 20230411. doi: 10.1186/s41073- 022- 00126-w. PubMed PMID: 37041616; PubMed Central PMCID: PMCPMC10088595
-
[12]
Detecting fabrication in large-scale molecular omics data
Bradshaw MS, Payne SH. Detecting fabrication in large-scale molecular omics data. PLoS One. 2021;16(11):e0260395. Epub 20211130. doi: 10.1371/journal.pone.0260395. PubMed PMID: 34847169; PubMed Central PMCID: PMCPMC8631639
-
[13]
Data fabrication: Can people generate random digits? Accountability in Research
Mosimann JE, Wiseman CV , Edelman RE. Data fabrication: Can people generate random digits? Accountability in Research. 1995;4(1):31-55. doi: 10.1080/08989629508573866
-
[14]
Terminal Digits and the Examination of Questioned Data
Mosimann J, Dahlberg J, Davidian N, Krueger J. Terminal Digits and the Examination of Questioned Data. Accountability in Research. 2002;9(2):75-92. doi: 10.1080/08989620212969
-
[15]
Statistical Forensics: Check Rightmost Digits for Uniform Distribution
Integrity USOoR. Statistical Forensics: Check Rightmost Digits for Uniform Distribution. Rockville, MD: U.S. Department of Health and Human Services; Accessed 30 May 2026
2026
-
[16]
Statistical Forensics
Integrity USOoR. Statistical Forensics. Rockville, MD: U.S. Department of Health and Human Services; Accessed 30 May 2026
2026
-
[17]
Are these data real? Statistical methods for the detection of data fabrication in clinical trials
Al-Marzouki S, Evans S, Marshall T, Roberts I. Are these data real? Statistical methods for the detection of data fabrication in clinical trials. Bmj. 2005;331(7511):267 -70. doi: 10.1136/bmj.331.7511.267. PubMed PMID: 16052019; PubMed Central PMCID: PMCPMC1181267
-
[18]
Carlisle JB. Data fabrication and other reasons for non -random sampling in 5087 randomised, controlled trials in anaesthetic and general medical journals. Anaesthesia. 2017;72(8):944-52. Epub 20170604. doi: 10.1111/anae.13938. PubMed PMID: 28580651
-
[19]
Methods to assess research misconduct in health -related research: A scoping review
Bordewijk EM, Li W, van Eekelen R, Wang R, Showell M, Mol BW, et al. Methods to assess research misconduct in health -related research: A scoping review. Journal of Clinical Epidemiology. 2021;136:189-202. doi: https://doi.org/10.1016/j.jclinepi.2021.05.012
-
[20]
Zheng H, Liu J, Cheng Q, Zhang Q, Zhang Y , Jiang L, et al. Targeted activation of ferroptosis in colorectal cancer via LGR4 targeting overcomes acquired drug resistance. Nature Cancer. 2024;5(4):572-89. doi: 10.1038/s43018-023-00715-8
-
[22]
Author Correction: Human HDAC6 senses valine abundancy to regulate DNA damage
Jin J, Meng T, Yu Y , Wu S, Jiao C-C, Song S, et al. Author Correction: Human HDAC6 senses valine abundancy to regulate DNA damage. Nature. 2025;644(8076):E34-E. doi: 10.1038/s41586-025-09409-w
-
[23]
Human HDAC6 senses valine abundancy to regulate DNA damage
Foundation P. PubPeer comments: Human HDAC6 senses valine abundancy to regulate DNA damage: PubPeer; 2026 [PubPeer comments page for the article "Human HDAC6 senses valine abundancy to regulate DNA damage"; Nature; DOI: 10.1038/s41586- 024-08248-5; PubMed ID: 39567688.]. 2026-06- 01:[Available from: https://pubpeer.com/publications/429F23C68462E5C1A09175C3CD8B07
-
[24]
Foundation P. PubPeer comments: Targeted activation of ferroptosis in colorectal cancer via LGR4 targeting overcomes acquired drug resistance: PubPeer; 2026 [PubPeer comments page for the article "Targeted activation of ferroptosis in colorectal cancer vi a LGR4 targeting overcomes acquired drug resistance"; Nature Cancer; DOI: 10.1038/s43018 -023-00715-8...
-
[25]
Targeted activation of ferroptosis in colorectal cancer via LGR4 targeting overcomes acquired drug resistance
University N. Situation report: Nankai University; 2026 [updated 2026-05 -30Official institutional notice concerning data-integrity issues related to the article "Targeted activation of ferroptosis in colorectal cancer via LGR4 targeting overcomes acquired drug resistance".]. 2026-06-01:[Available from: https://www.nankai.edu.cn/2026/0530/c17471a596704/page.htm
2026
-
[26]
Human HDAC6 senses valine abundancy to regulate DNA damage
University T. Situation report: Tongji University News Center; 2026 [updated 2026-05 - 06Official institutional notice concerning data -integrity issues related to the article "Human HDAC6 senses valine abundancy to regulate DNA damage".]. 2026 -06-01:[Available from: https://news.tongji.edu.cn/info/1008/94355.htm
2026
-
[27]
Interferon restores replication fork stability and cell viability in BRCA -defective cells via ISG15
Moro RN, Biswas U, Kharat SS, Duzanic FD, Das P, Stavrou M, et al. Interferon restores replication fork stability and cell viability in BRCA -defective cells via ISG15. Nature Communications. 2023;14(1):6140. doi: 10.1038/s41467-023-41801-w
-
[28]
Clonal barcoding with qPCR detection enables live cell functional analyses for cancer research
Guo Q, Spasic M, Maynard AG, Goreczny GJ, Bizuayehu A, Olive JF, et al. Clonal barcoding with qPCR detection enables live cell functional analyses for cancer research. Nature Communications. 2022;13(1):3837. doi: 10.1038/s41467-022-31536-5
-
[29]
Khan UK, Goel A, Nigam S, Chaudhary N, Praveen A, Roy A, et al. DKC1 promotes colorectal cancer progression and therapy resistance by dysregulating sphingolipid biosynthesis. Nature Communications. 2026;17(1):4406. doi: 10.1038/s41467-026-72800-2
-
[30]
Pearson K. X. On the criterion that a given system of deviations from the probable in the case of a correlated system of variables is such that it can reasonably be supposed to have arisen from random sampling. The London, Edinburgh, and Dublin Philosophi cal Magazine and Journal of Science. 1900;50(302):157-75. doi: 10.1080/14786440009463897
-
[31]
Mathematical Methods of Statistics
Cramér H. Mathematical Methods of Statistics. Princeton, NJ: Princeton University Press; 1946
1946
-
[32]
A bias-correction for Cramér's V and Tschuprow's T
Bergsma W. A bias-correction for Cramér's V and Tschuprow's T. Journal of the Korean Statistical Society. 2013;42(3):323-8. doi: 10.1016/j.jkss.2012.10.002
-
[33]
Shannon CE. A mathematical theory of communication. The Bell System Technical Journal. 1948;27(3):379-423. doi: 10.1002/j.1538-7305.1948.tb01338.x
-
[34]
The measurement of diversity in different types of biological collections
Pielou EC. The measurement of diversity in different types of biological collections. Journal of Theoretical Biology. 1966;13:131-44. doi: 10.1016/0022-5193(66)90013-0
-
[35]
Kullback S, Leibler RA. On information and sufficiency. The Annals of Mathematical Statistics. 1951;22(1):79-86. doi: 10.1214/aoms/1177729694
-
[36]
Breiman L. Random forests. Machine Learning. 2001;45(1):5-32. doi: 10.1023/a:1010933404324
-
[37]
Journal of the Royal Statistical Society Series B: Statistical Methodology , author=
Zou H, Hastie T. Regularization and variable selection via the elastic net. Journal of the Royal Statistical Society: Series B (Statistical Methodology). 2005;67(2):301 -20. doi: 10.1111/j.1467-9868.2005.00503.x
-
[38]
Regularization paths for generalized linear models via coordinate descent
Friedman J, Hastie T, Tibshirani R. Regularization paths for generalized linear models via coordinate descent. Journal of Statistical Software. 2010;33(1):1-22. doi: 10.18637/jss.v033.i01
-
[39]
Cortes C, Vapnik V . Support-vector networks. Machine Learning. 1995;20(3):273-97. doi: 10.1007/bf00994018
-
[40]
Probabilistic outputs for support vector machines and comparisons to regularized likelihood methods
Platt JC. Probabilistic outputs for support vector machines and comparisons to regularized likelihood methods. In: Smola AJ, Bartlett P, Schölkopf B, Schuurmans D, editors. Advances in Large Margin Classifiers. Cambridge, MA: MIT Press; 1999. p. 61-74
1999
-
[41]
Isolation Forest
Liu FT, Ting KM, Zhou Z-H. Isolation Forest. 2008 Eighth IEEE International Conference on Data Mining; Pisa, Italy: IEEE; 2008. p. 413-22
2008
-
[42]
Wolpert DH. Stacked generalization. Neural Networks. 1992;5(2):241 -59. doi: 10.1016/s0893-6080(05)80023-1
-
[43]
A study of cross -validation and bootstrap for accuracy estimation and model selection
Kohavi R. A study of cross -validation and bootstrap for accuracy estimation and model selection. Proceedings of the 14th International Joint Conference on Artificial Intelligence; Montreal, Canada: Morgan Kaufmann; 1995. p. 1137-43
1995
-
[44]
An introduction to ROC analysis
Fawcett T. An introduction to ROC analysis. Pattern Recognition Letters. 2006;27(8):861-
2006
-
[45]
doi: 10.1016/j.patrec.2005.10.010
-
[46]
Evaluation: From Precision, Recall and F-Measure to ROC, Informedness, Markedness and Correlation
Powers DMW. Evaluation: From Precision, Recall and F-Measure to ROC, Informedness, Markedness and Correlation. Journal of Machine Learning Technologies. 2011;2(1):37-63
2011
-
[47]
Verification of forecasts expressed in terms of probability
Brier GW. Verification of forecasts expressed in terms of probability. Monthly Weather Review. 1950;78(1):1-3. doi: 10.1175/1520-0493(1950)078<0001:V ofeit>2.0.Co;2. Figure 1 Figure 2 A B C DE F G H I Figure 3 A D K FG I K B CD E HJ Figure S1 AB C DE F GH I JK L MN O AB C DE F GH I JK L MN O Figure S2 InterpretationRisk gradeIntegrated risk score No appar...
discussion (0)
Sign in with ORCID, Apple, or X to comment. Anyone can read and Pith papers without signing in.