Peculiarities Of Phase States In N2O-CO2 Cryoalloys According To Electron Diffraction Data
Pith reviewed 2026-06-27 21:32 UTC · model grok-4.3
The pith
N2O-CO2 cryoalloys exhibit limited solubility and separate via spinodal decomposition at 5 K and 65 K.
A machine-rendered reading of the paper's core claim, the machinery that carries it, and where it could break.
Core claim
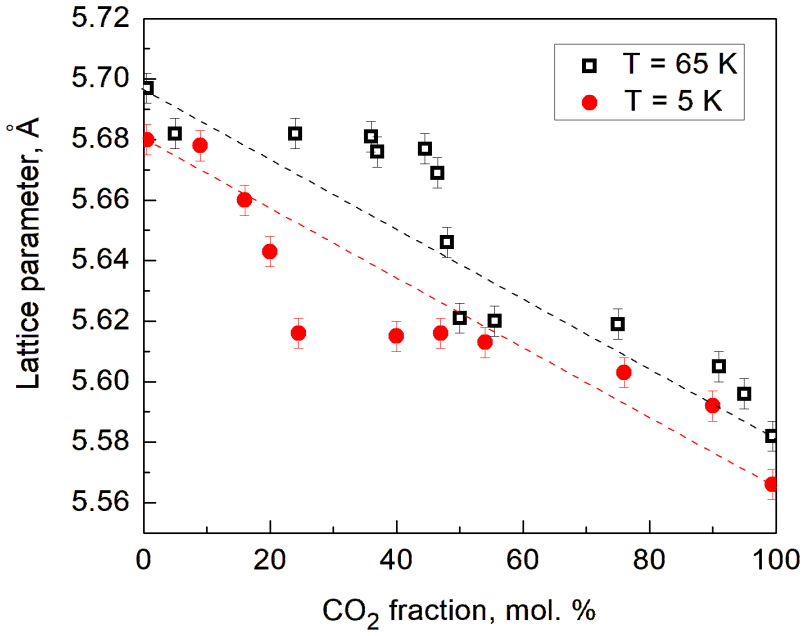
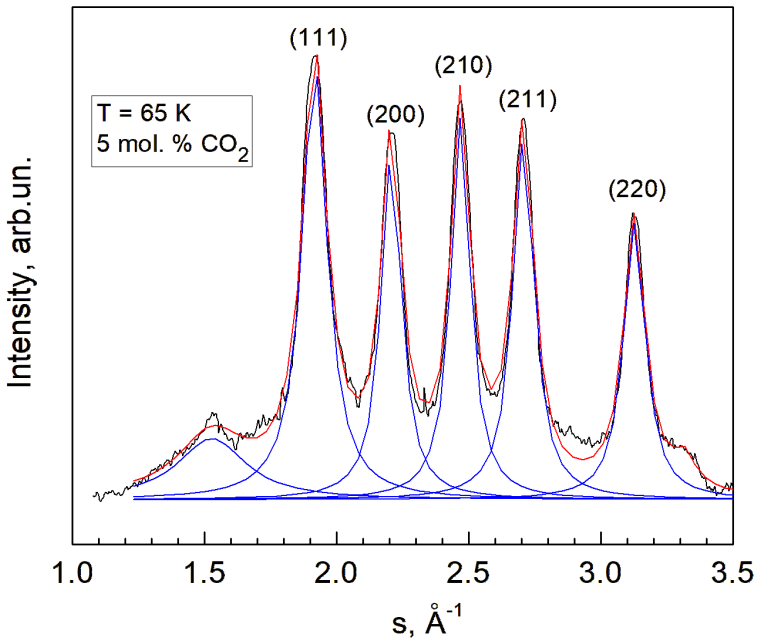
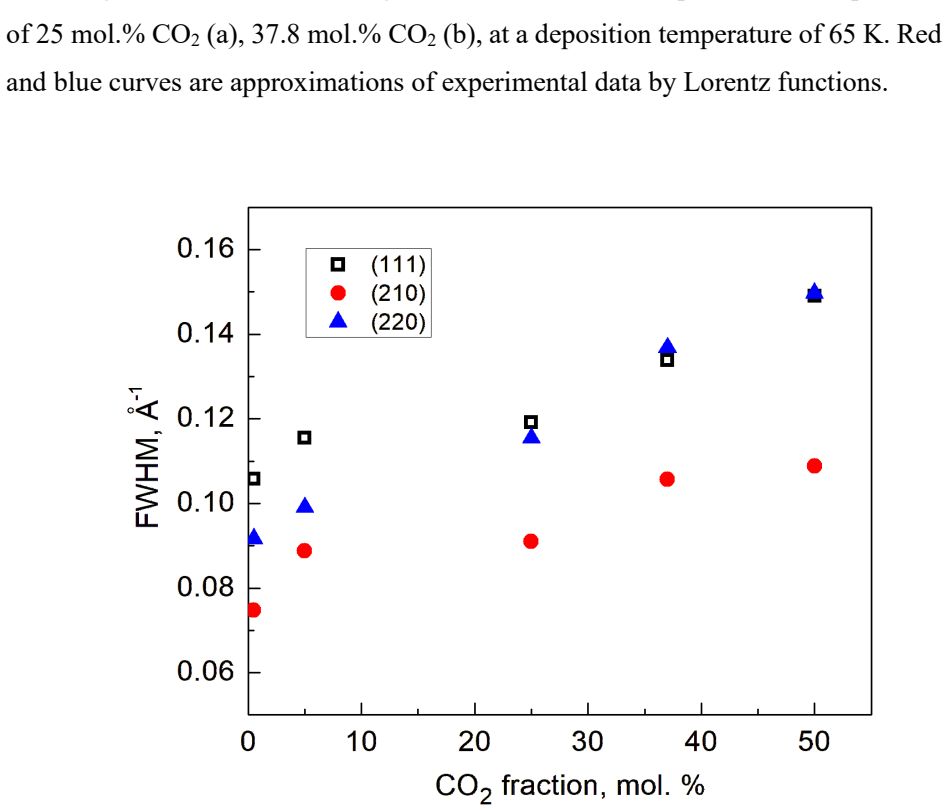
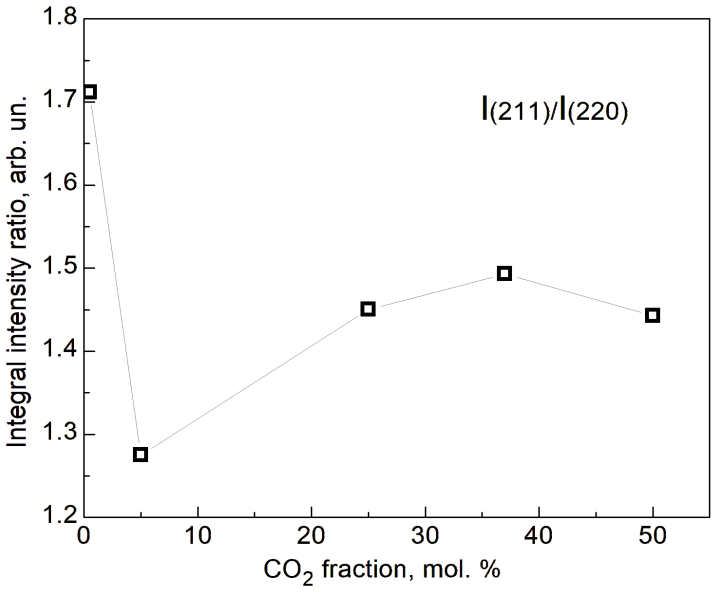
Transmission high-energy electron diffraction data show that lattice parameters vary continuously with composition only inside limited solubility intervals, beyond which the diffraction patterns split. At 65 K the maximum solubility reaches 11 mol.% CO2 in the N2O lattice and 30 mol.% N2O in the CO2 lattice; at 5 K the corresponding limits are below 20 mol.% and 35 mol.%. Profile analysis of diffraction intensity indicates that the separation follows spinodal decomposition rather than classical nucleation. Relative excess volumes of the minority component are extracted from the lattice-parameter shifts.
What carries the argument
Composition dependence of lattice parameters together with profile analysis of diffraction intensity distribution, used to locate solubility boundaries and identify the decomposition mechanism.
If this is right
- The N2O-CO2 phase diagram contains narrow single-phase solid-solution fields at cryogenic temperatures.
- Spinodal decomposition sets the kinetics of phase separation in these binary molecular alloys.
- Excess volumes of the impurity species can be used to estimate lattice strain in similar low-temperature mixtures.
- Regular-solution behavior is restricted to the narrow composition windows identified at each temperature.
Where Pith is reading between the lines
- The reported solubility values may constrain the possible compositions of mixed molecular ices on cold planetary surfaces or in interstellar environments.
- Analogous spinodal behavior could appear in other binary cryoalloys formed by linear triatomic molecules.
- Extending the measurements to intermediate temperatures would test whether the solubility limits change monotonically or show non-monotonic dependence.
Load-bearing premise
That measured shifts in lattice parameters and changes in diffraction intensity directly correspond to equilibrium solubility limits without significant influence from sample-preparation artifacts or non-equilibrium states.
What would settle it
If new diffraction patterns at the reported compositions show abrupt lattice jumps or intensity profiles consistent with nucleation-and-growth rather than continuous spinodal modulation, the solubility limits and mechanism would be contradicted.
Figures
read the original abstract
The structural characteristics of n2o-co2 alloys have been studied using transmission electron diffraction (THEED) across the entire range of their mutual concentrations at temperatures of 5 K and 65 K. The ranges in which regular solutions exist and intervals of alloy phase separation have been identified using the dependence of lattice parameters on composition and profile analysis of the diffraction pattern intensity distribution. It was found that maximum solubility values are up to 11 mol.% CO2 in the N2O matrix and up to 30 mol.% n2o in solid co2 at 65 K. The solubility limits for the components at 5 K are less 20 mol.% co2 in crystalline n2o and less than 35 mol.% n2o in a co2 crystal lattice. It was established that the character of n2o-co2 alloy separation corresponds to the mechanism of spinodal decomposition. The relative excess volumes that pertain to the admixture were determined for the CO2 impurity in solid n2o and for n2o impurity in co2 crystal. Conclusions regarding the character of n2o-co2 phase diagram have been made.
Editorial analysis
A structured set of objections, weighed in public.
Referee Report
Summary. The manuscript reports transmission electron diffraction (THEED) measurements on N2O-CO2 cryoalloys across the full composition range at 5 K and 65 K. Solubility ranges are identified from the composition dependence of lattice parameters combined with analysis of diffraction intensity profiles, yielding maximum solubilities of up to 11 mol.% CO2 in the N2O matrix and 30 mol.% N2O in solid CO2 at 65 K (and <20 mol.% / <35 mol.% at 5 K). The phase separation is concluded to proceed by spinodal decomposition, with relative excess volumes for the impurities also reported.
Significance. If the lattice-parameter shifts and intensity profiles reliably indicate equilibrium solubility limits rather than deposition artifacts, the work would supply useful experimental bounds on the low-temperature phase diagram of this binary system. Such data are relevant to cryogenic materials science and the modeling of mixed molecular ices. The approach of combining lattice-parameter variation with profile analysis is conventional for cryoalloy studies, but the absence of quantitative fitting details, error estimates, and equilibrium verification limits the immediate impact.
major comments (3)
- [Abstract] Abstract: the central solubility limits (11 mol.% CO2 in N2O and 30 mol.% N2O in CO2 at 65 K; <20/<35 mol.% at 5 K) and the spinodal assignment are stated without error bars, without a description of the lattice-parameter fitting procedure, and without any raw diffraction patterns or intensity profiles. These omissions prevent independent assessment of the precision and robustness of the numerical claims that constitute the paper's primary results.
- [Abstract] Abstract: the mapping from observed lattice-parameter dependence and intensity-profile shapes to equilibrium solubility limits and to the spinodal mechanism assumes the vapor-deposited films have reached thermodynamic equilibrium. No annealing protocols, reversibility tests, or checks against beam-heating/substrate-strain effects are mentioned, leaving open the possibility that the reported ranges reflect metastable states rather than bulk thermodynamics.
- [Abstract] Abstract: the statement that 'the character of N2O-CO2 alloy separation corresponds to the mechanism of spinodal decomposition' is presented as a direct conclusion from profile analysis, yet no quantitative criterion (e.g., comparison of observed vs. simulated profiles for spinodal vs. nucleation-and-growth) or example data are supplied to support the distinction.
minor comments (2)
- [Abstract] Abstract contains inconsistent capitalization ('n2o-co2', 'N2O', 'co2') and a grammatical error ('less 20 mol.%' should read 'less than 20 mol.%').
- [Abstract] The abstract refers to 'regular solutions' and 'intervals of alloy phase separation' without defining the concentration intervals or providing the corresponding composition ranges in the text.
Simulated Author's Rebuttal
We thank the referee for the careful and constructive review of our manuscript. We address each of the major comments point by point below, indicating where revisions will be made to improve clarity and transparency.
read point-by-point responses
-
Referee: [Abstract] Abstract: the central solubility limits (11 mol.% CO2 in N2O and 30 mol.% N2O in CO2 at 65 K; <20/<35 mol.% at 5 K) and the spinodal assignment are stated without error bars, without a description of the lattice-parameter fitting procedure, and without any raw diffraction patterns or intensity profiles. These omissions prevent independent assessment of the precision and robustness of the numerical claims that constitute the paper's primary results.
Authors: We agree that the abstract would benefit from explicit error estimates and a concise description of the analysis. The main text presents the lattice-parameter data and intensity profiles in figures, but we will revise the abstract to include approximate uncertainties derived from the scatter in the composition series and add a brief statement on the linear fitting of lattice parameters. Representative raw diffraction patterns and intensity profiles will be added to the revised manuscript or as supplementary material to allow independent assessment. revision: yes
-
Referee: [Abstract] Abstract: the mapping from observed lattice-parameter dependence and intensity-profile shapes to equilibrium solubility limits and to the spinodal mechanism assumes the vapor-deposited films have reached thermodynamic equilibrium. No annealing protocols, reversibility tests, or checks against beam-heating/substrate-strain effects are mentioned, leaving open the possibility that the reported ranges reflect metastable states rather than bulk thermodynamics.
Authors: The measurements were performed on vapor-deposited films under standard cryogenic conditions for this class of experiments. We did not conduct post-deposition annealing or reversibility tests, as the low temperatures (5 K and 65 K) and the experimental geometry limit such procedures. We will add a paragraph in the methods section explicitly stating these experimental constraints and the assumption that the observed states are representative of the low-temperature phase behavior, while noting that the results may correspond to kinetically accessible rather than fully equilibrated bulk thermodynamics. revision: partial
-
Referee: [Abstract] Abstract: the statement that 'the character of N2O-CO2 alloy separation corresponds to the mechanism of spinodal decomposition' is presented as a direct conclusion from profile analysis, yet no quantitative criterion (e.g., comparison of observed vs. simulated profiles for spinodal vs. nucleation-and-growth) or example data are supplied to support the distinction.
Authors: The spinodal assignment rests on the continuous, linear variation of lattice parameters across the composition range together with the absence of sharp two-phase intensity components in the diffraction profiles. We acknowledge that a direct quantitative comparison with simulated profiles for spinodal versus nucleation-and-growth mechanisms is not provided. We will expand the discussion section to include a more explicit justification based on established criteria for spinodal decomposition in molecular solids and will add example profile fits if space permits. revision: yes
Circularity Check
No significant circularity; experimental claims rest on direct observations without derivations or self-referential reductions
full rationale
The paper is an experimental study using THEED to measure lattice parameters and diffraction intensity profiles across compositions at 5 K and 65 K. Solubility limits and spinodal decomposition character are identified directly from these observations (e.g., 'using the dependence of lattice parameters on composition and profile analysis of the diffraction pattern intensity distribution'). No equations, fitted parameters renamed as predictions, self-citations, or ansatzes appear in the provided text. The derivation chain is absent; claims do not reduce to inputs by construction. This matches the default expectation for non-circular experimental reports.
Axiom & Free-Parameter Ledger
axioms (2)
- domain assumption Lattice parameter variation with composition directly reflects equilibrium solubility in the absence of other structural effects
- domain assumption Intensity profile analysis can distinguish regular solution from phase-separated states
Reference graph
Works this paper leans on
-
[1]
head-tail
Introduction Solid nitrous oxide (N 2O) and carbon dioxide ( CO2) belong to the class of molecular cryocrystals and exhibit similar molecular and crystalline parameters [1]. Solid molecular diluted systems are attractive objects for investigating fundamental physical phenomena, such as lattice dynamics, phase transitions, glassy states, and phase diagrams...
-
[2]
The experiments were performed within a temperature range of 5 – 65 K
Experiments The N2O–CO2 alloys were investigated by transmission high-energy electron diffraction (THEED) method using a cryostat integrated with an EG-100A electron diffractometer. The experiments were performed within a temperature range of 5 – 65 K. The electron diffraction technique is promising for detecting new phases, since it permits the identific...
-
[3]
step -like
Results and discussion In N2O–CO2, the initial components satisfy the Hume -Rothery requirements for unlimited solubility [25], as well as Kitaigorodsky’s solubility conditions for molecular crystals [26]. These conditions require similarity in particle shape and size, as well as matching structural symmetry – the structures of the mixed substances must b...
-
[4]
Specimens were prepared by depositing the gaseous mixture on substrates
Conclusions The structural characteristics of N2O–CO2 alloys produced at temperatures of 5 K and 65 K have been investigated across the entire range of their mutual concentrations using transmission electron diffraction (THEED). Specimens were prepared by depositing the gaseous mixture on substrates. The structure of N2O–CO2 samples with predominant N2O o...
-
[5]
Physics of Cryocrystals, edited by V . G. Manzhelii, Yu. A. Freiman, V . L. Klein, A. A. Maradudin, AIP Press, Woodbury (1997)
1997
-
[6]
W. C. Trogler, Coord. Chem. Rev. 187, 303 (1999) . https://doi.org/10.1016/S0010-8545(98)00254-9
-
[7]
R. N. Clark, R. Calson, W. Grundy and R. N. Noll, Observed Ices in the Solar Systems, in: The Science of Solar System Ices , M. S. Gudipati, J. Castillo-Rogez (eds), Astrophysics and Space Science Library 356, Springer, New York (2012) . https://doi.org/10.1007/978-1-4614-3076-6_1
-
[8]
M. W. Melhuish and R. L. Scott, J. Phys. Chem. 68, 2301 (1964) . https://doi.org/10.1021/j10079a046
-
[9]
B. Kuchta, R. D. Etters, J. Chem. Phys. 95, 5399 (1990) . https://doi.org/10.1063/1.461656
-
[10]
W. C. Hamilton, M. Petrie, J. Phys. Chem. 65, 1453 (1961) . https://doi.org/10.1021/j100826a509
-
[11]
S. I. Kovalenkо, E. I. Indan, A. A. Khudoteplaya, I. N. Krupskii, Phys. Stat. Sol. (a) 20, 629 (1973). https://doi.org/10.1002/pssa.2210200225
-
[12]
A. A. Solodovnik, V. V. Danchuk, Low Temp. Phys. 29, 788 (2003) [Fiz. Nizk. Temp. 29, 1041 (2003). https://doi.org/10.1063/1.1614193
-
[13]
A. M. Tolkachev, V. G. Manzhelii, V. P. Azarenkov, A. Jezowski, E. A. Kosobutskaya, Sov. J. Low Temp. Phys. 6, 747 (1980) [Fiz. Nizk. Temp. 6, 1533 (1980)]. https://doi.org/10.1063/10.0030190
-
[14]
A. A. Anderson, Chem. Phys. Lett. 8, 537 (1971). https://doi.org/10.1016/0009- 2614(71)80086-6
-
[15]
V. A. Konstantinov, V . G. Manzhelii, S. A. Smirnov, A. M. Tolkachev, Sov. J. Low Temp. Phys. 14, 104 (1988) [Fiz. Nizk. Temp. 14, 189 (1988) ]. https://doi.org/10.1063/10.0031877
-
[16]
V. V. Sumarokov, P. Stachowiak, J. Mucha, A. Jezowski, Phys. Rev . B74, 224302 (2006). https://doi.org/10.1103/PhysRevB.74.224302
-
[17]
K. R. Nary, R. Kuhus, M. S. Conradi, Phys. Rev. B26, 3370 (1982) . https://doi.org/10.1103/PhysRevB.26.3370
-
[18]
R. Balog, P. Cieman, N. C. Jones, D. Field, Phys.Rev. Lett. 102, 073003 (2009). https://doi.org/10.1103/PhysRevLett.102.073003
-
[19]
D. Field, O. Plecan, A. Cassidy, R. Balog, N. C. Jones, J. Dunger, Int. Rev. Phys. Chem. 32, 345 (2013). https://doi.org/10.1080/0144235X.2013.767109
-
[20]
A. Cassidy, O. Plecan, R. Balog, J. Dunger, D. Field, N. C. Jones, J. Phys. Chem. A 118, 6615 (2014). https://doi.org/10.1021/jp503332x
-
[21]
G. Geballos, H. Wende, K. Baberschke, D. Arvantis, Surf. Sci. 15, 482 (2001). https://doi.org/10.1016/50039-6028(01)00938-4
-
[22]
F. Wang, R. D. Harcourt, J. Phys. Chem. 104, 1304 (2000) . https://doi.org/10.1021/jp9930088
-
[23]
A. Drobyshev, A. Aldijarov, E. Korshikov, V. Kurnosov, D. Sokolov, N. Tokmolin, Low Temp. Phys. 39, 460 (2013) [Fiz. Nizk. Temp. 39, 591 (2013)]. https://doi.org/10.1063/1.4807327
-
[24]
A. Drobyshev, A. Aldijarov, E. Korshikov, Y. M. Strzhemechny, Low Temp. Phys. 41, 547 (2015) [Fiz. Nizk. Temp. 41, 703 (2015)]. http://dx./doi.org/10.1063/1.4927046
-
[25]
A. Drobyshev, Yu. Strzhemechny, A. Aldijarov, E. Korshikov, V. Kurnosov, D. Sokolov, J. Low. Temp. Phys. 187, 71 (2017) . https://doi.org/10.1007/s10909- 016-1693-7
-
[26]
L. Vegard, Z. Physik. 71, 465 (1931). https://doi.org/10.1007/BF01340080
-
[27]
A. A. Solodovnik, V. V. Danchuk, Low Temp. Phys. 35, 339 (2009) [Fiz. Nizk. Temp. 35, 438 (2009)]. https://doi.org/10.1063/1.3117965
-
[28]
A. A. Solodovnik and N. S. Mysko-Krutik, Low Temp. Phys. 45, 545 (2019) [Fiz. Nizk. Temp. 45, 637 (2019)]. https://doi.org/10.1063/1.5097365
-
[29]
Hume-Rothery, R
W. Hume-Rothery, R. E. Smalman, C. W. Howorth, The Structure of Metals and Alloys, The Metals and Metallurgy Trust, London (1969)
1969
-
[30]
Kitaigorodsky, Molecular Crystals and Molecules , Academic Press , New York (2012)
A. Kitaigorodsky, Molecular Crystals and Molecules , Academic Press , New York (2012)
2012
-
[31]
J. H. Hildebrand, R. L. Scott, Regular Solutions, Prentice-Hall, New York (1962)
1962
-
[32]
M. A. Strzhemechny, A. A. Solodovnik, S. I. Kovalenko, Low Temp. Phys. 24, 669 (1998) [Fiz. Nizk. Temp. 24, (1998)]. https://doi.org/10.1063/1.593662
-
[33]
Light-induced gauge fields for ultracold atoms,
K. Binder, Rep. Prog. Phys. 50, 783 (198 7). https://doi.org/10.1088/0034- 4885/50/7/001
-
[34]
M. Hillert, Acta Met. 9, 525 (1961) . https://doi.org/10.1016/0001- 6160(61)90155-9
-
[35]
K. A. Chishko, A. A. Solodovnik, Low. Temp. Phys. 52, 366 (2026) [Fiz. Nizk. Temp. 52, 366 (2026). https://doi.org/10.1063/10.0042903
-
[36]
Okabe, Photochemistry of Small Molecules , John Wiley & Sons, New York (1978)
H. Okabe, Photochemistry of Small Molecules , John Wiley & Sons, New York (1978)
1978
discussion (0)
Sign in with ORCID, Apple, or X to comment. Anyone can read and Pith papers without signing in.