Assessing model calibration with boosting trees
Pith reviewed 2026-06-27 19:18 UTC · model grok-4.3
The pith
Boosting trees can test necessary conditions for calibration and auto-calibration in regression models.
A machine-rendered reading of the paper's core claim, the machinery that carries it, and where it could break.
Core claim
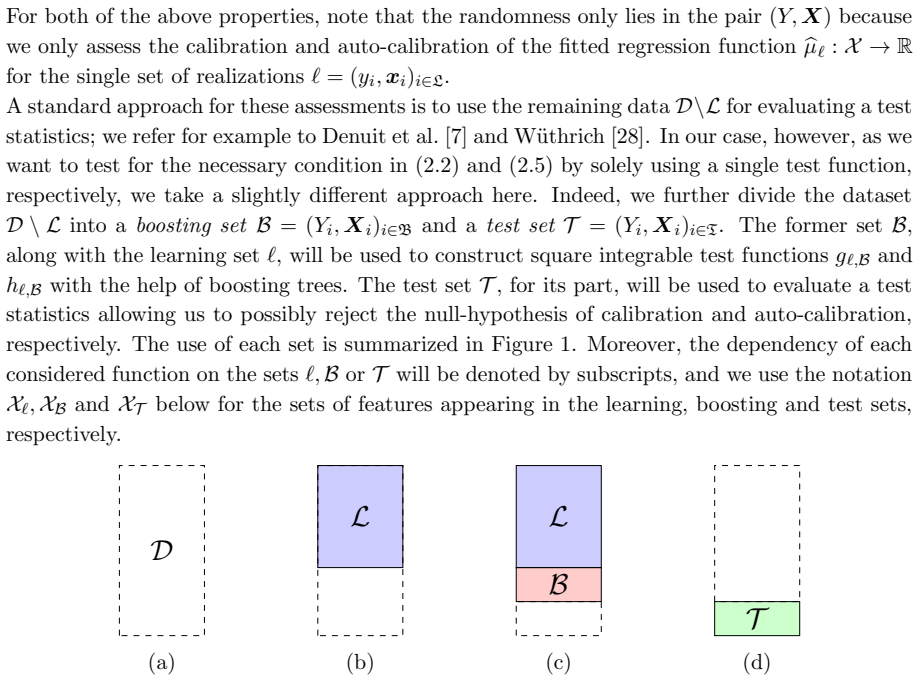
Boosting trees can be used to test necessary conditions for calibration and auto-calibration, respectively. The practical relevance of our approach is supported by a numerical example, in which the proposed tests prove to be very powerful on a large insurance dataset.
What carries the argument
Boosting trees applied to test necessary conditions for calibration and auto-calibration of a regression function.
If this is right
- Passing the tests confirms that the model meets necessary conditions for matching predicted and true conditional means.
- The tests can be used to verify auto-calibration and thereby rule out cross-subsidization between price cohorts in insurance applications.
- The method remains applicable even when perfect calibration cannot be achieved because of finite samples and noise.
Where Pith is reading between the lines
- The same boosting-tree tests could be applied to compare calibration properties across different regression fitting procedures on the same dataset.
- Repeated application of the tests during model development might identify feature transformations that improve satisfaction of the necessary conditions.
- If the tests reject on a given model, retraining with added constraints that enforce the tested identities could be explored as a corrective step.
Load-bearing premise
The boosting-tree procedure itself does not introduce bias or dependence that would invalidate the test when applied to finite noisy samples.
What would settle it
Generate data from a regression model known to violate calibration or auto-calibration, apply the boosting-tree tests, and check whether they fail to reject the null hypothesis of no violation.
Figures
read the original abstract
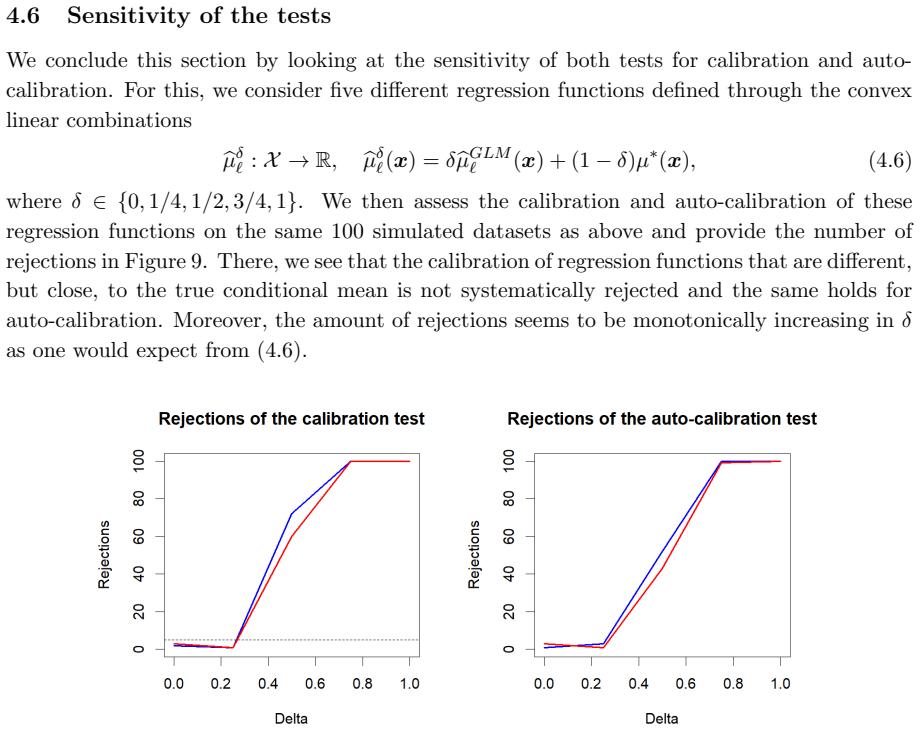
The main goal in regression modelling consists in approximating the conditional mean of a response given a set of features. A regression function is said to be calibrated if the resulting mean estimates match the true conditional means for almost every set of features. Aiming for calibration seems not achievable in practice as one typically deals with finite samples of noisy observations. A weaker notion of calibration is auto-calibration, and it means that the expectation of responses being given the same mean estimate matches this estimate. This notion is important, e.g., in insurance pricing as it ensures no cross-subsidization between different price cohorts. In this paper, we show that boosting trees can be used to test necessary conditions for calibration and auto-calibration, respectively. The practical relevance of our approach is supported by a numerical example, in which the proposed tests prove to be very powerful on a large insurance dataset.
Editorial analysis
A structured set of objections, weighed in public.
Referee Report
Summary. The paper claims that boosting trees can be used to test necessary conditions for calibration (matching true conditional means) and auto-calibration (matching conditional expectations given the predicted mean) in regression models. Auto-calibration is highlighted for its relevance in insurance pricing to avoid cross-subsidization. The approach is supported by a numerical example on a large insurance dataset in which the proposed tests are reported to be very powerful.
Significance. If the boosting-tree tests are shown to be valid without introducing bias or dependence on finite samples, the method would supply a practical, tree-based diagnostic for necessary conditions of calibration that is directly applicable to insurance and similar pricing contexts. The numerical example on real data is a strength if accompanied by proper controls and baselines, but the overall significance hinges on resolving the validity questions for the test construction itself.
major comments (2)
- [Abstract / numerical example] Abstract and numerical-example section: the claim that the tests 'prove to be very powerful' rests on a single insurance dataset example, yet no power calculations, error bars, baseline comparisons, or controls for the boosting procedure are described. This prevents verification that the observed power is not an artifact of the example design.
- [Method description (auto-calibration test)] Method for auto-calibration test: the boosting-tree procedure used to test the necessary condition for auto-calibration must be shown not to introduce bias or dependence on finite noisy samples. The manuscript should supply either a theoretical argument for validity under the null or simulation evidence that the test size is controlled.
Simulated Author's Rebuttal
We thank the referee for the constructive comments on our manuscript. We address each major comment below and indicate the revisions we will make.
read point-by-point responses
-
Referee: [Abstract / numerical example] Abstract and numerical-example section: the claim that the tests 'prove to be very powerful' rests on a single insurance dataset example, yet no power calculations, error bars, baseline comparisons, or controls for the boosting procedure are described. This prevents verification that the observed power is not an artifact of the example design.
Authors: We agree that the numerical example is limited to a single large insurance dataset and does not include power calculations, error bars, baseline comparisons, or explicit controls for the boosting procedure. While the dataset size supports the observed results, this is a valid concern. In the revision we will add a simulation study with known calibrated and miscalibrated models to quantify power, include bootstrap-based error bars on the insurance results, and provide comparisons against binning and isotonic regression baselines. We will also revise the abstract language from 'prove to be very powerful' to 'demonstrate strong performance'. revision: yes
-
Referee: [Method description (auto-calibration test)] Method for auto-calibration test: the boosting-tree procedure used to test the necessary condition for auto-calibration must be shown not to introduce bias or dependence on finite noisy samples. The manuscript should supply either a theoretical argument for validity under the null or simulation evidence that the test size is controlled.
Authors: We acknowledge that the manuscript currently provides neither a theoretical argument nor simulation evidence that the boosting-tree test controls size under the null of auto-calibration. Finite-sample bias in tree construction is a legitimate issue. We will add a simulation study in the revised version that generates data under the null for a range of sample sizes and noise levels, applies the test, and reports empirical rejection rates to confirm size control at the nominal level. revision: yes
Circularity Check
No significant circularity detected
full rationale
The paper proposes a method using boosting trees to test necessary conditions for calibration and auto-calibration, supported by a numerical example on insurance data. The abstract and available description present this as an independent diagnostic approach without any equations, derivations, or claims that reduce by construction to fitted parameters, self-definitions, or self-citation chains. No load-bearing steps matching the enumerated circularity patterns are identifiable from the provided content, and the central claim does not rely on renaming known results or importing uniqueness via prior author work. The derivation chain is self-contained as a proposed testing procedure.
Axiom & Free-Parameter Ledger
Reference graph
Works this paper leans on
-
[1]
Bierens, H. (1990). A consistent conditional moment test of functional form.Econometrica58, 1443–1458
1990
-
[2]
Bross, I. D. J. (1953).Design for decision. New York: Macmillan
1953
-
[3]
Delong, L., Gatti, S., W¨ uthrich, M. V. (2026). Calibration bands for mean estimates within the exponential dispersion family.Statistical Theory and Related Fields, 1-43
2026
-
[4]
Delong, L., W¨ uthrich, M. V. (2025). Isotonic regression for variance estimation and its role in mean estimation and model validation.North American Actuarial Journal29/3, 563-591
2025
-
[5]
Delong, L., W¨ uthrich, M. V. (2025). Universal inference for testing calibration of mean estimates within the exponential dispersion family.arXiv: 2510.23821
arXiv 2025
-
[6]
Denuit, M., Charpentier, A., Trufin, J. (2021). Autocalibration and Tweedie-dominance for insur- ance pricing with machine learning.Insurance: Mathematics and Economics101/B, 485-497
2021
-
[7]
Denuit, M., Huyghe, J., Trufin, J., Verdebout, T. (2024). Testing for auto-calibration with Lorenz and concentration curves.Insurance: Mathematics and Economics117, 130-139
2024
-
[8]
(2018).CASdatasetsRpackage vignette.Reference manual
Dutang, C., Charpentier, A. (2018).CASdatasetsRpackage vignette.Reference manual. Version 1.0-8, packaged 2018-05-20. 31
2018
-
[9]
Fissler, T., Lorentzen, C., Mayer, M. (2022). Model comparison and calibration assessment: User guide for consistent scoring functions in machine learning and actuarial practice.arXiv: 2202.12780
arXiv 2022
-
[10]
Freund, Y., Schapire, R. E. (1997). A decision-theoretic generalization of online learning and an application to boosting.Journal of Computer and System Sciences55/1, 119-139
1997
-
[11]
Friedman, J. H. (2001). Greedy function approximation: a gradient boosting machine.Annals of Statistics29/5, 1189-1232
2001
-
[12]
Gneiting, T. (2011). Making and evaluating point forecasts.Journal of the American Statistical Association106, 746-762
2011
-
[13]
Gneiting, T., Raftery, A. E. (2007). Strictly proper scoring rules, prediction, and estimation.Journal of the American Statistical Association102/477, 359-378
2007
-
[14]
Gneiting, T., Resin, J. (2023). Regression diagnostics meets forecast evaluation: Conditional cali- bration, reliability diagrams, and coefficient of determination.Electronic Journal of Statistics17/2, 3226-3286
2023
-
[15]
H¨ ardle, W., Mammen, E. (1993). Comparing nonparametric versus parametric regression fits.The Annals of Statistics21, 1926-1947
1993
-
[16]
Hastie, T., Tibshirani, R., Friedman, J. (2009).The elements of statistical learning. Data min- ing, inference, and prediction.2nd ed. New York: Springer Series in Statistics.https://link. springer.com/book/10.1007/978-0-387-84858-7
-
[17]
Henzi, A., Puke, M., Dimitriadis, T., Ziegel, J. (2022). A safe Hosmer–Lemeshow test.Journal of Statistics in Data Science2/2, 175-189
2022
-
[18]
W., Lemeshow, S
Hosmer, D. W., Lemeshow, S. (1980). Goodness of fit tests for the multiple logistic regression model.Communications in Statistics - Theory and Methods9, 1043-1069
1980
-
[19]
(2004).Probability essentials.2nd ed
Jacod, J., Protter, P. (2004).Probability essentials.2nd ed. Berlin: Springer.https://link. springer.com/book/10.1007/978-3-642-55682-1
-
[20]
Kearns, M., Valiant, L.G. (1988). Learning boolean formulae or finite automata is hard as factoring. Technical Report TR-14-88. Harvard University Aiken Computation Laboratory
1988
-
[21]
Klenke, A. (2020).Probability Theory. A comprehensive course.3rd ed. Cham: Springer.https: //link.springer.com/book/10.1007/978-3-030-56402-5
-
[22]
Kr¨ uger, F., Ziegel, J. F. (2021). Generic conditions for forecast dominance.Journal of Business & Economic Statistics39/4, 972-983
2021
-
[23]
H., Winkler, R
Murphy, A. H., Winkler, R. L. (1977). Reliability of subjective probability forecasts of precipitation and temperature.Applied Statistics26, 41-47
1977
-
[24]
Pohle, M. O. (2020). The Murphy decomposition and the calibration-resolution principle: A new perspective on forecast evaluation.arXiv: 2005.01835
arXiv 2020
-
[25]
R Core Team (2021).R: A language and environment for statistical computing.RFoundation for Statistical Computing, Vienna, Austria.https://www.R-project.org/
2021
-
[26]
Sanders, F. (1963). On subjective probability forecasting.Journal of Applied Meteorology and Cli- matology2, 191-201
1963
-
[27]
Valiant, L.G. (1984). A theory of learnable.Communications of the Association for Computing Machinery ACM27/11, 1134-1142
1984
-
[28]
W¨ uthrich, M.V. (2025). Auto-calibration tests for discrete finite regression functions.European Actuarial Journal15, 335-341. 32
2025
-
[29]
W¨ uthrich, M.V., Buser, C. (2016). Data analytics for non-life insurance pricing.Swiss Finance Institute Research Paper16/68, Available at SSRN:https://ssrn.com/abstract=2870308
2016
-
[30]
W¨ uthrich, M.V., Merz, M. (2023).Statistical foundations of actuarial learning and its applications. Cham: Springer.https://link.springer.com/book/10.1007/978-3-031-12409-9
-
[31]
W¨ uthrich, M.V., Richman, R., Avanzi, B., Lindholm, M., Maggi, M., Mayer, M., Schelldorfer, J, Scognamiglio, S. (2026). AI tools for actuaries. Available at SSRN:https://ssrn.com/abstract= 5162304
2026
-
[32]
W¨ uthrich, M.V., Ziegel, J. (2024). Isotonic recalibration under a low signal-to-noise ratio.Scandi- navian Actuarial Journal2024/3, 279-299. 33 A Proof of Proposition 3.1 The proof of Proposition 3.1 is given in this appendix. As the proof of Proposition 3.4 is perfectly similar, it is omitted. Proof of Proposition 3.1. The random variables (Zi)n i=1 in...
2024
-
[33]
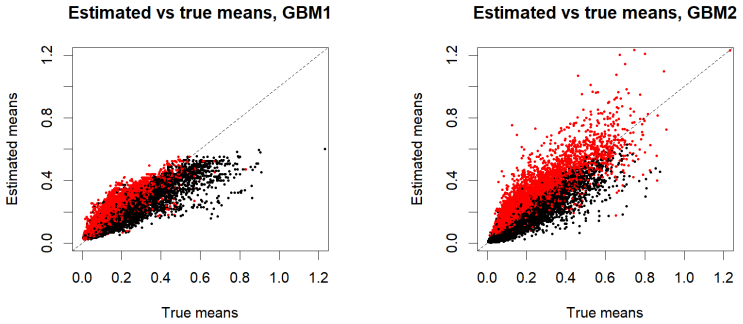
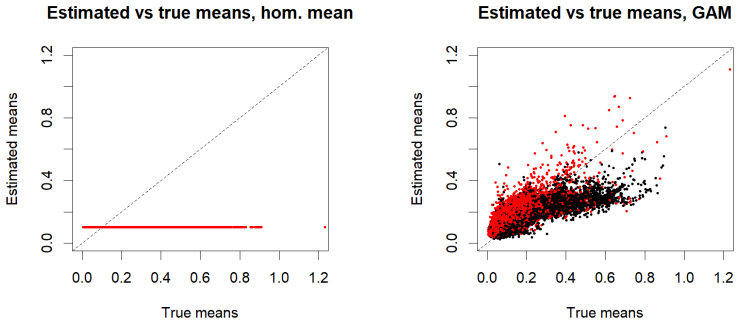
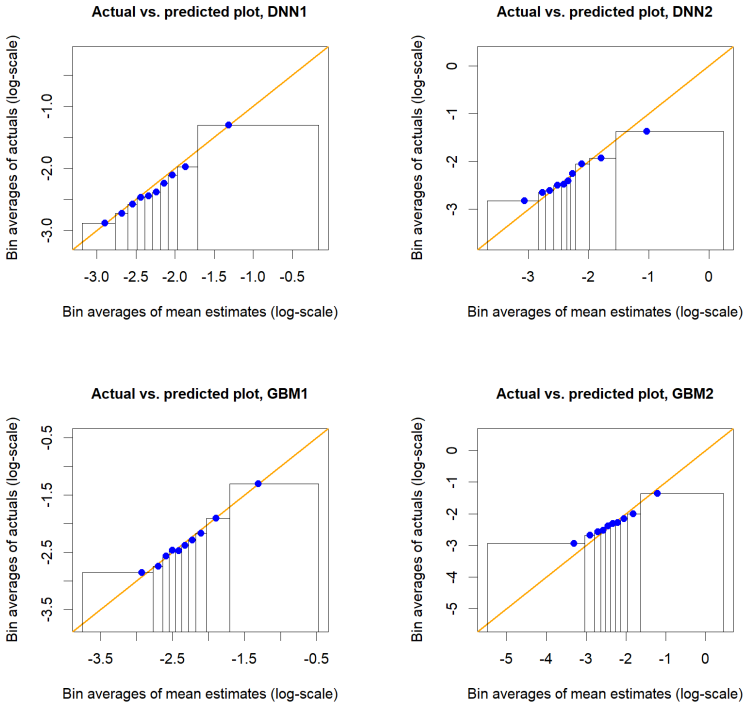
This can be explained by two different factors
There, we observe that the constructed calibration bands are only able to detect violations of calibration for the overfitting models DNN2 and GBM2 in the case where the learning set corresponds to 60% of the datasetD. This can be explained by two different factors. On the one hand, calibration bands become narrower as more data is used to construct them,...
discussion (0)
Sign in with ORCID, Apple, or X to comment. Anyone can read and Pith papers without signing in.