sketch-plot: Progressive Editing for Text-to-Image Academic Figures
Pith reviewed 2026-06-27 15:27 UTC · model grok-4.3
The pith
Sketch-plot gives users a three-layer pipeline to edit specific elements in AI-generated academic figures without regenerating the whole image.
A machine-rendered reading of the paper's core claim, the machinery that carries it, and where it could break.
Core claim
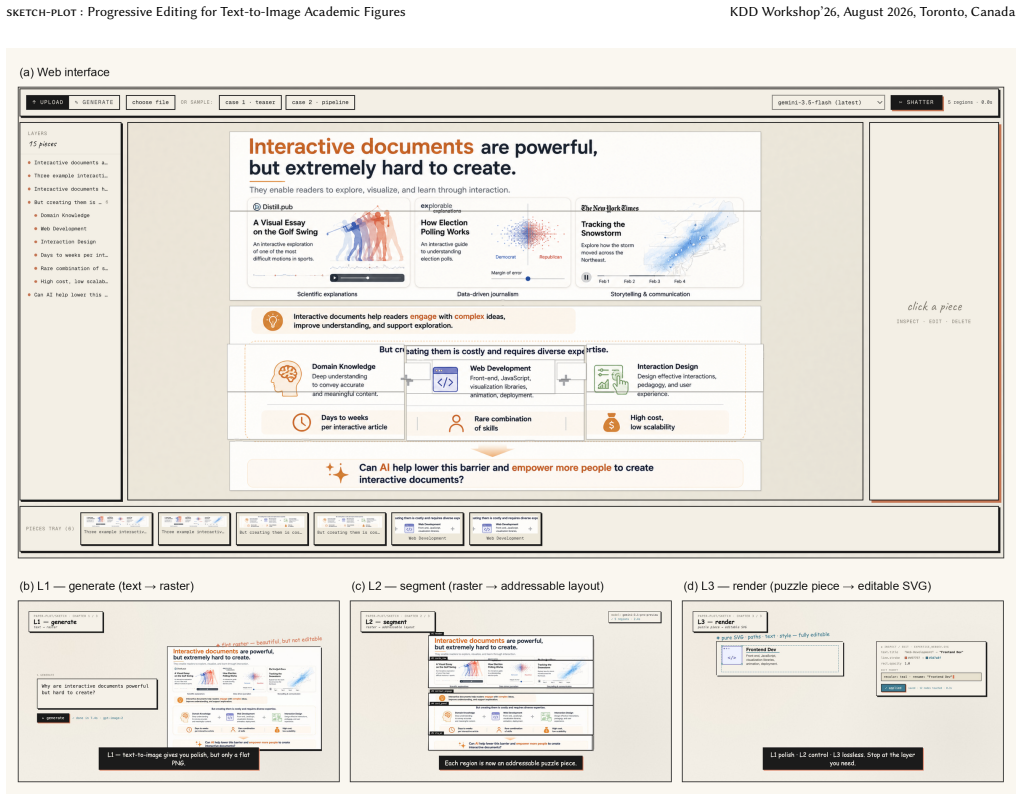
The paper presents sketch-plot, an interactive system that closes the controllability gap in text-to-image academic figures with a three-layer progressive editing pipeline consisting of a generated PNG, an addressable puzzle of editable pieces, and a per-piece SVG; both segmentation and vectorisation stages are routed through a human-in-the-loop interface that lets the user accept, refine or reject decisions on a piece-by-piece basis, so the cost of decomposition and vectorisation is incurred only where needed.
What carries the argument
Three-layer progressive editing pipeline with human-in-the-loop piece-by-piece acceptance, refinement or rejection of decomposition and vectorisation decisions.
If this is right
- Users incur the cost of decomposition and vectorisation only on the pieces they actually edit.
- Targeted changes to individual arrows, labels or icons become possible while leaving the rest of the figure undisturbed.
- Semantic discriminability is maintained by letting users correct or reject machine decisions at each stage.
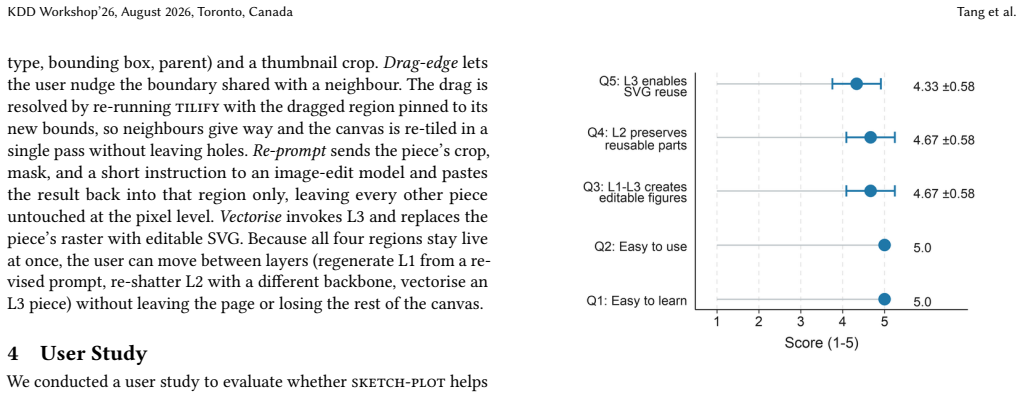
- Expert users report preferring the system to full-image regeneration for making small, precise modifications.
Where Pith is reading between the lines
- The same progressive human-in-loop pattern could apply to editing other classes of generated scientific visuals such as diagrams in engineering or medical papers.
- Over time, improvements in base segmentation models might reduce the frequency of human corrections while retaining the same layered interface.
- The design suggests a general template for hybrid editing tools where full automation is traded for controllability on a per-object basis.
Load-bearing premise
Automated segmentation and end-to-end vectorisation cannot reliably preserve semantic structure in research figures, so human guidance per piece is required.
What would settle it
An automated system that decomposes and vectorises research figures at the same quality level with no human refinement steps and yields equivalent user satisfaction in targeted edits.
Figures
read the original abstract
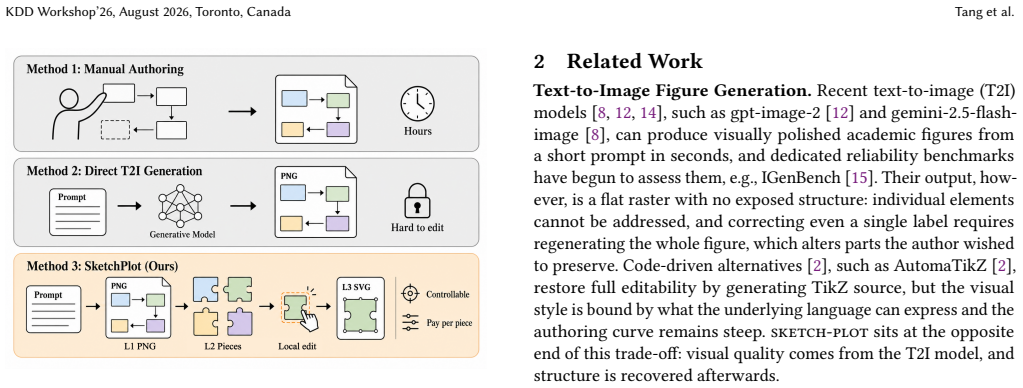
Text to image (T2I) models such as gpt-image-2 can now generate publication grade academic figures from a short prompt, but the output is a flat raster: a user who wants to change one arrow, one label, or one icon has to regenerate the whole image, which also disturbs the parts they wanted to keep. We present sketch-plot, an interactive system that closes this controllability gap with a three layer progressive editing pipeline: a generated PNG, an addressable puzzle of editable pieces, and a per piece SVG. The user stops at the layer that gives them enough control for the change at hand, so the cost of decomposition and vectorisation is paid only on the pieces that need it. Realising this pipeline is not trivial. General segmentation models lack the semantic discriminability to decompose a research figure cleanly, and end to end image vectorisation produces incomplete shapes and loses semantic structure. We therefore route both stages through a human in the loop interface that lets the user accept, refine, or reject decomposition and vectorisation decisions on a piece by piece basis. We validate the design with an expert user study, in which participants found sketch-plot effective for making targeted edits to AI generated academic figures and preferred it over regenerating the whole image. A demonstration video is available at https://paper-plot.dev/sketch.
Editorial analysis
A structured set of objections, weighed in public.
Referee Report
Summary. The paper presents sketch-plot, an interactive system for editing text-to-image generated academic figures via a three-layer progressive pipeline: a generated PNG raster, an addressable puzzle of segmented editable pieces, and per-piece SVGs. It argues that general segmentation and end-to-end vectorization are insufficient for clean decomposition of research figures, so a human-in-the-loop interface routes both stages to allow users to accept, refine, or reject decisions piece-by-piece. The central claim is that this design closes the controllability gap because decomposition and vectorization costs are incurred only for pieces that require editing. Validation is provided by an expert user study in which participants found the system effective for targeted edits and preferred it over full regeneration.
Significance. If the progressive pipeline and human-in-the-loop mitigation perform as described, the work would offer a practical HCI contribution to improving controllability in generative AI for academic visualization, a common pain point when T2I outputs require precise changes to individual elements like arrows or labels. The explicit acknowledgment of segmentation and vectorization limitations, combined with the demonstration video, suggests a deployable prototype that could influence tools for research figure creation.
major comments (1)
- [Abstract] Abstract: the validation states only that 'participants found sketch-plot effective for making targeted edits... and preferred it over regenerating the whole image' with no quantitative metrics (e.g., average pieces edited per figure, frequency of auto-decomposition corrections, time-to-edit deltas versus full regeneration, or success rates). This evidence gap is load-bearing for the central claim that 'the cost of decomposition and vectorisation is paid only on the pieces that need it,' as the progressive cost-saving property cannot be verified without these measurements.
minor comments (1)
- [Abstract] The abstract would be strengthened by including even high-level study parameters (participant count, figure types tested) to allow readers to assess the scope of the preference result.
Simulated Author's Rebuttal
We thank the referee for the constructive feedback. We address the single major comment below and agree that the abstract requires revision to better support the central claim.
read point-by-point responses
-
Referee: [Abstract] Abstract: the validation states only that 'participants found sketch-plot effective for making targeted edits... and preferred it over regenerating the whole image' with no quantitative metrics (e.g., average pieces edited per figure, frequency of auto-decomposition corrections, time-to-edit deltas versus full regeneration, or success rates). This evidence gap is load-bearing for the central claim that 'the cost of decomposition and vectorisation is paid only on the pieces that need it,' as the progressive cost-saving property cannot be verified without these measurements.
Authors: We agree that the abstract's validation summary is too high-level and does not provide quantitative support for the progressive cost-saving claim. The full manuscript describes the expert user study in Section 5 with participant feedback, but the abstract does not extract the relevant metrics. We will revise the abstract to incorporate key quantitative results from the study (e.g., average pieces edited per figure and time-to-edit comparisons) to make the evidence for the central claim explicit and verifiable. revision: yes
Circularity Check
No derivation chain present; system description only
full rationale
The paper presents an interactive software pipeline for editing AI-generated figures. It contains no equations, fitted parameters, predictions, or first-principles derivations that could reduce to their inputs by construction. The central claim is implemented via a human-in-the-loop interface whose effectiveness is asserted through qualitative user feedback rather than any self-referential mathematical reduction. No self-citation load-bearing steps, ansatzes, or renamings of known results appear in the derivation sense. This is the expected outcome for a systems/HCI paper without quantitative modeling.
Axiom & Free-Parameter Ledger
Forward citations
Cited by 1 Pith paper
-
DataMagic: Transforming Tabular Data into Data Insight Video
DataMagic generates narrative data videos from tabular data and queries via DVSpec declarative bindings and a Generate-then-Orchestrate multi-agent pipeline.
Reference graph
Works this paper leans on
-
[1]
Alibaba DAMO. 2025. Qwen-Image and Qwen-Image-Edit. https://qwenlm. github.io/
2025
-
[2]
Jonas Belouadi, Anne Lauscher, and Steffen Eger. 2024. AutomaTikZ: Text- Guided Synthesis of Scientific Vector Graphics with TikZ. InProceedings of the International Conference on Learning Representations (ICLR)
2024
-
[3]
Qi Bing, Chaoyi Zhang, and Weidong Cai. 2024. DeepIcon: A Hierarchical Network for Layer-wise Icon Vectorization. InInternational Conference on Digital Image Computing: Techniques and Applications (DICTA)
2024
-
[4]
Tim Brooks, Aleksander Holynski, and Alexei A. Efros. 2023. InstructPix2Pix: Learning to Follow Image Editing Instructions. InProceedings of the IEEE/CVF Conference on Computer Vision and Pattern Recognition (CVPR)
2023
-
[5]
Yiyu Chen, Yifan Wu, Shuyu Shen, Yupeng Xie, Leixian Shen, Hui Xiong, and Yuyu Luo. 2025. ChartMark: A Structured Grammar for Chart Annotation. In 2025 IEEE Visualization and Visual Analytics (VIS). IEEE, 311–315
2025
-
[6]
Miguel Espinosa, Chenhongyi Yang, Linus Ericsson, Steven McDonagh, and Elliot J. Crowley. 2024. There is no SAMantics! Exploring SAM as a Backbone for Visual Understanding Tasks.arXiv preprint arXiv:2411.15288(2024)
arXiv 2024
-
[7]
Franconeri, Lace M
Steven L. Franconeri, Lace M. Padilla, Priti Shah, Jeffrey M. Zacks, and Jessica Hullman. 2021. The Science of Visual Data Communication: What Works.Psy- chological Science in the Public Interest22, 3 (2021), 110–161
2021
-
[8]
Google DeepMind. 2026. Gemini image generation: gemini-2.5-flash-image andgemini-3.1-flash-image-preview. https://ai.google.dev/
2026
-
[9]
Berg, Wan-Yen Lo, Piotr Dollár, and Ross Girshick
Alexander Kirillov, Eric Mintun, Nikhila Ravi, Hanzi Mao, Chloe Rolland, Laura Gustafson, Tete Xiao, Spencer Whitehead, Alexander C. Berg, Wan-Yen Lo, Piotr Dollár, and Ross Girshick. 2023. Segment Anything. InProceedings of the IEEE/CVF International Conference on Computer Vision (ICCV)
2023
-
[10]
Bongshin Lee, Nathalie Henry Riche, Petra Isenberg, and Sheelagh Carpendale
-
[11]
IEEE Computer Graphics and Applications35, 5 (2015), 84–90
More Than Telling a Story: Transforming Data into Visually Shared Stories. IEEE Computer Graphics and Applications35, 5 (2015), 84–90
2015
-
[12]
Boyan Li, Yiran Peng, Yupeng Xie, Sirong Lu, Yizhang Zhu, Xing Mu, Xinyu Liu, and Yuyu Luo. 2026. Deepeye: A steerable self-driving data agent system.arXiv preprint arXiv:2603.28889(2026)
arXiv 2026
-
[13]
OpenAI. 2026. GPT Image 2: Image generation and editing API. https://platform. openai.com/docs/models/gpt-image-2
2026
-
[14]
Nikhila Ravi, Valentin Gabeur, Yuan-Ting Hu, Ronghang Hu, Chaitanya Ryali, Tengyu Ma, Haitham Khedr, Roman Rädle, Chloe Rolland, Laura Gustafson, Eric Mintun, Junting Pan, Kalyan Vasudev Alwala, Nicolas Carion, Chao-Yuan Wu, Ross Girshick, Piotr Dollár, and Christoph Feichtenhofer. 2024. SAM 2: Segment Anything in Images and Videos. https://arxiv.org/abs/...
Pith/arXiv arXiv 2024
-
[15]
Robin Rombach, Andreas Blattmann, Dominik Lorenz, Patrick Esser, and Björn Ommer. 2022. High-Resolution Image Synthesis with Latent Diffusion Models. In Proceedings of the IEEE/CVF Conference on Computer Vision and Pattern Recognition (CVPR). 10684–10695
2022
-
[16]
Yinghao Tang, Xueding Liu, Boyuan Zhang, Tingfeng Lan, Yupeng Xie, Jiale Lao, Yiyao Wang, Haoxuan Li, Tingting Gao, Bo Pan, Luoxuan Weng, Xiuqi Huang, Minfeng Zhu, Yingchaojie Feng, Yuyu Luo, and Wei Chen. 2026. IGenBench: Benchmarking the Reliability of Text-to-Infographic Generation.arXiv preprint arXiv:2601.04498(2026)
Pith/arXiv arXiv 2026
-
[17]
Yinghao Tang, Yupeng Xie, Yingchaojie Feng, Tingfeng Lan, Jiale Lao, Yue Cheng, and Wei Chen. 2026. ViviDoc: Generating Interactive Documents through Human- Agent Collaboration.arXiv preprint arXiv:2603.27991(2026)
arXiv 2026
discussion (0)
Sign in with ORCID, Apple, or X to comment. Anyone can read and Pith papers without signing in.