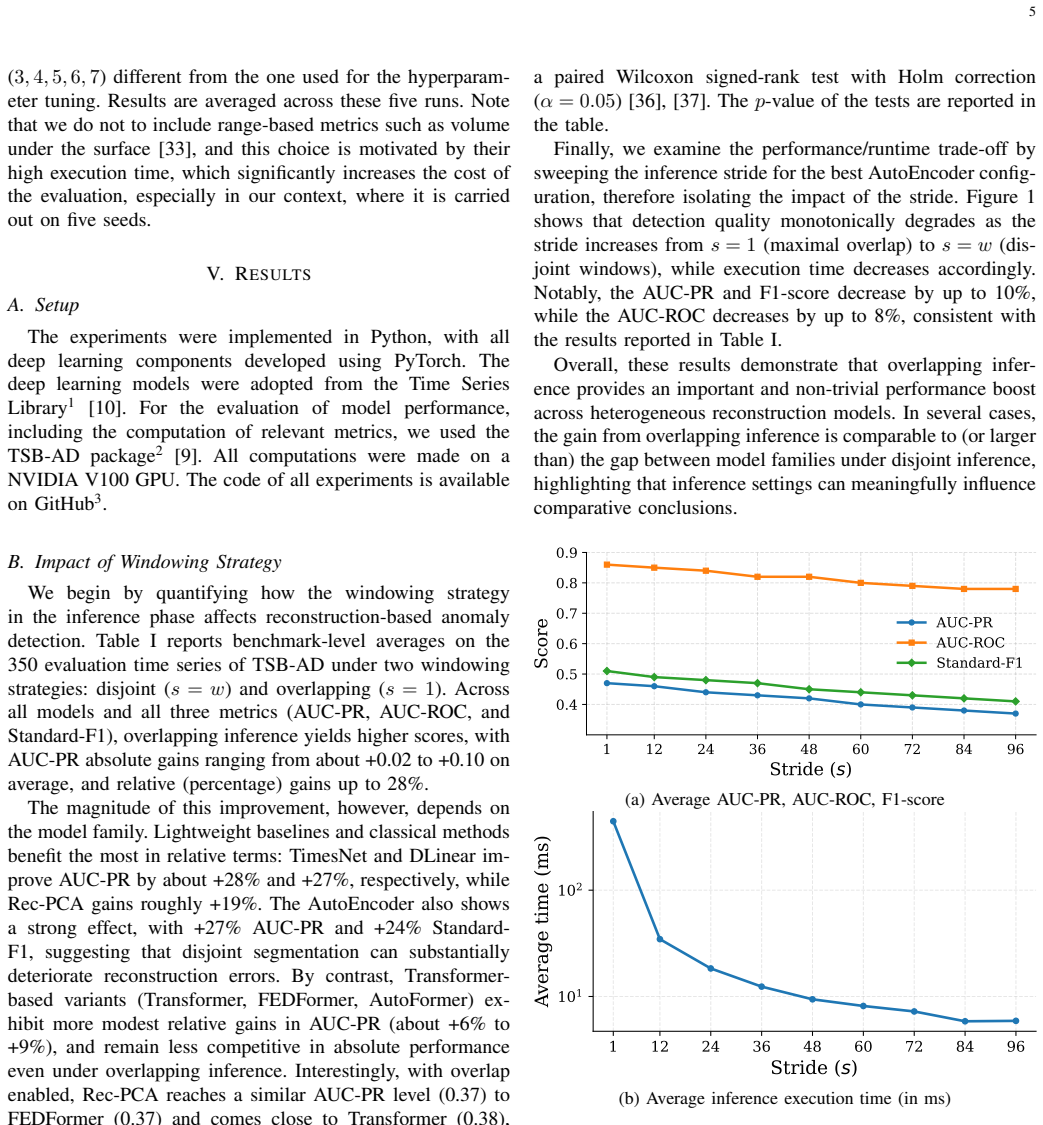
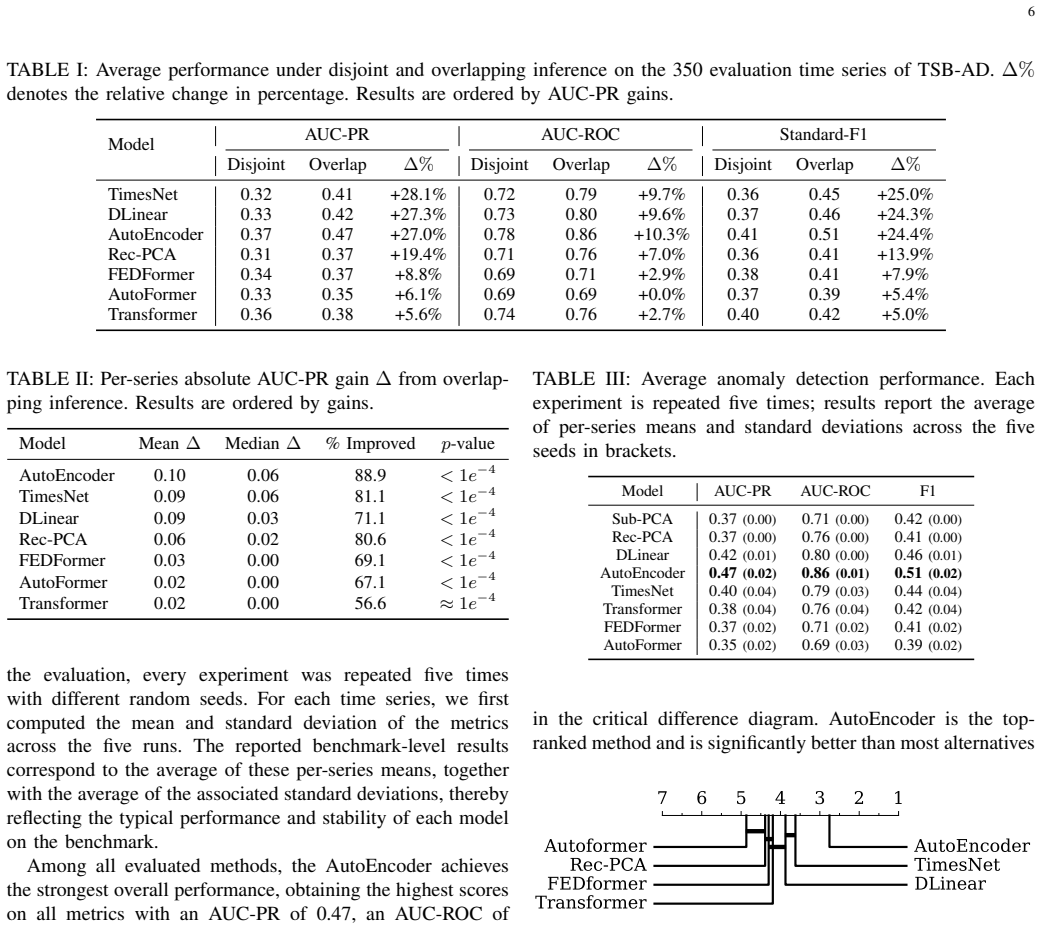
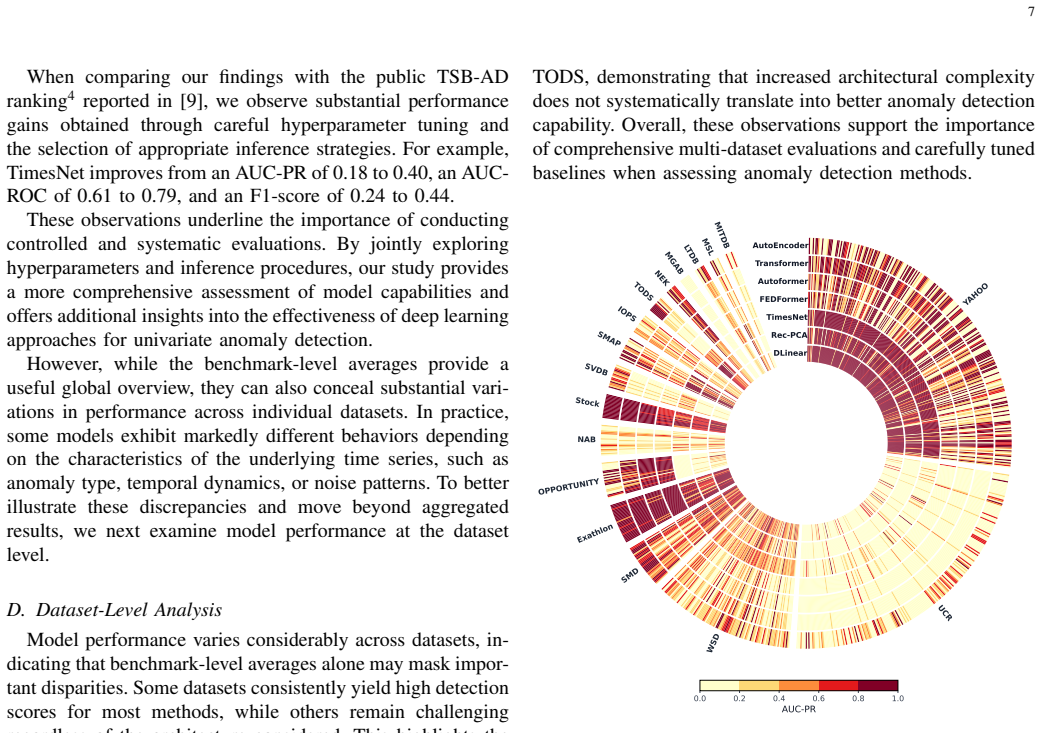
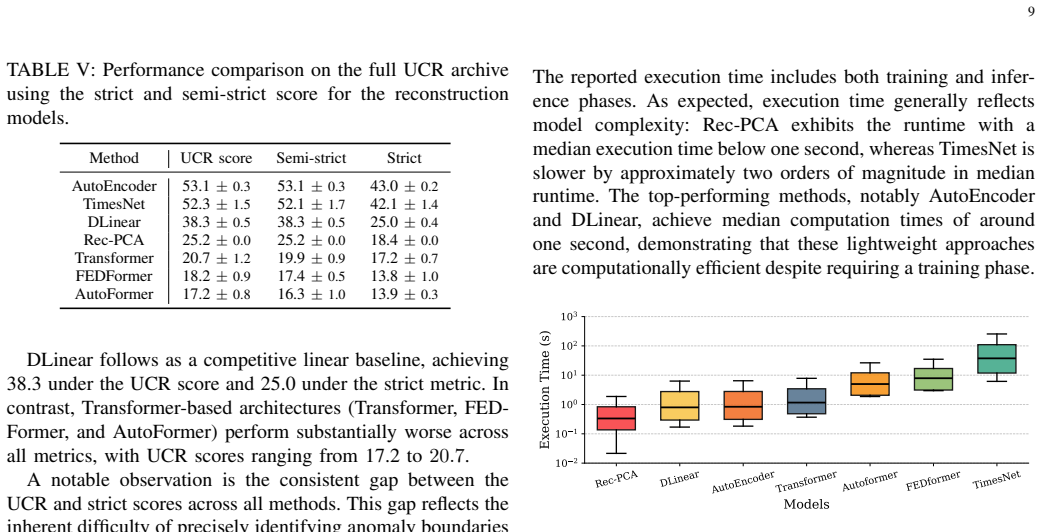
Disjoint or Overlapping? Inference Windowing for Reconstruction-Based Time Series Anomaly Detection
Pith reviewed 2026-06-28 10:50 UTC · model grok-4.3
The pith
Overlapping inference windows improve reconstruction-based time series anomaly detection by up to 28 percent across models.
A machine-rendered reading of the paper's core claim, the machinery that carries it, and where it could break.
Core claim
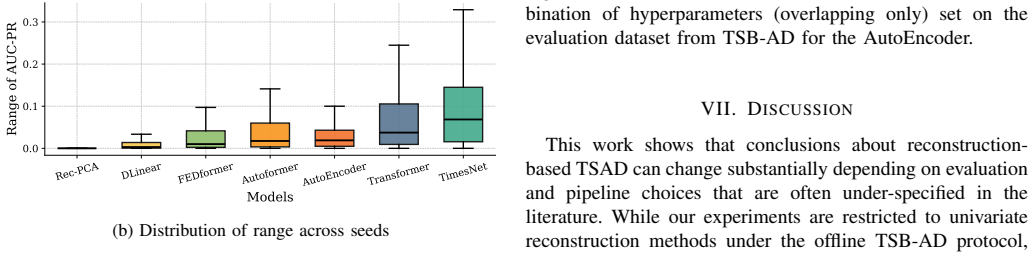
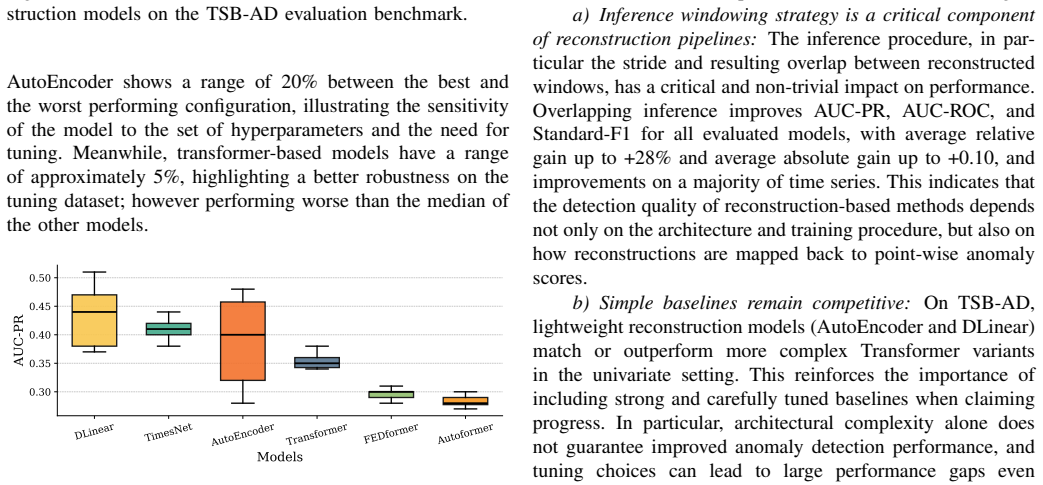
Reconstruction-based anomaly detection performance depends on inference choices in addition to model architecture and training; specifically, processing subsequences with overlap (stride smaller than window length) yields consistent improvements across PCA, DLinear, AutoEncoder, TimesNet, and Transformer variants, with average relative gains up to 28 percent on the TSB-AD benchmark, can reorder method rankings, and produces strong baseline results when the same protocol is applied to the full UCR archive under aligned localization criteria.
What carries the argument
The inference stride, which sets the step size between consecutive reconstruction windows and thereby controls the degree of overlap used when computing anomaly scores from reconstruction errors.
If this is right
- Reconstruction-based baselines become competitive with more complex methods once overlapping inference is applied.
- Method rankings reported in earlier work may shift when the same models are re-evaluated with overlapping windows.
- Performance differences previously attributed only to architecture or training can partly arise from the choice of inference stride.
- A unified training, tuning, and multi-seed protocol is required for reproducible comparisons in this task.
Where Pith is reading between the lines
- Many previously published numbers for reconstruction methods may be lower bounds if they relied on disjoint windows.
- The observed gains could motivate systematic search for an optimal stride per dataset rather than a fixed choice.
- Similar stride effects might appear in reconstruction tasks outside anomaly detection, such as imputation or forecasting.
- The result suggests that inference configuration deserves the same level of reporting as model hyperparameters.
Load-bearing premise
The curated TSB-AD benchmark together with the chosen localization criteria on the UCR archive provide an unbiased and representative testbed for isolating the effect of inference stride.
What would settle it
Re-running the exact protocol on a fresh collection of univariate time series where overlapping windows produce no gain or reduce detection scores would falsify the central claim.
Figures
read the original abstract
Reconstruction-based methods are widely used for time series anomaly detection, where models are trained to reconstruct subsequences, and anomalies are identified through reconstruction errors. However, reported results are often hard to compare due to heterogeneous evaluation practices and underspecified inference procedures. In this paper, we revisit reconstruction-based anomaly detection in the univariate offline setting and study the role of the inference stride, which controls whether subsequences are processed as disjoint windows or with overlap. We propose a unified training, tuning, and multi-seed evaluation protocol on the curated TSB-AD benchmark, and study how overlapping inference affects anomaly detection performance for a range of reconstruction models, including PCA-based baselines, DLinear, an AutoEncoder, TimesNet, and Transformer variants. The results show that across all models, overlapping windows yield consistent improvements, with average relative gain up to +28%, and can alter method rankings. We further analyze variability across datasets, random seeds, and hyperparameter configurations. Finally, we complement the benchmark study with an evaluation on the full UCR archive using localization criteria aligned with sliding-window reconstruction. Overall, our results highlight that reconstruction-based anomaly detection performance depends not only on model architecture and training, but also on inference choices, motivating a clear and reproducible protocol. Our results show that reconstructionbased baselines achieve strong performance on both TSB-AD and UCR benchmarks, supporting them as competitive and practical approaches for univariate time series anomaly detection.
Editorial analysis
A structured set of objections, weighed in public.
Referee Report
Summary. The paper claims that reconstruction-based univariate time series anomaly detection performance depends critically on inference stride: overlapping windows (stride=1) yield consistent gains over disjoint windows (stride=w) across models including PCA baselines, DLinear, AutoEncoder, TimesNet and Transformer variants, with average relative improvements up to +28% on the TSB-AD benchmark under a unified training/tuning/multi-seed protocol; these gains can also alter method rankings. Complementary results on the full UCR archive using localization criteria aligned with sliding-window reconstruction are presented to support the same conclusion.
Significance. If the central empirical claim holds after controls for confounding, the work is significant because it demonstrates that an often-underspecified inference hyperparameter can dominate reported performance differences and rankings in a widely used class of anomaly detectors. The provision of a unified, multi-seed protocol on a curated benchmark and the explicit comparison of reconstruction baselines against more complex architectures are concrete strengths that could improve reproducibility in the field.
major comments (2)
- [UCR evaluation] UCR evaluation paragraph: the localization criteria are explicitly 'aligned with sliding-window reconstruction.' Because the scoring rules were chosen with sliding windows in mind, any measured advantage of stride=1 over stride=w may be partly or wholly an artifact of the evaluation protocol rather than an intrinsic effect of overlap; this directly undermines the claim that the +28% gain isolates the inference choice.
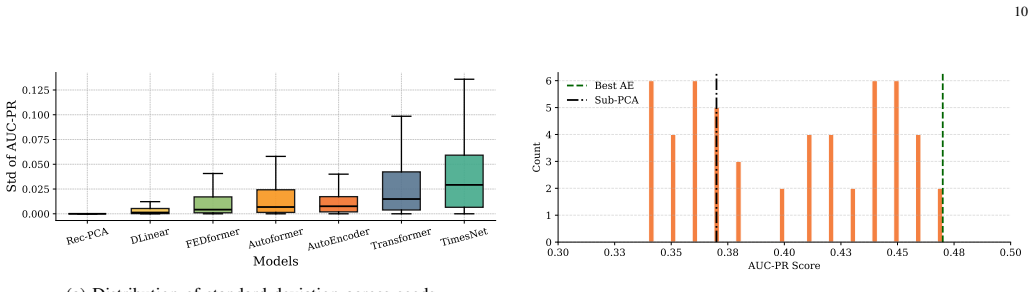
- [TSB-AD results] TSB-AD results section (and associated tables/figures): while multi-seed averages are reported, no statistical significance tests (paired t-test, Wilcoxon signed-rank, or bootstrap confidence intervals) are described for the per-model or aggregate gains; without them the ranking changes and the 'consistent improvements' claim rest on point estimates whose variability is unknown.
minor comments (2)
- [Abstract] Abstract and introduction: the phrase 'average relative gain up to +28%' is ambiguous; the main text should state whether this is the maximum across models, the mean across all models, or a different aggregation.
- [Methods] Notation: the paper should define the exact reconstruction-error aggregation (point-wise vs. window-wise) and the anomaly localization rule used on both benchmarks in a single, early subsection so that readers can immediately see how stride interacts with scoring.
Simulated Author's Rebuttal
We thank the referee for the constructive feedback. The primary results and +28% gains are reported on TSB-AD under its standard evaluation protocol; UCR serves only as a complementary study. We address each major comment below.
read point-by-point responses
-
Referee: [UCR evaluation] UCR evaluation paragraph: the localization criteria are explicitly 'aligned with sliding-window reconstruction.' Because the scoring rules were chosen with sliding windows in mind, any measured advantage of stride=1 over stride=w may be partly or wholly an artifact of the evaluation protocol rather than an intrinsic effect of overlap; this directly undermines the claim that the +28% gain isolates the inference choice.
Authors: We agree that alignment in the UCR study could introduce a bias favoring stride=1 when localization matches the reconstruction process. However, the reported +28% relative gain and ranking changes are based exclusively on the TSB-AD benchmark, which uses its standard point-wise scoring and evaluation protocol that does not depend on inference stride. The UCR results are presented only as a complementary analysis to illustrate behavior under criteria consistent with sliding-window reconstruction. In revision we will (i) explicitly state that all quantitative claims rest on TSB-AD, (ii) move the UCR section to an appendix, and (iii) add a short discussion of the alignment rationale and its limitations. This should prevent any misinterpretation that UCR supports the main numerical claims. revision: partial
-
Referee: [TSB-AD results] TSB-AD results section (and associated tables/figures): while multi-seed averages are reported, no statistical significance tests (paired t-test, Wilcoxon signed-rank, or bootstrap confidence intervals) are described for the per-model or aggregate gains; without them the ranking changes and the 'consistent improvements' claim rest on point estimates whose variability is unknown.
Authors: We acknowledge the absence of formal significance testing. In the revised manuscript we will add (a) Wilcoxon signed-rank tests across the 16 TSB-AD datasets for each model comparing stride=1 vs. stride=w, (b) bootstrap confidence intervals on the relative gains, and (c) a note on variability across the three random seeds. These will be reported both per-model and in aggregate, directly supporting the consistency and ranking claims. revision: yes
Circularity Check
No circularity: empirical benchmark study with independent measurements
full rationale
This is a purely empirical paper reporting measured performance differences between disjoint and overlapping inference windows on fixed benchmarks (TSB-AD and UCR). No equations, derivations, or predictions are present that could reduce to fitted inputs or self-citations by construction. All claims rest on direct experimental results under a unified protocol; the evaluation rules and benchmarks are external to the stride ablation itself. No load-bearing step matches any of the enumerated circularity patterns.
Axiom & Free-Parameter Ledger
Reference graph
Works this paper leans on
-
[1]
A Comprehensive Survey of Deep Transfer Learning for Anomaly Detection in Industrial Time Series: Methods, Applications, and Directions,
P. Yan, A. Abdulkadir, P.-P. Luley, M. Rosenthal, G. A. Schatte, B. F. Grewe, and T. Stadelmann, “A Comprehensive Survey of Deep Transfer Learning for Anomaly Detection in Industrial Time Series: Methods, Applications, and Directions,”IEEE Access, vol. 12, pp. 3768–3789, 2024
2024
-
[2]
Detection of Anomaly Stock Price Based on Time Series Deep Learning Models,
W. Yang, R. Wang, and B. Wang, “Detection of Anomaly Stock Price Based on Time Series Deep Learning Models,” in2020 Management Science Informatization and Economic Innovation Development Confer- ence (MSIEID), 2020, pp. 110–114
2020
-
[3]
Deep Learning Technologies for Time Series Anomaly Detection in Healthcare: A Review,
X. Yang, X. Qi, and X. Zhou, “Deep Learning Technologies for Time Series Anomaly Detection in Healthcare: A Review,”IEEE Access, vol. 11, pp. 117 788–117 799, 2023
2023
-
[4]
Deep Learning for Time Series Anomaly Detection: A Survey,
Z. Zamanzadeh Darban, G. I. Webb, S. Pan, C. Aggarwal, and M. Salehi, “Deep Learning for Time Series Anomaly Detection: A Survey,” vol. 57, no. 1, pp. 15:1–15:42. [Online]. Available: https://dl.acm.org/doi/10.1145/3691338
-
[5]
Autoencoders,
D. Bank, N. Koenigstein, and R. Giryes, “Autoencoders,”Machine learn- ing for data science handbook: data mining and knowledge discovery handbook, pp. 353–374, 2023
2023
-
[6]
Recurrent neural networks,
L. R. Medsker, L. Jainet al., “Recurrent neural networks,”Design and applications, vol. 5, no. 64-67, p. 2, 2001
2001
-
[7]
Attention is All you Need,
A. Vaswani, N. Shazeer, N. Parmar, J. Uszkoreit, L. Jones, A. N. Gomez, L. Kaiser, and I. Polosukhin, “Attention is All you Need,” inAdvances in Neural Information Processing Systems, vol. 30. Curran Associates, Inc. [Online]. Available: https://proceedings.neurips. cc/paper/2017/hash/3f5ee243547dee91fbd053c1c4a845aa-Abstract.html
2017
-
[8]
Tab: Unified benchmarking of time series anomaly detection methods,
X. Qiu, Z. Li, W. Qiu, S. Hu, L. Zhou, X. Wu, Z. Li, C. Guo, A. Zhou, Z. Sheng, J. Hu, C. S. Jensen, and B. Yang, “Tab: Unified benchmarking of time series anomaly detection methods,”Proc. VLDB Endow., vol. 18, no. 9, p. 2775–2789, May 2025. [Online]. Available: https://doi.org/10.14778/3746405.3746407
-
[9]
The elephant in the room: Towards a reliable time-series anomaly detection benchmark,
Q. Liu and J. Paparrizos, “The elephant in the room: Towards a reliable time-series anomaly detection benchmark,” inProceedings of the 38th International Conference on Neural Information Processing Systems, ser. NIPS ’24, vol. 37. Curran Associates Inc., 2024, pp. 108 231–108 261
2024
-
[10]
Y . Wang, H. Wu, J. Dong, Y . Liu, M. Long, and J. Wang. Deep Time Series Models: A Comprehensive Survey and Benchmark. [Online]. Available: http://arxiv.org/abs/2407.13278
-
[11]
V . Chandola, A. Banerjee, and V . Kumar, “Anomaly detection: A survey,”ACM Comput. Surv., vol. 41, no. 3, Jul. 2009. [Online]. Available: https://doi.org/10.1145/1541880.1541882
-
[12]
A review on outlier/anomaly detection in time series data,
A. Bl ´azquez-Garc´ıa, A. Conde, U. Mori, and J. A. Lozano, “A review on outlier/anomaly detection in time series data,”ACM Comput. Surv., vol. 54, no. 3, Apr. 2021. [Online]. Available: https://doi.org/10.1145/3444690
-
[13]
Dive into time-series anomaly detection: A decade review,
P. Boniol, Q. Liu, M. Huang, T. Palpanas, and J. Paparrizos, “Dive into time-series anomaly detection: A decade review,” 2024
2024
-
[14]
An experimental evaluation of anomaly detection in time series,
A. Zhang, S. Deng, D. Cui, Y . Yuan, and G. Wang, “An experimental evaluation of anomaly detection in time series,”PVLDB, vol. 17, no. 3, 2023. 12
2023
-
[15]
Matrix profile i: all pairs similarity joins for time series: a unifying view that includes motifs, discords and shapelets,
C.-C. M. Yeh, Y . Zhu, L. Ulanova, N. Begum, Y . Ding, H. A. Dau, D. F. Silva, A. Mueen, and E. Keogh, “Matrix profile i: all pairs similarity joins for time series: a unifying view that includes motifs, discords and shapelets,” in2016 IEEE 16th international conference on data mining (ICDM). Ieee, 2016, pp. 1317–1322
2016
-
[16]
Isolation Forest,
F. T. Liu, K. M. Ting, and Z.-H. Zhou, “Isolation Forest,” inICDM, 2008, pp. 413–422
2008
-
[17]
ARIMA Based Network Anomaly Detection,
A. H. Yaacob, I. K. Tan, S. F. Chien, and H. K. Tan, “ARIMA Based Network Anomaly Detection,” in2010 Second International Conference on Communication Software and Networks, 2010, pp. 205–209
2010
-
[18]
Detecting spacecraft anomalies using lstms and nonparametric dynamic thresholding,
K. Hundman, V . Constantinou, C. Laporte, I. Colwell, and T. Soder- strom, “Detecting spacecraft anomalies using lstms and nonparametric dynamic thresholding,” inACM SIGKDD, New York, NY , USA, 2018, p. 387–395
2018
-
[19]
Shapley values of reconstruction errors of pca for explain- ing anomaly detection,
N. Takeishi, “Shapley values of reconstruction errors of pca for explain- ing anomaly detection,” in2019 international conference on data mining workshops (icdmw). IEEE, 2019, pp. 793–798
2019
-
[20]
Malhotra, A
P. Malhotra, A. Ramakrishnan, G. Anand, L. Vig, P. Agarwal, and G. Shroff. LSTM-based Encoder-Decoder for Multi-sensor Anomaly Detection. arXiv.org. [Online]. Available: https://arxiv.org/abs/1607. 00148v2
-
[21]
D. Park, Y . Hoshi, and C. C. Kemp, “A Multimodal Anomaly Detector for Robot-Assisted Feeding Using an LSTM-Based Variational Autoencoder,” vol. 3, no. 3, pp. 1544–1551. [Online]. Available: https://ieeexplore.ieee.org/abstract/document/8279425
-
[22]
A Deep Neural Network for Unsupervised Anomaly Detection and Diagnosis in Multivariate Time Series Data,
C. Zhang, D. Song, Y . Chen, X. Feng, C. Lumezanu, W. Cheng, J. Ni, B. Zong, H. Chen, and N. V . Chawla, “A Deep Neural Network for Unsupervised Anomaly Detection and Diagnosis in Multivariate Time Series Data,” vol. 33, no. 01, pp. 1409–1416. [Online]. Available: https://ojs.aaai.org/index.php/AAAI/article/view/3942
-
[23]
Timesnet: Temporal 2d-variation modeling for general time series analysis,
H. Wu, T. Hu, Y . Liu, H. Zhou, J. Wang, and M. Long, “Timesnet: Temporal 2d-variation modeling for general time series analysis,”arXiv preprint arXiv:2210.02186, 2022
Pith/arXiv arXiv 2022
-
[24]
Q. Wen, T. Zhou, C. Zhang, W. Chen, Z. Ma, J. Yan, and L. Sun. Transformers in Time Series: A Survey. [Online]. Available: http://arxiv.org/abs/2202.07125
-
[25]
Autoformer: Decomposition transformers with auto-correlation for long-term series forecasting,
H. Wu, J. Xu, J. Wang, and M. Long, “Autoformer: Decomposition transformers with auto-correlation for long-term series forecasting,” Advances in neural information processing systems, vol. 34, pp. 22 419– 22 430, 2021
2021
-
[26]
Fedformer: Frequency enhanced decomposed transformer for long-term series fore- casting,
T. Zhou, Z. Ma, Q. Wen, X. Wang, L. Sun, and R. Jin, “Fedformer: Frequency enhanced decomposed transformer for long-term series fore- casting,” inInternational conference on machine learning. PMLR, 2022, pp. 27 268–27 286
2022
-
[27]
USAD: UnSupervised Anomaly Detection on Multivariate Time Series,
J. Audibert, P. Michiardi, F. Guyard, S. Marti, and M. A. Zuluaga, “USAD: UnSupervised Anomaly Detection on Multivariate Time Series,” inProceedings of the 26th ACM SIGKDD International Conference on Knowledge Discovery & Data Mining. ACM, 2020, pp. 3395–3404. [Online]. Available: https://dl.acm.org/doi/10.1145/ 3394486.3403392
arXiv 2020
-
[28]
Anomaly transformer: Time series anomaly detection with association discrepancy,
J. Xu, H. Wu, J. Wang, and M. Long, “Anomaly transformer: Time series anomaly detection with association discrepancy,”arXiv preprint arXiv:2110.02642, 2021
arXiv 2021
-
[29]
Contrastive Time-Series Anomaly Detection,
H. Kim, S. Kim, S. Min, and B. Lee, “Contrastive Time-Series Anomaly Detection,” vol. 36, no. 10, pp. 5053–5065. [Online]. Available: https://ieeexplore.ieee.org/abstract/document/10325644
-
[30]
An introduction to ROC analysis,
T. Fawcett, “An introduction to ROC analysis,” vol. 27, no. 8, pp. 861–874. [Online]. Available: https://www.sciencedirect.com/science/ article/pii/S016786550500303X
-
[31]
The relationship between Precision-Recall and ROC curves,
J. Davis and M. Goadrich, “The relationship between Precision-Recall and ROC curves,” inProceedings of the 23rd International Conference on Machine Learning - ICML ’06. ACM Press, pp. 233–240. [Online]. Available: http://portal.acm.org/citation.cfm?doid=1143844.1143874
-
[32]
Precision and Recall for Time Series,
N. Tatbul, T. J. Lee, S. Zdonik, M. Alam, and J. Gottschlich, “Precision and Recall for Time Series,” inAdvances in Neural Information Processing Systems, vol. 31. Curran Associates, Inc. [Online]. Available: https://proceedings.neurips.cc/paper/2018/hash/ 8f468c873a32bb0619eaeb2050ba45d1-Abstract.html
2018
-
[33]
Krishna, Marine Bruel, Qinghua Liu, Mingyi Huang, Themis Palpanas, Ruey S
P. Boniol, A. K. Krishna, M. Bruel, Q. Liu, M. Huang, T. Palpanas, R. S. Tsay, A. Elmore, M. J. Franklin, and J. Paparrizos, “VUS: Effective and efficient accuracy measures for time-series anomaly detection,” vol. 34, no. 3, p. 32. [Online]. Available: https://doi.org/10.1007/s00778-025-00907-x
-
[34]
A novel anomaly detection scheme based on principal component classifier,
M.-L. Shyu, S.-C. Chen, K. Sarinnapakorn, and L. Chang, “A novel anomaly detection scheme based on principal component classifier,” 2003
2003
-
[35]
Are transformers effective for time series forecasting?
A. Zeng, M. Chen, L. Zhang, and Q. Xu, “Are transformers effective for time series forecasting?” inProceedings of the AAAI conference on artificial intelligence, vol. 37, no. 9, 2023, pp. 11 121–11 128
2023
-
[36]
Individual comparisons by ranking methods,
F. Wilcoxon, “Individual comparisons by ranking methods,” inBreak- throughs in statistics: Methodology and distribution. Springer, 1992, pp. 196–202
1992
-
[37]
A simple sequentially rejective multiple test procedure,
S. Holm, “A simple sequentially rejective multiple test procedure,” Scandinavian journal of statistics, pp. 65–70, 1979
1979
-
[38]
Generalized Discords for Time Series Anomaly Detection with Flexible Subsequence Lengths,
M. Imamura, “Generalized Discords for Time Series Anomaly Detection with Flexible Subsequence Lengths,” inProceedings of the 31st ACM SIGKDD Conference on Knowledge Discovery and Data Mining V.2, ser. KDD ’25. Association for Computing Machinery, pp. 1013–1024. [Online]. Available: https://dl.acm.org/doi/10.1145/3711896.3736977
-
[39]
S. Tafazoli, Y . Lu, R. Wu, T. V . A. Srinivas, H. Dela Cruz, R. Mercer, and E. Keogh, “C22MP: The marriage of catch22 and the matrix profile creates a fast, efficient and interpretable anomaly detector,” Knowledge and Information Systems, vol. 66, pp. 4789–4823, 2024. [Online]. Available: https://doi.org/10.1007/s10115-024-02107-5
-
[40]
Y . Lu, R. Wu, A. Mueen, M. A. Zuluaga, and E. Keogh, “DAMP: Accurate time series anomaly detection on trillions of datapoints and ultra-fast arriving data streams,”Data Mining and Knowledge Discovery, vol. 37, no. 2, pp. 627–669, 2023. [Online]. Available: https://doi.org/10.1007/s10618-022-00911-7
-
[41]
Unsupervised and scalable subsequence anomaly detection in large data series,
P. Boniol, M. Linardi, F. Roncallo, T. Palpanas, M. Meftah, and E. Remy, “Unsupervised and scalable subsequence anomaly detection in large data series,”The VLDB Journal, vol. 30, no. 6, pp. 909–931,
-
[42]
Available: https://doi.org/10.1007/s00778-021-00655-8
[Online]. Available: https://doi.org/10.1007/s00778-021-00655-8
-
[43]
Matrix Profile XI: SCRIMP++: Time Series Motif Discovery at Interactive Speeds,
Y . Zhu, C.-C. M. Yeh, Z. Zimmerman, K. Kamgar, and E. Keogh, “Matrix Profile XI: SCRIMP++: Time Series Motif Discovery at Interactive Speeds,” in2018 IEEE International Conference on Data Mining (ICDM), 2018, pp. 837–846. [Online]. Available: https://ieeexplore.ieee.org/abstract/document/8594908
arXiv 2018
-
[44]
TranAD: Deep transformer networks for anomaly detection in multivariate time series data,
S. Tuli, G. Casale, and N. R. Jennings, “TranAD: Deep transformer networks for anomaly detection in multivariate time series data,” vol. 15, no. 6, pp. 1201–1214. [Online]. Available: https://dl.acm.org/ doi/10.14778/3514061.3514067 APPENDIX TABLE VIII: Training and Optimization Hyperparameter Search Space for the three random seeds{0,1,2} Hyperparameter ...
discussion (0)
Sign in with ORCID, Apple, or X to comment. Anyone can read and Pith papers without signing in.