Reinterpreting the JWST Observations of 55 Cancri e with a Non-Grey General Circulation Model
Pith reviewed 2026-06-27 08:12 UTC · model grok-4.3
The pith
3D models favor thick CO2-rich atmospheres for 55 Cancri e over thin CO models
A machine-rendered reading of the paper's core claim, the machinery that carries it, and where it could break.
Core claim
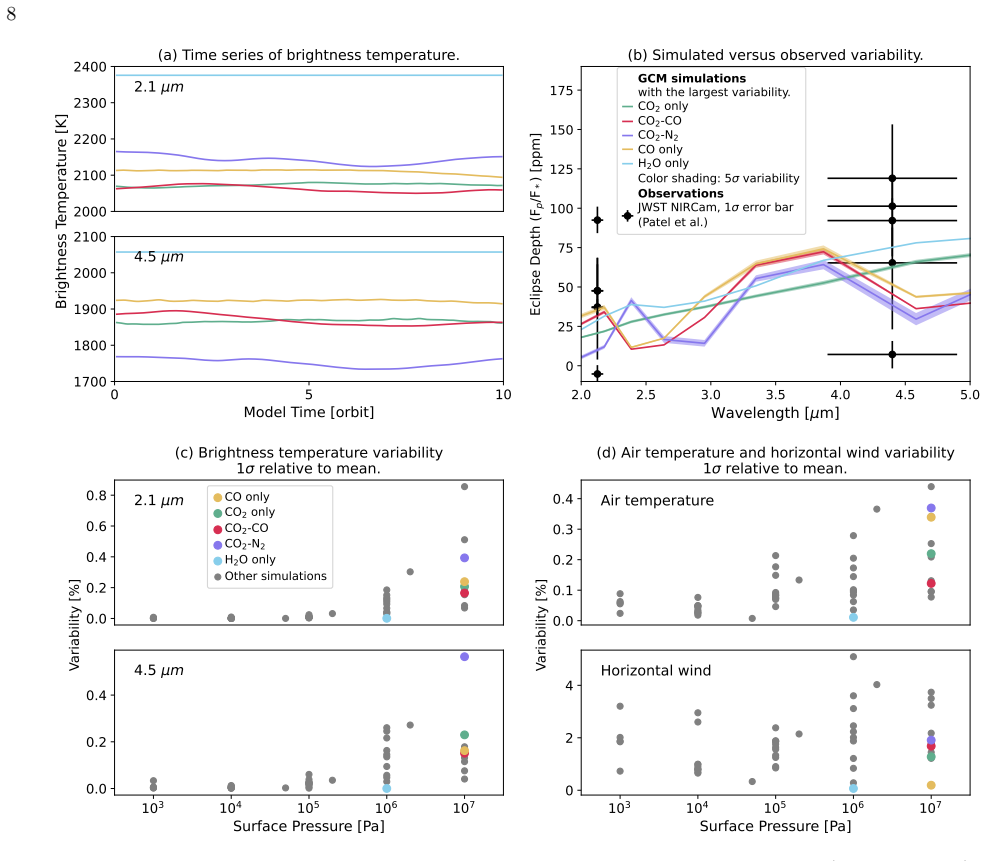
Our best-fit simulations match the JWST spectra well, favoring an atmosphere that is both thick (≥ 10 bar) and CO₂-rich (>1% CO₂ volume mixing ratio), while ruling out thin (< 10 bar) and pure-CO/CO₂-poor atmospheres previously proposed based on 1D models. We also find large-scale atmospheric dynamics is insufficient to explain the observed variability. A thick, CO₂-rich atmosphere implies that 55 Cancri e likely formed with significantly more volatiles than Earth and Venus. In addition, a thick atmosphere makes it unlikely that the planet's variability is caused by transient outgassing, favoring other variability mechanisms such as clouds.
What carries the argument
Cloud-free non-grey general circulation model using custom correlated-k coefficients derived from the ExoMol database to compute radiative transfer and atmospheric circulation self-consistently
Load-bearing premise
The custom correlated-k coefficients accurately represent gas opacities at the extreme temperatures of 55 Cancri e and the assumption of no clouds does not affect the conclusions about spectral fits or variability
What would settle it
New spectra that match thin atmosphere predictions more closely than thick CO2-rich models, or direct evidence of surface pressure below 10 bar, would falsify the preference for thick CO2-rich conditions
Figures
read the original abstract
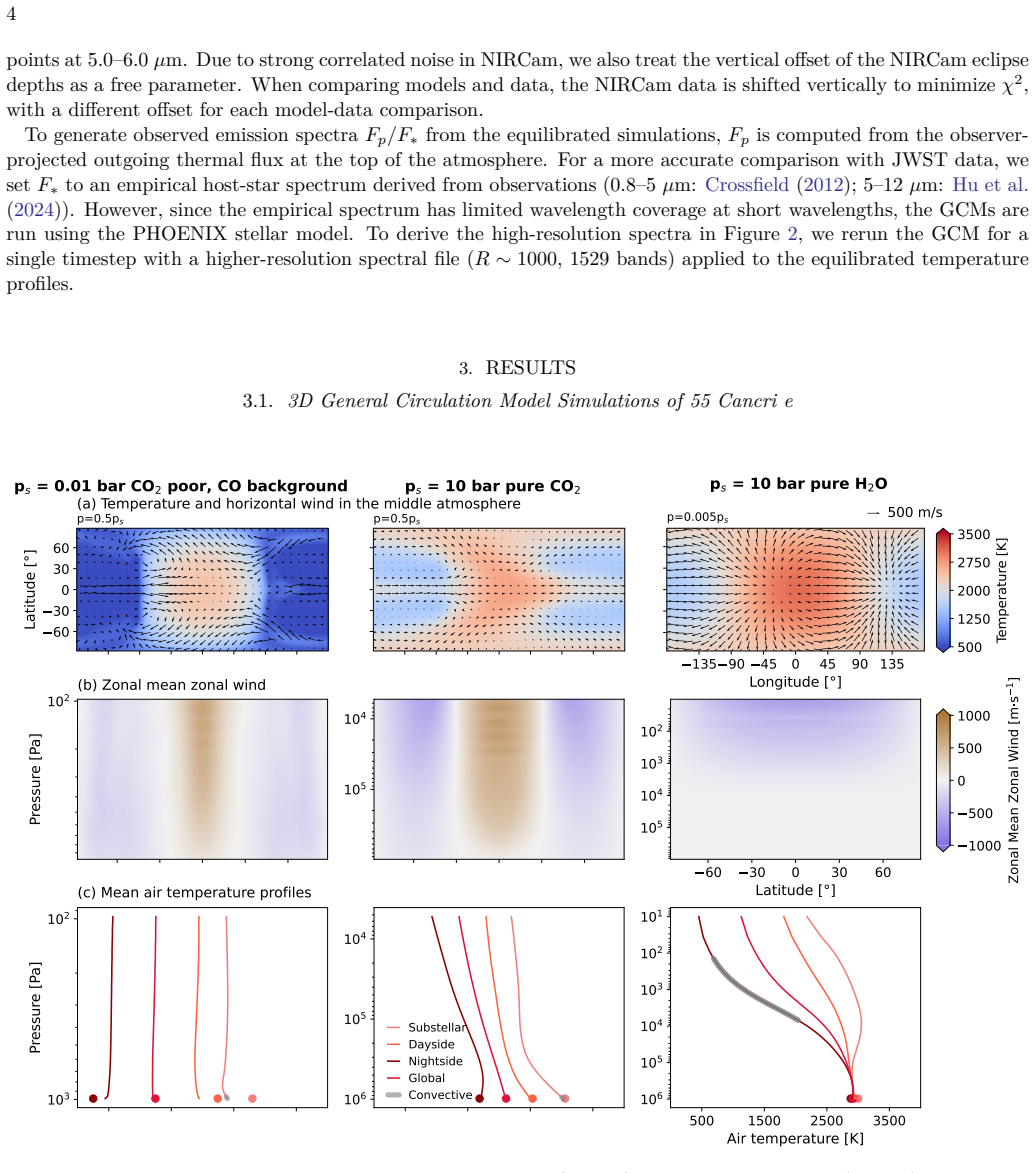
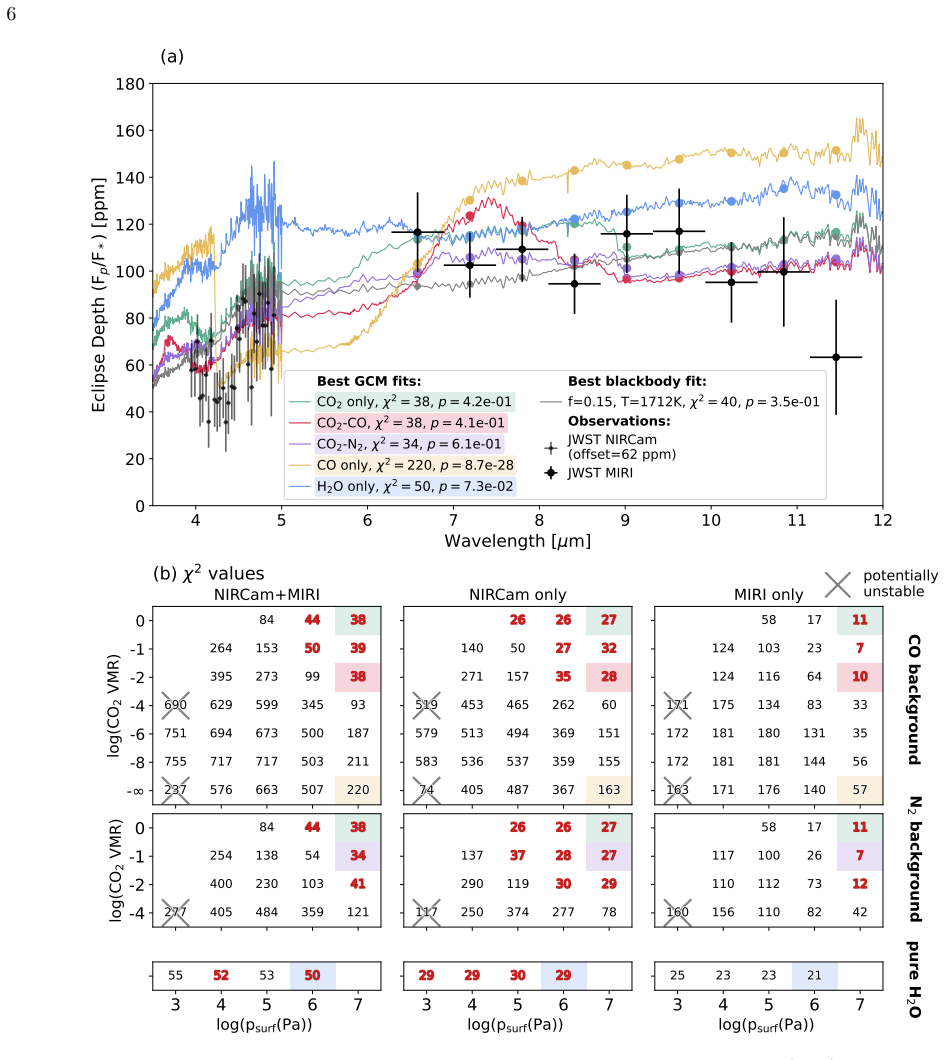
Recent observations of 55 Cancri e suggest an atmosphere rich in CO or CO$_2$ (Hu et al. 2024); other observations indicate the planet's eclipse depth is highly variable (e.g. Patel et al. 2024). So far, these observations have only been interpreted using 1D models without self-consistent heat redistribution, as the planet's extreme temperatures make it inaccessible to most 3D models. Here we perform cloud-free GCM simulations of 55 Cancri e using custom correlated-$k$ coefficients developed from the ExoMol database. Our best-fit simulations match the JWST spectra from Hu et al. (2024) well, favoring an atmosphere that is both thick ($\ge$ 10 bar) and CO$_2$-rich ($>1\%$ CO$_2$ volume mixing ratio), while ruling out thin ($<$ 10 bar) and pure-CO/CO$_2$-poor atmosphere, which were previously proposed based on 1D models (Hu et al. 2024; Zilinskas et al. 2025). We also find large-scale atmospheric dynamics, i.e. weather, is insufficient to explain the observed variability. A thick, CO$_2$-rich atmosphere implies that 55 Cancri e likely formed with significantly more volatiles than Earth and Venus. In addition, a thick atmosphere makes it unlikely that the planet's variability is caused by transient outgassing (Heng 2023), favoring other variability mechanisms (e.g. clouds). Our work provides model constraints for upcoming JWST observations of 55 Cancri e, and highlights the importance of interpreting thermal emission observations with self-consistent 3D models.
Editorial analysis
A structured set of objections, weighed in public.
Referee Report
Summary. The paper performs cloud-free, non-grey GCM simulations of the ultra-hot super-Earth 55 Cancri e using custom correlated-k coefficients derived from the ExoMol database. It reports that the best-fit models with surface pressures ≥10 bar and CO₂ volume mixing ratios >1% reproduce the JWST thermal emission spectra of Hu et al. (2024), while thin (<10 bar) and CO-dominated or CO₂-poor atmospheres are ruled out; it further concludes that atmospheric dynamics cannot account for the observed eclipse-depth variability.
Significance. If the opacity tables and quantitative fits hold, the work would be significant for demonstrating that self-consistent 3D heat redistribution alters the interpretation of JWST data relative to prior 1D models, yielding constraints on atmospheric thickness and composition that bear on formation volatile budgets and variability mechanisms. The explicit use of 3D dynamics rather than parameterized redistribution is a methodological strength.
major comments (3)
- [Abstract, results] Abstract and results sections: the claim that best-fit simulations 'match the JWST spectra well' and rule out thin/pure-CO cases is presented without any quantitative fit statistics (χ², reduced χ², residual rms, or direct comparison to the 1D model fits of Hu et al. 2024). This absence prevents assessment of whether the 3D models provide a statistically meaningful improvement or robust exclusion of the previously proposed parameter space.
- [Methods] Methods (correlated-k construction): the custom correlated-k coefficients developed from ExoMol are not validated against line-by-line calculations or independent opacity databases at the relevant temperatures (∼1500–3000 K) and pressures. Because these tables directly determine the spectral shape and absolute flux levels in the 4–5 µm and 10–12 µm windows used to favor CO₂-rich over CO-dominated compositions, the lack of such benchmarks is load-bearing for the central claim that thin and CO-poor atmospheres are ruled out.
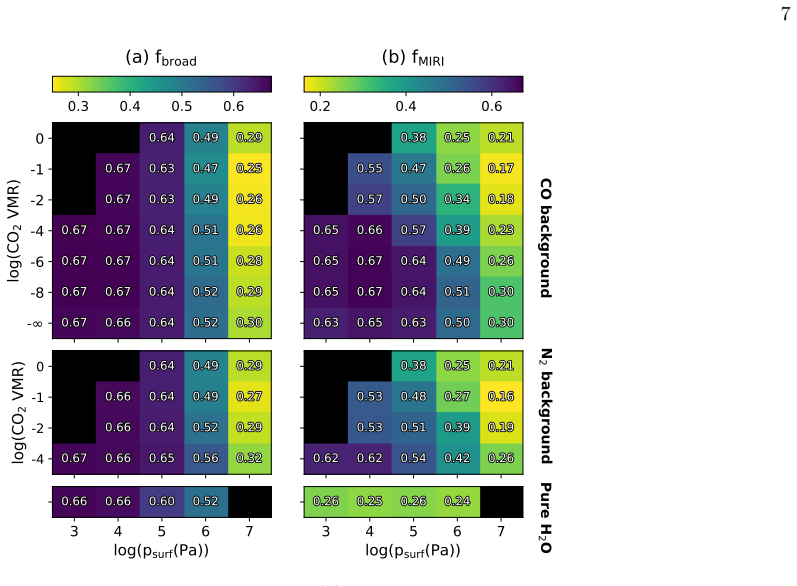
- [Results] Results (parameter exploration): the manuscript does not report the grid or sampling strategy used to explore the two free parameters (surface pressure and CO₂ VMR), nor does it provide posterior uncertainties or degeneracy analysis. Without these details it is unclear whether the ≥10 bar, >1% CO₂ preference is unique or sensitive to post-hoc choices.
minor comments (2)
- [Methods] Notation for the correlated-k tables and the specific ExoMol line lists employed should be stated explicitly in the methods to allow reproducibility.
- [Figures] Figure captions should include the exact JWST data points (wavelength bins and error bars) overlaid on the model spectra for direct visual comparison.
Simulated Author's Rebuttal
We thank the referee for their thoughtful and constructive review. We address each major comment below, indicating revisions that will be incorporated into the revised manuscript to strengthen the quantitative support for our conclusions.
read point-by-point responses
-
Referee: [Abstract, results] Abstract and results sections: the claim that best-fit simulations 'match the JWST spectra well' and rule out thin/pure-CO cases is presented without any quantitative fit statistics (χ², reduced χ², residual rms, or direct comparison to the 1D model fits of Hu et al. 2024). This absence prevents assessment of whether the 3D models provide a statistically meaningful improvement or robust exclusion of the previously proposed parameter space.
Authors: We agree that the absence of quantitative fit statistics limits the ability to assess the robustness of our conclusions. In the revised manuscript we will add χ² and reduced-χ² values for the best-fit 3D models against the Hu et al. (2024) JWST data, along with residual rms values and a side-by-side comparison to the 1D model fits reported in that work. These additions will enable a direct statistical evaluation of whether the self-consistent 3D heat redistribution improves the fit or strengthens the exclusion of thin and CO-dominated cases. revision: yes
-
Referee: [Methods] Methods (correlated-k construction): the custom correlated-k coefficients developed from the ExoMol are not validated against line-by-line calculations or independent opacity databases at the relevant temperatures (∼1500–3000 K) and pressures. Because these tables directly determine the spectral shape and absolute flux levels in the 4–5 µm and 10–12 µm windows used to favor CO₂-rich over CO-dominated compositions, the lack of such benchmarks is load-bearing for the central claim that thin and CO-poor atmospheres are ruled out.
Authors: We recognize that validation of the correlated-k tables is essential for the reliability of the spectral windows that distinguish CO₂-rich from CO-dominated compositions. In the revised methods section (or a new appendix) we will include direct comparisons of our correlated-k opacities against line-by-line calculations performed with the ExoMol line lists at representative temperatures (1500–3000 K) and pressures spanning the model domain. These benchmarks will be shown for the key 4–5 µm and 10–12 µm regions to confirm that the tables accurately reproduce the relevant absorption features. revision: yes
-
Referee: [Results] Results (parameter exploration): the manuscript does not report the grid or sampling strategy used to explore the two free parameters (surface pressure and CO₂ VMR), nor does it provide posterior uncertainties or degeneracy analysis. Without these details it is unclear whether the ≥10 bar, >1% CO₂ preference is unique or sensitive to post-hoc choices.
Authors: We will expand the results section to document the full parameter grid explored, including the discrete values and ranges sampled for surface pressure and CO₂ volume mixing ratio. We will also report the goodness-of-fit metrics across the grid and provide a brief discussion of parameter degeneracies and the robustness of the ≥10 bar, >1% CO₂ preference. Where feasible, we will include simple uncertainty estimates derived from the model ensemble. revision: yes
Circularity Check
No circularity: claims rest on forward GCM runs vs external JWST data
full rationale
The paper derives its conclusions by running cloud-free GCM simulations with custom correlated-k tables (developed from ExoMol) and directly comparing the resulting spectra to independent JWST observations reported in Hu et al. (2024). No equation defines a target quantity in terms of itself, no fitted parameter is relabeled as a prediction, and no load-bearing premise reduces to a self-citation chain. The central result (thick, CO2-rich atmosphere preferred; thin and CO-dominated cases ruled out) is obtained by matching an external dataset rather than by construction from the model's inputs.
Axiom & Free-Parameter Ledger
free parameters (2)
- surface pressure
- CO2 volume mixing ratio
axioms (2)
- domain assumption Custom correlated-k coefficients from ExoMol accurately capture opacities at extreme temperatures
- domain assumption Cloud-free conditions do not change the spectral fit or variability conclusions
Reference graph
Works this paper leans on
-
[1]
2016, in SF2A-2016: Proceedings of the Annual meeting of the French Society of Astronomy and Astrophysics, ed
Allard, F. 2016, in SF2A-2016: Proceedings of the Annual meeting of the French Society of Astronomy and Astrophysics, ed. C. Reylé, J. Richard, L. Cambrésy, & others, Lyon, France, 223–227
2016
-
[2]
Mayne, N. J. 2017, Astronomy & Astrophysics, 598, A97, doi: 10.1051/0004-6361/201629322
-
[3]
Amundsen, D. S., Mayne, N. J., Baraffe, I., et al. 2016, Astronomy & Astrophysics, 595, A36, doi: 10.1051/0004-6361/201629183
-
[4]
Angelo, I., & Hu, R. 2017, The Astronomical Journal, 154, 232, doi: 10.3847/1538-3881/aa9278 A vice, G., Parai, R., Jacobson, S., et al. 2022, Space Science Reviews, 218, 60, doi: 10.1007/s11214-022-00929-9
-
[5]
2018, Astronomy & Astrophysics, 619, A1, doi: 10.1051/0004-6361/201833154
Bourrier, V., Dumusque, X., Dorn, C., et al. 2018, Astronomy & Astrophysics, 619, A1, doi: 10.1051/0004-6361/201833154
-
[6]
Christie, D. A., Mayne, N. J., Lines, S., et al. 2021, Monthly Notices of the Royal Astronomical Society, 506, 4500, doi: 10.1093/mnras/stab2027
-
[7]
Crossfield, I. J. M. 2012, Astronomy & Astrophysics, 545, A97, doi: 10.1051/0004-6361/201219826
-
[8]
Deibert, E. K., De Mooij, E. J. W., Jayawardhana, R., et al. 2021, The Astronomical Journal, 161, 209, doi: 10.3847/1538-3881/abe768
-
[9]
2016a, Monthly Notices of the Royal Astronomical Society, 455, 2018, doi: 10.1093/mnras/stv2239
Demory, B.-O., Gillon, M., Madhusudhan, N., & Queloz, D. 2016a, Monthly Notices of the Royal Astronomical Society, 455, 2018, doi: 10.1093/mnras/stv2239
-
[10]
2016b, Nature, 532, 207, doi: 10.1038/nature17169
Demory, B.-O., Gillon, M., de Wit, J., et al. 2016b, Nature, 532, 207, doi: 10.1038/nature17169
-
[11]
2023, Astronomy & Astrophysics, 669, A64, doi: 10.1051/0004-6361/202244894
Demory, B.-O., Sulis, S., Meier Valdés, E., et al. 2023, Astronomy & Astrophysics, 669, A64, doi: 10.1051/0004-6361/202244894
-
[12]
Elsasser, W. M. 1942, Heat Transfer by Infrared Radiation in the Atmosphere, Harvard Meteorological Studies No. 6 (Cambridge, MA: Harvard University, Blue Hill Meteorological Observatory)
1942
-
[13]
2020, The Astrophysical Journal, 898, 160, doi: 10.3847/1538-4357/ab9cba 15
Essack, Z., Seager, S., & Pajusalu, M. 2020, The Astrophysical Journal, 898, 160, doi: 10.3847/1538-4357/ab9cba 15
-
[14]
Magma Ocean Waves and Thermal Variability on Lava Worlds
Farhat, M., & Chiang, E. 2026, Magma Ocean Waves and Thermal Variability on Lava Worlds, arXiv, doi: 10.48550/arXiv.2601.07080
work page internal anchor Pith review Pith/arXiv arXiv doi:10.48550/arxiv.2601.07080 2026
-
[15]
Faure, A., Wiesenfeld, L., Drouin, B. J., & Tennyson, J. 2013, Journal of Quantitative Spectroscopy and Radiative Transfer, 116, 79, doi: 10.1016/j.jqsrt.2012.09.015
-
[16]
Fegley, B., Lodders, K., & Jacobson, N. S. 2020, Geochemistry, 80, 125594, doi: 10.1016/j.chemer.2019.125594
-
[17]
A., Cottrell, E., Hauri, E., Lee, K
Fischer, R. A., Cottrell, E., Hauri, E., Lee, K. K. M., & Le Voyer, M. 2020, Proceedings of the National Academy of Sciences, 117, 8743, doi: 10.1073/pnas.1919930117
-
[18]
Fu, Q., & Liou, K. N. 1992, Journal of the Atmospheric Sciences, 49, 2139, doi: 10.1175/1520- 0469(1992)049<2139:OTCDMF>2.0.CO;2
-
[19]
Gamache, R. R., & Orphanos, N. G. 2023, Journal of Physical and Chemical Reference Data, 52, 023101, doi: 10.1063/5.0137083
-
[20]
Gordon, I. E., Rothman, L. S., Hill, C., et al. 2017, Journal of Quantitative Spectroscopy and Radiative Transfer, 203, 3, doi: 10.1016/j.jqsrt.2017.06.038
-
[21]
R., Tennyson, J., & Yurchenko, S
Guest, E. R., Tennyson, J., & Yurchenko, S. N. 2024, Journal of Molecular Spectroscopy, 401, 111901, doi: 10.1016/j.jms.2024.111901
-
[22]
Guzewich, S. D., Way, M. J., Aleinov, I., et al. 2021, Journal of Geophysical Research: Planets, 126, e2021JE006825, doi: 10.1029/2021JE006825
-
[23]
Halliday, A. N. 2013, Geochimica et Cosmochimica Acta, 105, 146, doi: 10.1016/j.gca.2012.11.015
-
[24]
Hammond, M., & T. Pierrehumbert, R. 2017, The Astrophysical Journal, 849, 152, doi: 10.3847/1538-4357/aa9328
-
[25]
2023, ApJL, 956, L20, doi: 10.3847/2041-8213/acfe05
Heng, K. 2023, The Astrophysical Journal Letters, 956, L20, doi: 10.3847/2041-8213/acfe05
-
[26]
2024, Nature, 630, 609, doi: 10.1038/s41586-024-07432-x
Hu, R., Bello-Arufe, A., Zhang, M., et al. 2024, Nature, 630, 609, doi: 10.1038/s41586-024-07432-x
-
[27]
Jans, E. R. 2024, Journal of Quantitative Spectroscopy and Radiative Transfer, 312, 108809, doi: 10.1016/j.jqsrt.2023.108809
-
[28]
Ji, X., Chatterjee, R. D., Coy, B. P., & Kite, E. S. 2025, The Cosmic Shoreline Revisited: A Metric for Atmospheric Retention Informed by Hydrodynamic Escape, arXiv, doi: 10.48550/arXiv.2504.19872
-
[29]
Jindal, A., Mooij, E. J. W. d., Jayawardhana, R., et al. 2020, The Astronomical Journal, 160, 101, doi: 10.3847/1538-3881/aba1eb
-
[30]
Karman, T., Gordon, I. E., van der A voird, A., et al. 2019, Icarus, 328, 160, doi: 10.1016/j.icarus.2019.02.034
-
[31]
Keller-Rudek, H., Moortgat, G. K., Sander, R., & Sörensen, R. 2013, Earth System Science Data, 5, 365, doi: 10.5194/essd-5-365-2013
-
[32]
2020, Research Notes of the AAS, 4, 170, doi: 10.3847/2515-5172/abbc0f
Kipping, D., & Jansen, T. 2020, Research Notes of the AAS, 4, 170, doi: 10.3847/2515-5172/abbc0f
-
[33]
Koll, D. D. B. 2022, The Astrophysical Journal, 924, 134, doi: 10.3847/1538-4357/ac3b48
-
[34]
Koll, D. D. B., & Abbot, D. S. 2015, The Astrophysical Journal, 802, 21, doi: 10.1088/0004-637X/802/1/21
-
[35]
Lewis, N. T., Colyer, G. J., & Read, P. L. 2021, Journal of the Atmospheric Sciences, 78, 1245, doi: 10.1175/JAS-D-20-0326.1
-
[36]
Li, G., Gordon, I. E., Rothman, L. S., et al. 2015, The Astrophysical Journal Supplement Series, 216, 15, doi: 10.1088/0067-0049/216/1/15
-
[37]
Loftus, K., Luo, Y., Fan, B., & Kite, E. S. 2024, Extreme Weather Variability on Hot Rocky Exoplanet 55 Cancri e Explained by Magma Temperature-Cloud Feedback, arXiv. http://arxiv.org/abs/2409.16270 Lécuyer, C., Simon, L., & Guyot, F. 2000, Earth and Planetary Science Letters, 181, 33, doi: 10.1016/S0012-821X(00)00195-3
-
[38]
Meier, T. G., Bower, D. J., Lichtenberg, T., Hammond, M., & Tackley, P. J. 2023, Astronomy & Astrophysics, 678, A29, doi: 10.1051/0004-6361/202346950
-
[39]
J., Dang, L., Gass, A., Cowan, N
Mercier, S. J., Dang, L., Gass, A., Cowan, N. B., & Bell, T. J. 2022, The Astronomical Journal, 164, 204, doi: 10.3847/1538-3881/ac8f22
-
[40]
A., Brandeker, A., Kitzmann, D., et al
Patel, J. A., Brandeker, A., Kitzmann, D., et al. 2024, JWST reveals a rapid and strong day side variability of 55 Cancri e, arXiv. http://arxiv.org/abs/2407.12898
arXiv 2024
-
[41]
Penn, J., & Vallis, G. K. 2018, The Astrophysical Journal, 868, 147, doi: 10.3847/1538-4357/aaeb20
-
[42]
Polyansky, O. L., Kyuberis, A. A., Zobov, N. F., et al. 2018, Monthly Notices of the Royal Astronomical Society, 480, 2597, doi: 10.1093/mnras/sty1877
-
[43]
Gamache, R. R. 1992, Journal of Quantitative Spectroscopy and Radiative Transfer, 48, 537, doi: 10.1016/0022-4073(92)90119-O
-
[44]
2009, The Astrophysical Journal, 703, 1884, doi: 10.1088/0004-637X/703/2/1884
Seager, S., & Deming, D. 2009, The Astrophysical Journal, 703, 1884, doi: 10.1088/0004-637X/703/2/1884
-
[45]
Seager, S., Richardson, L. J., Hansen, B. M. S., et al. 2005, The Astrophysical Journal, 632, 1122, doi: 10.1086/444411
-
[46]
Selsis, F., Wordsworth, R. D., & Forget, F. 2011, Astronomy and Astrophysics, 532, A1, doi: 10.1051/0004-6361/201116654
-
[47]
Shemansky, D. E. 1969, The Journal of Chemical Physics, 51, 689, doi: 10.1063/1.1672058 16
-
[48]
Showman, A. P., & Kaspi, Y. 2013, The Astrophysical Journal, 776, 85, doi: 10.1088/0004-637X/776/2/85
-
[49]
Somogyi, W., Yurchenko, S. N., & Yachmenev, A. 2021, The Journal of Chemical Physics, 155, 214303, doi: 10.1063/5.0063256
-
[50]
1994, Journal Of The Brazilian Chemical Society, 5, 59, doi: 10.5935/0103-5053.19940010
Souza, A., & Srivastava, S. 1994, Journal Of The Brazilian Chemical Society, 5, 59, doi: 10.5935/0103-5053.19940010
-
[51]
Tennyson, J., & Yurchenko, S. N. 2018, Atoms, 6, 26, doi: 10.3390/atoms6020026
-
[52]
Thomson, S. I., & Vallis, G. K. 2019a, Atmosphere, 10, 803, doi: 10.3390/atmos10120803 —. 2019b, Quarterly Journal of the Royal Meteorological Society, 145, 2627, doi: 10.1002/qj.3582
-
[53]
2009, The Astrophysical Journal, 703, 905, doi: 10.1088/0004-637X/703/1/905
Tian, F. 2009, The Astrophysical Journal, 703, 905, doi: 10.1088/0004-637X/703/1/905
-
[54]
Tsiaras, A., Rocchetto, M., Waldmann, I. P., et al. 2016, The Astrophysical Journal, 820, 99, doi: 10.3847/0004-637X/820/2/99
-
[55]
Turbet, M., Fauchez, T. J., Sergeev, D. E., et al. 2022, The Planetary Science Journal, 3, 211, doi: 10.3847/PSJ/ac6cf0 Valdés, E. A. M., Morris, B. M., Wells, R. D., Schanche, N., & Demory, B.-O. 2022, Astronomy & Astrophysics, 663, A95, doi: 10.1051/0004-6361/202243768
-
[56]
K., Colyer, G., Geen, R., et al
Vallis, G. K., Colyer, G., Geen, R., et al. 2018, Geoscientific Model Development, 11, 843, doi: 10.5194/gmd-11-843-2018
-
[57]
Way, M. J., Aleinov, I., Amundsen, D. S., et al. 2017, The Astrophysical Journal Supplement Series, 231, 12, doi: 10.3847/1538-4365/aa7a06
-
[58]
Western, C. M. 2017, Journal of Quantitative Spectroscopy and Radiative Transfer, 186, 221, doi: 10.1016/j.jqsrt.2016.04.010
-
[59]
M., Carter-Blatchford, L., Crozet, P., et al
Western, C. M., Carter-Blatchford, L., Crozet, P., et al. 2018, Journal of Quantitative Spectroscopy and Radiative Transfer, 219, 127, doi: 10.1016/j.jqsrt.2018.07.017
-
[60]
Yurchenko, S. N., Al-Refaie, A. F., & Tennyson, J. 2018, Astronomy & Astrophysics, 614, A131, doi: 10.1051/0004-6361/201732531
-
[61]
N., Tennyson, J., Syme, A.-M., et al
Yurchenko, S. N., Tennyson, J., Syme, A.-M., et al. 2022, Monthly Notices of the Royal Astronomical Society, 510, 903, doi: 10.1093/mnras/stab3267
-
[62]
G., Welch, R
Zdunkowski, W. G., Welch, R. M., & Korb, G. 1980, Contributions to Atmospheric Physics, 53, 147
1980
-
[63]
Zhan, R., Koll, D. D. B., & Ding, F. 2024, The Astrophysical Journal, 971, 125, doi: 10.3847/1538-4357/ad54c1
-
[64]
Zhang, X., & Showman, A. P. 2017, The Astrophysical Journal, 836, 73, doi: 10.3847/1538-4357/836/1/73
-
[65]
Zilinskas, M., Buchem, C. v., Zieba, S., et al. 2025, Characterising the Atmosphere of 55 Cancri e: 1D Forward Model Grid for Current and Future JWST Observations, arXiv, doi: 10.48550/arXiv.2503.15844
discussion (0)
Sign in with ORCID, Apple, or X to comment. Anyone can read and Pith papers without signing in.