Is It You or Your Environment? A Bayesian Inference Framework for Genomically-Anchored Personalized Physiological Interpretation
Pith reviewed 2026-06-27 06:56 UTC · model grok-4.3
The pith
An individual's genomic profile initializes a Bayesian prior over physiological set points that separates constitutional from environmental effects from the first measurement.
A machine-rendered reading of the paper's core claim, the machinery that carries it, and where it could break.
Core claim
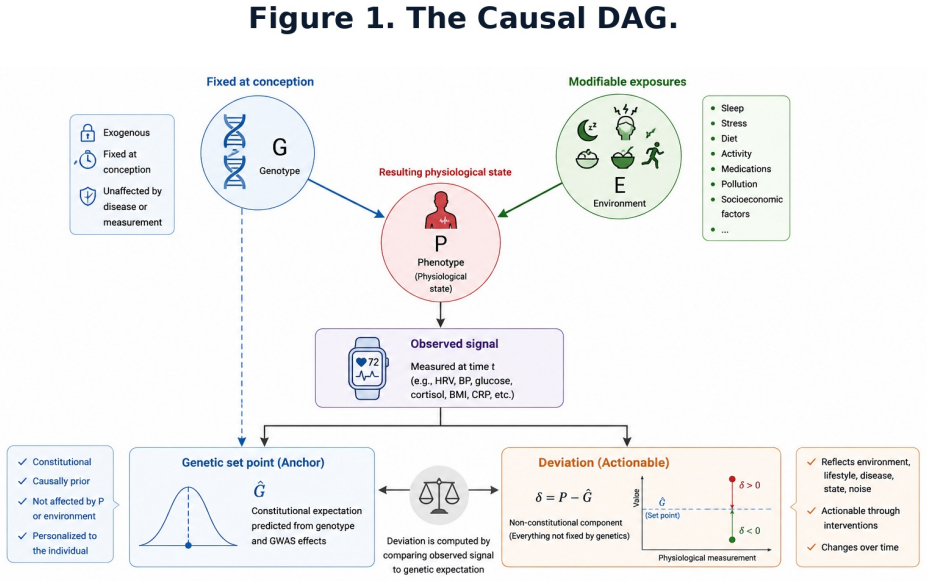
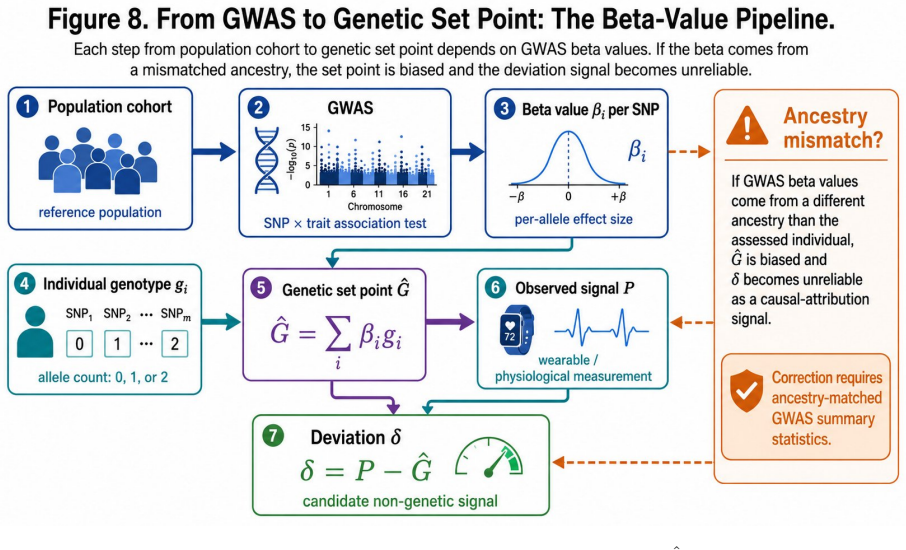
An individual's genomic profile serves as an exogenous genetic anchor that initializes a Bayesian belief state over physiological set point G-hat = mu + sum(beta_i * g_i), allowing separation of constitutional from environmental deviation from the first measurement onward.
What carries the argument
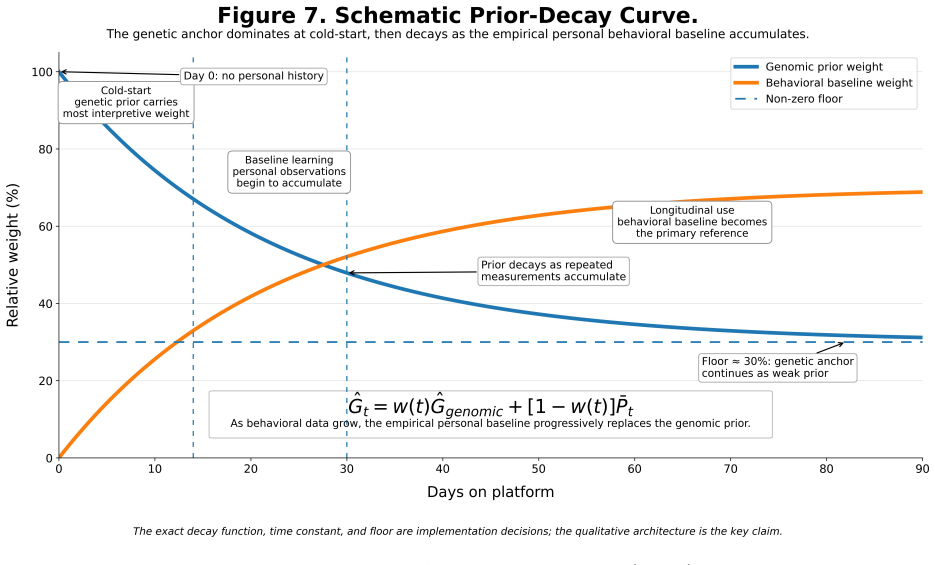
The genomic prior G-hat = mu + sum(beta_i * g_i) that initializes the Bayesian state and decays via a time-weighted function toward empirical averages.
If this is right
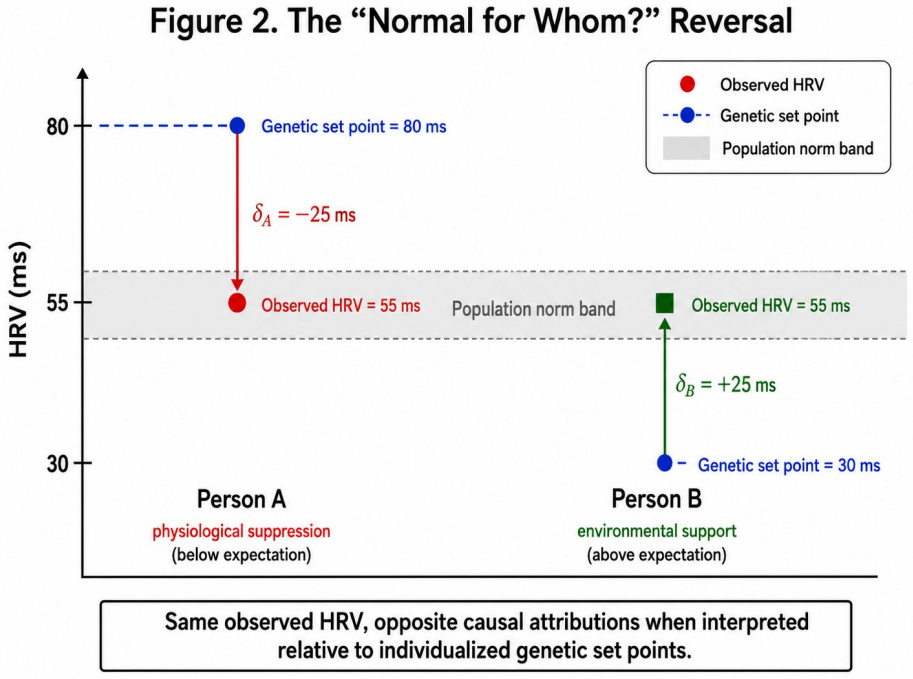
- The same observed value, such as HRV of 55 ms, generates a suppression hypothesis for one genomic prior and an enhancement hypothesis for another.
- The belief state transitions from genome-dominated to data-dominated inference through the decay function G-hat_t = w(t)*G-hat_genomic + [1-w(t)]*P-bar_t.
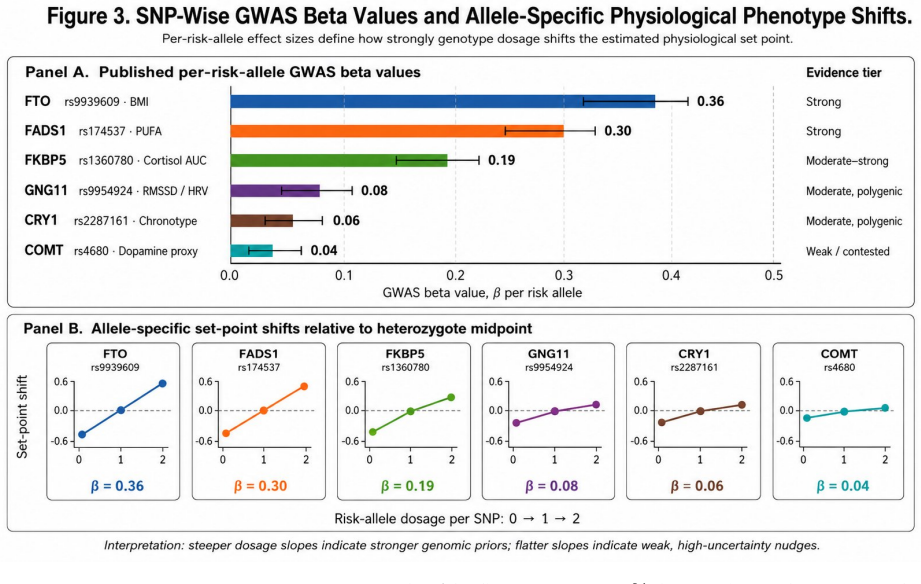
- Priors must be evidence-graded, favoring robustly replicated loci over contested candidate genes.
- Valid deployment requires ancestry-matched effect sizes and produces attributions rather than deterministic outputs.
Where Pith is reading between the lines
- Consumer genetic data could enable immediate baseline separation in health monitoring apps without an initial observation period.
- The approach could be tested by comparing G-hat predictions against multi-year empirical averages in large cohorts while controlling for environment.
- Similar anchoring might apply to other domains where stable genetic predictors exist for individual set points.
Load-bearing premise
GWAS-derived effect sizes can be treated as accurate, fixed, individual-level predictors of physiological set points that are immune to reverse causation and transferable across individuals within ancestry groups.
What would settle it
Long-term average physiological measurements for individuals with known genomic profiles that deviate substantially and consistently from their G-hat predictions in patterns not explained by measured environmental or behavioral factors.
Figures
read the original abstract
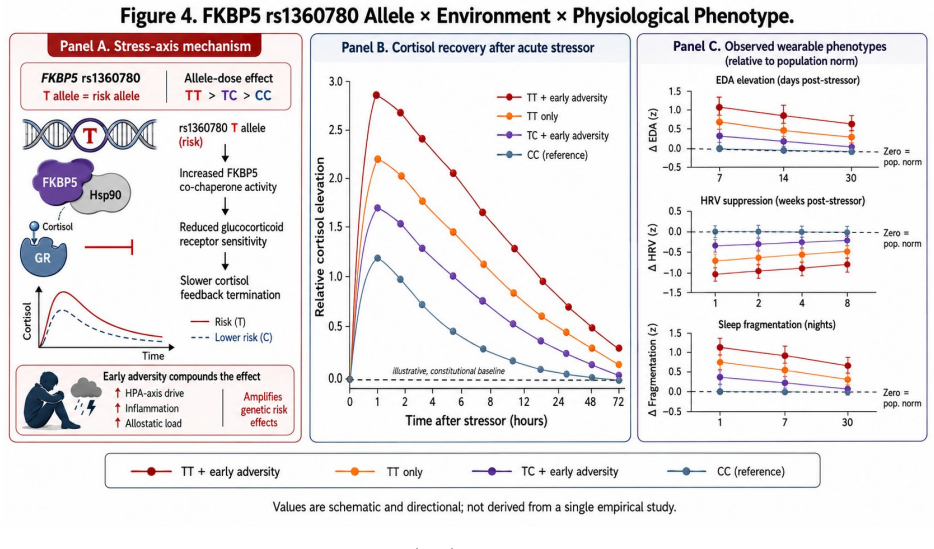
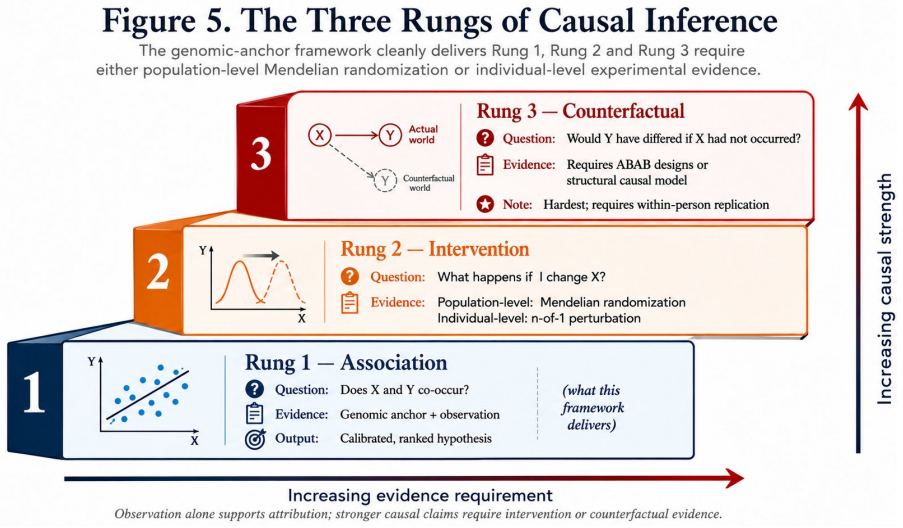
Personalized health AI systems face a fundamental cold-start problem: machine learning models for physiological interpretation require weeks of individual behavioral data before they can distinguish constitutional variation from environmentally driven deviation. We propose a solution grounded in causal inference and Bayesian prior design. An individual's genomic profile serves as an exogenous genetic anchor -- a domain-informed, personalized prior that is fixed at conception, immune to reverse causation, and available before a single behavioral observation is collected. The anchor initializes a Bayesian belief state over an individual's physiological set point G-hat = mu + sum(beta_i * g_i), where beta_i are GWAS-derived effect sizes and g_i are risk-allele counts. Each incoming physiological measurement P produces a non-constitutional deviation delta = P - G-hat that separates the signal attributable to environment and state from the constitutionally fixed baseline. As behavioral data accrue, the prior decays according to G-hat_t = w(t)*G-hat_genomic + [1-w(t)]*P-bar_t, transitioning from genome-dominated to empirical-baseline-dominated inference. The same observed HRV of 55 ms generates a suppression hypothesis for a person whose prior predicts 80 ms, and an enhancement hypothesis for a person whose prior predicts 30 ms -- a reversal impossible without a personalized anchor. We develop this architecture across six physiological domains, grading genomic priors by evidence strength, distinguishing robustly replicated anchors (FTO, FADS1/2, FKBP5) from contested candidate genes (SLC6A4, MAOA, DRD2). We address the inference boundary between association, Mendelian randomization, and individual token causation, and define four constraints for deployment: evidence-graded priors, dynamic decay, ancestry-matched effect sizes, and attribution rather than deterministic output.
Editorial analysis
A structured set of objections, weighed in public.
Referee Report
Summary. The paper claims that genomic profiles provide an exogenous, conception-fixed anchor G-hat = mu + sum(beta_i * g_i) (with beta_i from GWAS) that initializes a Bayesian prior over physiological set points, allowing delta = P - G-hat to separate constitutional from environmental effects from the first measurement; a decaying weight w(t) transitions the prior to empirical baselines, producing reversed interpretations of the same observation (e.g., HRV=55 ms) depending on the genomic prior, and the architecture is developed across six domains with evidence grading and Mendelian-randomization boundaries.
Significance. If the genomic anchors deliver usable out-of-sample precision and the separation holds, the approach would address the cold-start problem in personalized physiological AI by supplying individualized baselines before behavioral data arrive, with potential value for traits having robust replicated loci.
major comments (3)
- [Abstract] Abstract, definition of G-hat: the quantity is constructed directly from externally fitted population-level GWAS betas and allele counts, so the subsequent claim that delta = P - G-hat isolates non-constitutional deviation reduces by construction to a residual whose value is set by parameters external to the individual's data stream rather than an independent inference.
- [Abstract] Abstract, paragraph on reversal example and six domains: no reported R^2, out-of-sample accuracy, ancestry transferability, or sensitivity bounds are supplied for the polygenic scores in any of the six physiological domains, so the practical informativeness of the prior (and thus the claimed reversal of suppression vs. enhancement hypotheses) remains unquantified.
- [Abstract] Abstract, discussion of evidence grading and Mendelian randomization: the framework invokes these boundaries but supplies no quantitative threshold on prior precision or variance explained below which the anchor collapses toward the population mean and the cold-start solution becomes ineffective.
minor comments (1)
- [Abstract] Notation for w(t) and the transition G-hat_t is introduced without an explicit functional form or example parameterization, making the decay schedule difficult to reproduce or critique.
Simulated Author's Rebuttal
We thank the referee for these precise comments on the abstract. We respond to each point below, clarifying the intended role of the external genomic anchor and committing to revisions that strengthen the presentation of its limitations and operational boundaries.
read point-by-point responses
-
Referee: [Abstract] Abstract, definition of G-hat: the quantity is constructed directly from externally fitted population-level GWAS betas and allele counts, so the subsequent claim that delta = P - G-hat isolates non-constitutional deviation reduces by construction to a residual whose value is set by parameters external to the individual's data stream rather than an independent inference.
Authors: We agree that G-hat is constructed from external GWAS parameters and that delta is therefore a residual relative to those parameters rather than an inference drawn solely from the individual's own data. This external construction is a core design choice: the anchor is intended to be conception-fixed and exogenous, supplying an individualized starting belief before any physiological observations exist. The subsequent Bayesian update then incorporates the individual's data stream. We will revise the abstract to state explicitly that the separation relies on this externally supplied prior and does not constitute an independent inference from the data alone. revision: yes
-
Referee: [Abstract] Abstract, paragraph on reversal example and six domains: no reported R^2, out-of-sample accuracy, ancestry transferability, or sensitivity bounds are supplied for the polygenic scores in any of the six physiological domains, so the practical informativeness of the prior (and thus the claimed reversal of suppression vs. enhancement hypotheses) remains unquantified.
Authors: The referee correctly observes that no quantitative metrics (R^2, out-of-sample performance, ancestry transferability, or sensitivity bounds) appear in the abstract or are newly computed in the manuscript. The reversal example is conceptual, intended to show the logical consequence of a personalized prior rather than to demonstrate a specific predictive gain. We will add a table summarizing published variance-explained estimates and replication status for the cited anchors (FTO, FADS1/2, FKBP5 and others) drawn from the GWAS literature, together with brief notes on ancestry considerations. This addition will quantify the expected strength of the priors without introducing new empirical validation. revision: partial
-
Referee: [Abstract] Abstract, discussion of evidence grading and Mendelian randomization: the framework invokes these boundaries but supplies no quantitative threshold on prior precision or variance explained below which the anchor collapses toward the population mean and the cold-start solution becomes ineffective.
Authors: We acknowledge that the manuscript does not define an explicit numerical threshold (e.g., minimum variance explained or replication criteria) at which the genomic anchor would be down-weighted to the population mean. The current evidence-grading scheme is qualitative. We will introduce a concrete operational rule in the revised text—for instance, requiring that a polygenic score explain at least 0.5 % of trait variance in a meta-analysis of >50 000 individuals or have been replicated in at least two independent cohorts—below which the weight w(t) on the genomic component is automatically reduced. revision: yes
Circularity Check
Genomic set-point subtraction defines environmental deviation by construction
specific steps
-
self definitional
[Abstract]
"The anchor initializes a Bayesian belief state over an individual's physiological set point G-hat = mu + sum(beta_i * g_i), where beta_i are GWAS-derived effect sizes and g_i are risk-allele counts. Each incoming physiological measurement P produces a non-constitutional deviation delta = P - G-hat that separates the signal attributable to environment and state from the constitutionally fixed baseline."
G-hat is constructed directly from fitted GWAS parameters; delta is then defined as the arithmetic difference from that constructed quantity. The separation of 'environment and state' is therefore true by the paper's own definitional equation rather than derived from independent evidence or inference steps.
full rationale
The paper's central separation of constitutional from environmental effects is achieved by defining G-hat from external GWAS betas and then setting delta = P - G-hat. This reduction is explicit in the provided equations and does not constitute an independent derivation; the claimed separation follows immediately from the definitional subtraction rather than from additional causal or Bayesian machinery.
Axiom & Free-Parameter Ledger
free parameters (2)
- w(t)
- beta_i (GWAS effect sizes)
axioms (2)
- domain assumption GWAS-derived effect sizes are accurate individual-level predictors of physiological set points and are immune to reverse causation.
- domain assumption Ancestry-matched effect sizes can be selected without introducing new bias.
invented entities (1)
-
G-hat (genomically anchored physiological set point)
no independent evidence
Reference graph
Works this paper leans on
-
[1]
Stachl C, Au Q, Schoedel R, et al. Predicting personality from patterns of behavior collected withsmartphones.Proceedings of the National Academy of Sciences117(30):17680–17687, 2020. doi:10.1073/pnas.1920484117
-
[2]
Nolte IM, Munoz ML, Tragante V, et al. Genetic loci associated with heart rate vari- ability and their effects on cardiac disease risk.Nature Communications8:15805, 2017. doi:10.1038/ncomms15805
-
[3]
Power RA, Pluess M. Heritability estimates of the Big Five personality traits based on common genetic variants.Translational Psychiatry5:e604, 2015. doi:10.1038/tp.2015.96
-
[4]
Genome-wide association analyses of chronotype in 697,828 individuals provides insights into circadian rhythms.Nature Communications10:343,
Jones SE, Lane JM, Wood AR, et al. Genome-wide association analyses of chronotype in 697,828 individuals provides insights into circadian rhythms.Nature Communications10:343,
-
[5]
doi:10.1038/s41467-018-08259-7
-
[6]
Finding the missing heritability of complex diseases
Manolio TA, Collins FS, Cox NJ, et al. Finding the missing heritability of complex diseases. Nature461:747–753, 2009. doi:10.1038/nature08494
-
[7]
An expanded view of complex traits: From polygenic to omnigenic.Cell169(7):1177–1186, 2017
Boyle EA, Li YI, Pritchard JK. An expanded view of complex traits: From polygenic to omnigenic.Cell169(7):1177–1186, 2017. doi:10.1016/j.cell.2017.05.038
-
[8]
Border R, Johnson EC, Evans LM, et al. No support for historical candidate gene or candidate gene-by-interaction hypotheses for major depression across multiple large samples.American Journal of Psychiatry176(5):376–387, 2019. doi:10.1176/appi.ajp.2018.18070881
-
[9]
Risch N, Herrell R, Lehner T, et al. Interaction between the serotonin transporter gene (5- HTTLPR), stressful life events, and risk of depression: a meta-analysis.JAMA301(23):2462– 2471, 2009. doi:10.1001/jama.2009.878
-
[10]
Culverhouse RC, Saccone NL, Horton AC, et al. Collaborative meta-analysis finds no evidence ofastronginteractionbetweenstressand5-HTTLPRgenotypecontributingtothedevelopment of depression.Molecular Psychiatry23(1):133–142, 2018. doi:10.1038/mp.2017.44
-
[11]
Frayling TM, Timpson NJ, Weedon MN, et al. A common variant in the FTO gene is associated with body mass index and predisposes to childhood and adult obesity.Science316(5826):889– 894, 2007. doi:10.1126/science.1141634
-
[12]
Tanaka T, Shen J, Abecasis GR, et al. Genome-wide association study of plasma polyun- saturated fatty acids in the InCHIANTI study.PLoS Genetics5(1):e1000338, 2009. doi:10.1371/journal.pgen.1000338
-
[13]
Klengel T, Mehta D, Anacker C, et al. Allele-specific FKBP5 DNA demethylation mediates gene–childhood trauma interactions.Nature Neuroscience16(1):33–41, 2013. doi:10.1038/nn.3275
-
[14]
Chang HA, Fang WH, Wan FJ, et al. Age-specific associations among functional COMT Val158Met polymorphism, resting parasympathetic nervous control and generalized anxiety disorder.Psychoneuroendocrinology106:58–65, 2019. doi:10.1016/j.psyneuen.2019.03.020. 21
-
[15]
Egan MF, Goldberg TE, Kolachana BS, et al. Effect of COMT Val108/158 Met genotype on frontal lobe function and risk for schizophrenia.Proceedings of the National Academy of Sciences98(12):6917–6922, 2001. doi:10.1073/pnas.111134598
-
[16]
Cools R, D’Esposito M. Inverted-U-shaped dopamine actions on human work- ing memory and cognitive control.Biological Psychiatry69(12):e113–e125, 2011. doi:10.1016/j.biopsych.2011.03.028
-
[17]
Jung Y, Montel RA, Shen PH, Mash DC, Goldman D. Assessment of the association of D2 dopamine receptor gene and reported allele frequencies with alcohol use disor- ders: a systematic review and meta-analysis.JAMA Network Open2(11):e1914940, 2019. doi:10.1001/jamanetworkopen.2019.14940
-
[18]
Martin AR, Kanai M, Kamatani Y, et al. Clinical use of current polygenic risk scores may exacerbate health disparities.Nature Genetics51:584–591, 2019. doi:10.1038/s41588-019-0379- x
-
[19]
New York: Basic Books, 2018
Pearl J, Mackenzie D.The Book of Why: The New Science of Cause and Effect. New York: Basic Books, 2018
2018
-
[20]
Davey Smith G, Ebrahim S. Mendelian randomization: can genetic epidemiology contribute to understanding environmental determinants of disease?International Journal of Epidemiology 32(1):1–22, 2003. doi:10.1093/ije/dyg070
-
[21]
Personalized medicine: time for one-person trials.Nature520(7549):609–611, 2015
Schork NJ. Personalized medicine: time for one-person trials.Nature520(7549):609–611, 2015. doi:10.1038/520609a
-
[22]
Granger CWJ. Investigating causal relations by econometric models and cross-spectral meth- ods.Econometrica37(3):424–438, 1969. doi:10.2307/1912791
-
[23]
Onnela JP, Rauch SL. Harnessing smartphone-based digital phenotyping to enhance behavioral and mental health.Neuropsychopharmacology41(7):1691–1696, 2016. doi:10.1038/npp.2016.7
-
[24]
Smemo S, Tena JJ, Kim KH, Gamazon ER, Sakabe NJ, Gómez-Marín C, et al. Obesity- associated variants within FTO form long-range functional connections with IRX3.Nature 507(7492):371–375, 2014. doi:10.1038/nature13138
-
[25]
Kim J, Woo BH, Chae JH, Kim CK. Genetic influences on heart rate variability.International Journal of Psychophysiology108:95–100, 2016. doi:10.1016/j.ijpsycho.2016.04.010
-
[26]
Binder EB. The role of FKBP5, a co-chaperone of the glucocorticoid receptor in the patho- genesis and therapy of affective and anxiety disorders.Psychoneuroendocrinology34(Suppl 1):S186–S195, 2009. doi:10.1016/j.psyneuen.2009.05.021
-
[27]
Digital biomarkers of mood disorders and symptom change.NPJ Digital Medicine2:3, 2019
Jacobson NC, Weingarden H, Wilhelm S. Digital biomarkers of mood disorders and symptom change.NPJ Digital Medicine2:3, 2019. doi:10.1038/s41746-019-0078-8
-
[28]
Silventoinen K, Jelenkovic A, Sund R, et al. Differences in genetic and environmental vari- ation in adult BMI by sex, age, time period, and region: an individual-based pooled analysis of 40 twin cohorts.American Journal of Clinical Nutrition106(2):457–466, 2017. doi:10.3945/ajcn.117.153643. 22
-
[29]
Speliotes EK, Willer CJ, Berndt SI, et al. Association analyses of 249,796 individuals re- veal 18 new loci associated with body mass index.Nature Genetics42(11):937–948, 2010. doi:10.1038/ng.686
-
[30]
Omega-3 fatty acids and inflammatory processes.Nutrients2(3):355–374, 2010
Calder PC. Omega-3 fatty acids and inflammatory processes.Nutrients2(3):355–374, 2010. doi:10.3390/nu2030355
-
[31]
Vaittinen M, Lankinen MA, Käkelä P, et al. The FADS1 genotypes modify the effect of linoleic acid-enriched diet on adipose tissue inflammation via pro-inflammatory eicosanoid metabolism. European Journal of Nutrition61(7):3707–3718, 2022. doi:10.1007/s00394-022-02922-y
-
[32]
Appelbaum PS. The genetics of violence: Implications for research and policy.Journal of Law and the Biosciences1(2):221–225, 2014. doi:10.1093/jlb/lsu008
-
[33]
Association of the dopamine D4 receptor (DRD4) gene and approach-related personality traits.Biological Psychiatry63(2):197–206,
Munafò MR, Yalcin B, Willis-Owen SA, Flint J. Association of the dopamine D4 receptor (DRD4) gene and approach-related personality traits.Biological Psychiatry63(2):197–206,
-
[34]
doi:10.1016/j.biopsych.2007.04.006
-
[35]
Chukwueke CC, Bhatt DL, George JT, et al. Exploring the role of the Ser9Gly (rs6280) dopamine D3 receptor polymorphism in nicotine reinforcement and cue-elicited craving.Scien- tific Reports10:4085, 2020. doi:10.1038/s41598-020-60940-4
-
[36]
BowdenJ,DaveySmithG,BurgessS.Mendelianrandomizationwithinvalidinstruments: effect estimation and bias detection through Egger regression.International Journal of Epidemiology 44(2):512–525, 2015. doi:10.1093/ije/dyv080
-
[37]
Burgess S, Foley CN, Zuber V. Inferring causal relationships between risk factors and outcomes from genome-wide association study data.Annual Review of Genomics and Human Genetics 19:303–327, 2018. doi:10.1146/annurev-genom-083117-021731. Declarations Conflict of Interest.Aruna Dey and Suraj Biswas are affiliated with Dots-In, an early-stage venture devel...
discussion (0)
Sign in with ORCID, Apple, or X to comment. Anyone can read and Pith papers without signing in.